Author: seth bauer

  • Assess Knowledge using the Power BI Skills Matrix

    Assess Knowledge using the Power BI Skills Matrix

    Power BI took the BI world by storm 5 years ago, there has been a release of the Power BI Desktop almost every single month. The infant that was Power BI has grown into a fully grown behemoth of an enterprise tool. It covers the spectrum of data access and storage options. It has internal and 3rd party tools that provide capabilities that are second to none. Top that off with its flexible licensing and implementation models within organizations and it is no wonder it is in front of the pack. As a result of that pace and growth, the amount of knowledge and skills required to build, manage and implement Power BI has also grown significantly. This has resulted in “Power BI”, meaning a lot of things, to many different people. Today we aim to solve that problem by introducing the Power BI Skills Matrix.

    First in a three-part series

    This is the first post in a three-part series. It is meant to help people make an honest assessment of their skills. The intent is to enable everyone to be able to clearly articulate their skills to themselves and others. In addition, this content can also be used by hiring managers and recruiters as a litmus test to better engage with individuals around their Power BI technical skills. The second post will focus on techniques for honing skills. The third will focus on methods or behaviors that will help people sell their skills and themselves in an interview

    Skills Image people working on computers

    The aim of this series is to bring some clarity around what everyone can, and should, expect from individuals who work with “Power BI”.

    Focus Areas

    A number of job requirements and focus areas rely heavily on one or more areas of Power BI. Meanwhile, the generalization of the term “Power BI” in conversation and in job descriptions can drive confusion. An interviewer may only be focused on one skill or another. It is good for everyone to understand the entire scope of skills. Then we can collectively understand what might be expected in a particular role. If you have an interest in what those specific role areas might be, check out Steve Campbell’s blog here where he dives into some of those specifics.

    During the last 6 months, I’ve been extensively interviewing for Power BI Developer and Data Engineering roles. I’ve had the pleasure to speak with a wide variety of candidates across the United States. We ran them all through the same battery of questions and have discovered some consistent experiences. I believe this series is a great way for me to share my thoughts on what sets apart the great candidates from those I move past in regards to their technical skills.

    Rate Yourself

    To begin with, you need a litmus test, so we’ll start with a little exercise. Think about your level of expertise in Power BI and rate yourself from 1 to 100.
    1 – you just heard about Power BI
    100 – You are a Power BI Master

    What did you rate yourself?

    I’ll describe the general skills that align to each of these ratings. After that, we’ll see if what you have in your mind matches the output of the Skills Matrix. I designed a simple grid of 10 increasingly difficult skills in 5 different areas. Each cell is worth 2 points and there are 50 cells, therefore a total of 100 pts. Each column can have a max point total of 20. The more points in a skill column, the stronger you are in that particular area. This should correspond to specific roles you would be a good fit for. As a result, the more overall experience you have, the higher the overall score.

    Each of the skills in a rating will build on the previous level, the skills represented carry forward to all other levels. For instance, if you reach row 5 for Model, you know you already have 10 pts for that column.

    There is a little room for interpretation as Enterprise skills in Connect/Transform may be in other tools. Its the core progressions that count the most in terms of expertise.

    Power BI Skills Matrix
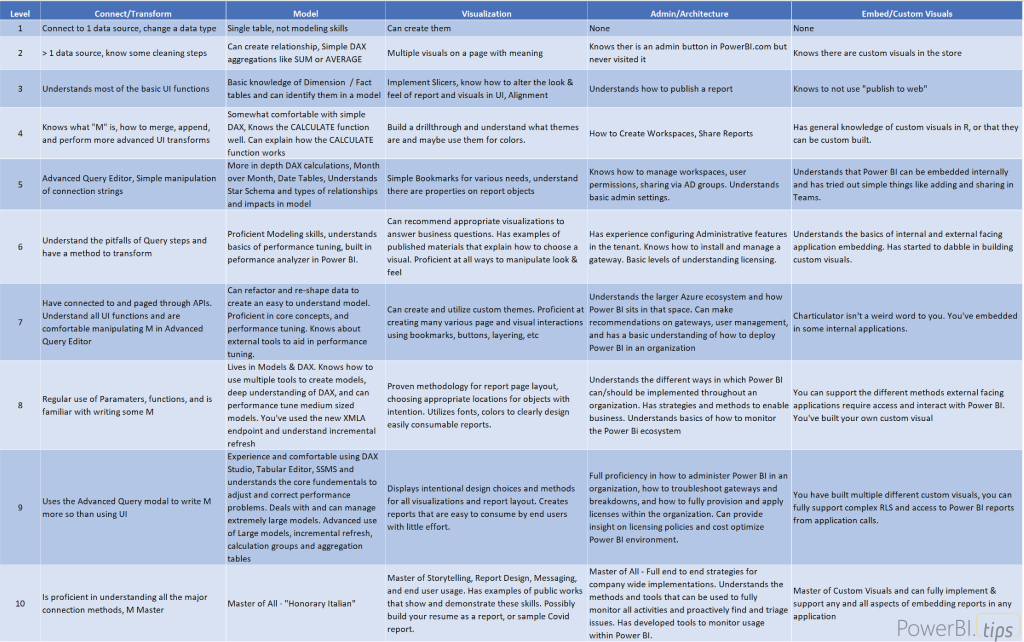
    Power BI Skills Matrix (To see a large version – Right Click and Select Open Image in New Tab)

    Now, let’s go through the exercise of rating yourself again. You should be able to clearly see which skills you are strongest in and what your overall knowledge (score) of Power BI would be. Did it match your initial thoughts?

    Be honest with yourself and your skills. One of the worst things you can do is over promise your skills on a resume. Because when it comes time to deliver in a technical discussion, you will likely fall short.

    The Power BI Skills Matrix above provides a straightforward way for individuals to quickly identify strengths and weaknesses from a technical standpoint. There are a wide variety of jobs that may focus more, or less, on the use of these Power BI areas. The first step in getting into any of them is to accurately understand and describe your current skills. The next post in this series will build on this matrix where we’ll recommend next steps. Focusing on learning and improving areas that you might be weak in is key in setting yourself up for success. I hope the community at large finds this useful, and if you have any recommendations for updating or enhancing our matrix, please feel free to let us know.

    If you like the content from PowerBI.Tips, please follow us on all the social outlets to stay up to date on all the latest features and free tutorials.  Subscribe to our YouTube Channel, and follow us on Twitter where we will post all the announcements for new tutorials and content. Alternatively, you can catch us on LinkedIn (Seth) LinkedIn (Mike) where we will post all the announcements for new tutorials and content.

    As always, you’ll find the coolest PowerBI.tips SWAG in our store. Check out all the fun PowerBI.tips clothing and products:
    Store Merchandise

  • Milwaukee Brew City PUG – Sept 2020

    Milwaukee Brew City PUG – Sept 2020

    We were excited to welcome a good friend of PowerBI.Tips Alex Powers to speak with us at this months PUG meeting. Alex blew a bunch of minds by diving into the depths of Calculated Columns and the love or hate relationship we should have with them.

    Calculated Columns are a common element to the new users. Those users typically come from a default analyst mindset of “see the data” then perform the calculation. This pattern can lead to a bunch of performance issues. Alex shows us how to be intentional with our decision making and provides some solid advice throughout. Be sure to check out this video as it is packed with great insights and conversation around this topic for the beginner as well as the long time expert.

    If you like the content from PowerBI.Tips please follow us on all the social outlets. Stay up to date on all the latest features and free tutorials.  Subscribe to our YouTube Channel.  Or follow us on the social channels, Twitter and LinkedIn where we will post all the announcements for new tutorials and content.

    Introducing our PowerBI.tips SWAG store. Check out all the fun PowerBI.tips clothing and products:

    Check out the new Merch!

    Hasta La Vista Data
    Go Ahead Make My Data
    PBIX Hat


    Like and Follow

    If you like the content from PowerBI.Tips, please follow us on all the social outlets to stay up to date on all the latest features and free tutorials.  Subscribe to our YouTube Channel, and follow us on Twitter where we will post all the announcements for new tutorials and content. Alternatively, you can catch us on LinkedIn (Seth) LinkedIn (Mike) where we will post all the announcements for new tutorials and content.

    As always, you’ll find the coolest PowerBI.tips SWAG in our store. Check out all the fun PowerBI.tips clothing and products:
    Store Merchandise

  • Designing a Great Power BI Report

    Designing a Great Power BI Report

    What does it take to design and create a great looking report in Power BI? Do you have a clear understanding of what tools and techniques you should use every time? Recently the owners of PowerBI.Tips had the pleasure of speaking with Reza Rad’s user group on the fundamentals we use to build great looking reports every day.

    This presentation focuses on the basic concepts and things we do for every report. This one isn’t about all the unique features we love talking about leveraging, but rather the nuts and bolts that you can use to make every report shine.

    Key Concepts

    We’d invite you to join us by watching the video where we cover these fundementals in depth.

    1. Discover insights. Who is your audience and what questions can you ask to drive into those key metrics
    2. Define and outline the process for developing key visuals based on those insights
    3. How can you create and use a background to enhance the look & feel of your report
    4. Creating a consistent theme that you can re-use again and again
    5. Using tools like Themes, Scrims or Layouts to help you make this experience more achievable

    Designing a Great Power BI Report

    If you like the content from PowerBI.Tips please follow us on all the social outlets. Stay up to date on all the latest features and free tutorials.  Subscribe to our YouTube Channel.  Or follow us on the social channels, Twitter and LinkedIn where we will post all the announcements for new tutorials and content.

    Introducing our PowerBI.tips SWAG store. Check out all the fun PowerBI.tips clothing and products:

    Check out the new Merch!

    Hasta La Vista Data
    Go Ahead Make My Data
    PBIX Hat


  • Update “Enter Data” Table in Service without full Publish

    Update “Enter Data” Table in Service without full Publish

    This tip outlines an easy deployment method for data tables that have been manually added to a model via “Enter data” in Power BI Desktop. This is a very effective method especially as it relates to large model deployments. The scenario is typically seen when you build data tables to support slicer/measure interactions. As those selections are made, each one of the values will generate a different DAX calculation to drive a different insight.

    An example of that setup would look like this.

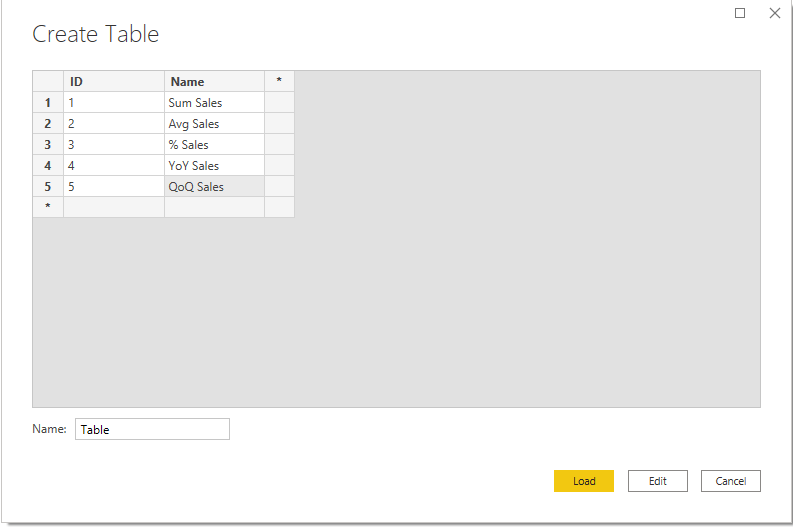
    Create a data table

    First, manually create a data table for slicer selections.

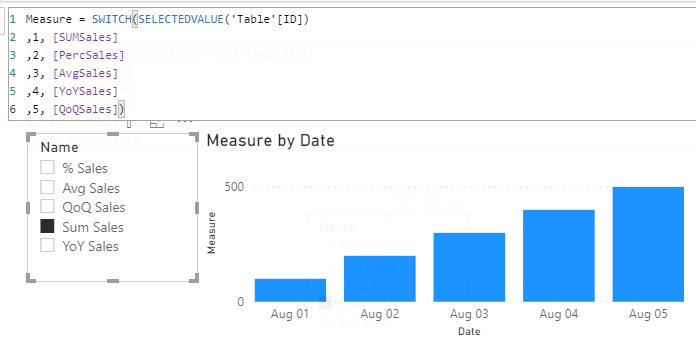
    Create Measure and Slicer

    Create a Measure that uses separate calculations ,and reference the data table in our slicer to determine which measure we want to display.

    As seen above, the slicer has the value from the manually entered data. The id’s correspond to the measures you will want to display in the report visual.

    This pattern gives an amazing amount of flexibility to use the same visual and look at different metrics within the same visual. This removes the need for bookmarks and more visuals for each calculation.

    Typically, I deploy all my metadata changes via ALM toolkit. (I love that tool). However the slicer options and calculations in this method have a data element that needs to be refreshed as well. Which suggests I need to refresh the data model with these types of updates. However, I don’t want to refresh the entire model. So, I opened up my connection to my model in the Power BI Service to investigate.

    You can connect to your Power BI workspace Analysis Services models by following these steps.

    Connect to Analysis Services Model in Power BI

    First ensure you have the XMLA endpoint enabled appropriately. This is under Settings > Admin Portal > Capacity Settings > (Select Capacity) > More Options > Workloads

    Once we have the capacity setup up. Copy the link from your Premium Workspace. Click on the ellipses next to the workspace and select Workspace settings.

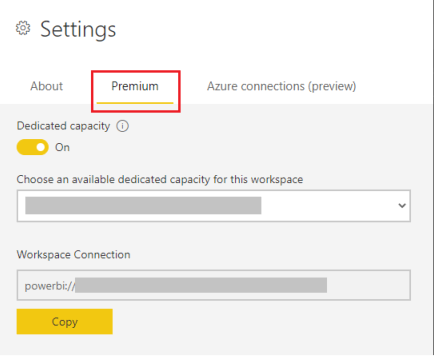
    Under Settings Copy the Workspace Connection

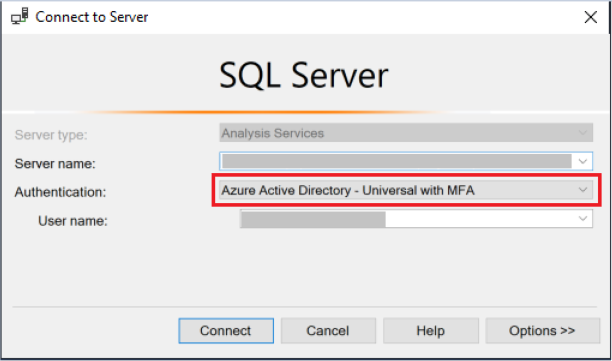
    Open SQL Server Management Studio and apply the connection string in the Server name: location. (Remove the ending of “Initial Catalog” if it is present initially. Set the Authentication to AAD-Universal with MFA and enter your user name (email address) in that section.

    Locate the Code

    After getting hooked up, my “There has got to be a way” hat went on and I started digging into the objects in SQL Server Management Studio (SSMS).

    Mike and I noticed that the entire Power Query query is part of the connection within the table definition. Part of that query is the binary string used when a manual data table is created. Could it be, we could update the local PBIX, grab that binary code and replace the binary in this table!? “YES!”

    Here is how you do that.

    Right click on the table name > select “Script Table as” > select “CREATE OR REPLACE to” > select “New Query Editor Window” (SSMS hates screenshots apparently, so I could not snag them)

    Now that you have the query open, scroll down till you see your Power Query code. Search for the very begining where you see the binary for your data table. Replace this binary string with the new string you have in your PBIX file.

    Pay close attention that the binary is wrapped in ‘\’ in the front and before the double quotes at the end. You have to keep it that way or it will break your code.

    Execute the query

    Refresh your Power BI dataset table

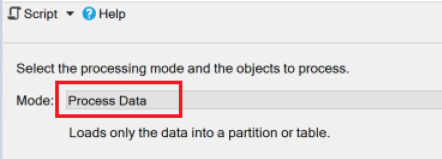
    Right click and select Process Table to refresh the data in the table. Choose Process Data

    BAM! You’ve just updated the table in the Service without the need to refresh the entire model!

    As a result of these findings, I’m very interested in what other parts of the Power Query connections we can update/modify. I think I’ll be exploring those further in the coming months. I am really excited that Power BI has moved onto the Tabular Object Model and we now have the ability to use XMLA read/write. There is so much flexibility and speed in our deployments now! We’re looking forward to finding new and interesting ways to push changes without the data. We hope you find this tip useful, thanks for reading.

    Requirements for the above tutorial to work:

    1. Be using a Premium Capacity
    2. In your Power BI Desktop, enable the enhanced metadata format
    3. Toggle on the XMLA Read/Write in the Power BI Service (described above)

    If you like the content from PowerBI.Tips, please follow us on all the social outlets to stay up to date on all the latest features and free tutorials.  Subscribe to our YouTube Channel, and follow us on Twitter where we will post all the announcements for new tutorials and content. Alternatively, you can catch us on LinkedIn (Seth) LinkedIn (Mike) where we will post all the announcements for new tutorials and content.

    As always, you’ll find the coolest PowerBI.tips SWAG in our store. Check out all the fun PowerBI.tips clothing and products:
    Store Merchandise

  • One Tool to Install them ALL

    One Tool to Install them ALL

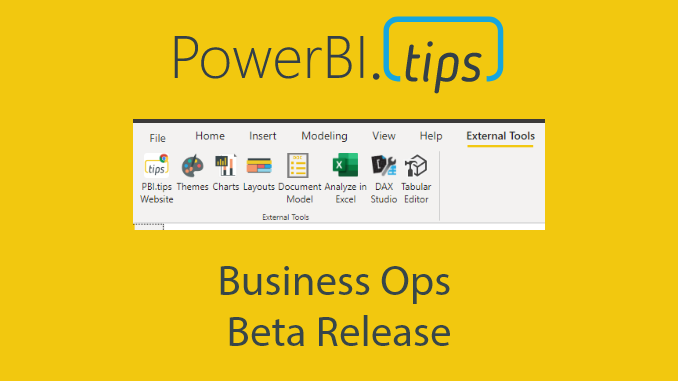
    We are excited to announce a new tool from PowerBI.tips The Business Ops tool. To get this tool Download it here.

    For the Full Story Read on..

    There are many exciting features that we love to see and share when it comes to monthly Power BI releases! The continual improvements still inspire and provide a deeper and richer experience for us all to WOW our report consumers. There are some periodic major changes that come, and we think one of those has arrived with the latest announcement of 3rd party tool integration.

    Add PowerBI.tips Front End tools

    After the great news above, we had our heads down looking at the documentation and were very interested in how we could add our own tools to the External Tools section. After some digging, and reviewing a fantastic blog by Eric Svensen we locked in on how we could our tools even more accessible for you!

    We want to help you get to your favorite PowerBI.tips tools quickly and easily. What follows is what each of these tools offers, and how to easily connect one or all into your Power BI Desktop files for quick connection and use.

    I don’t see “External Tools”

    The first requirement to see the External Tools section is that you must be on July 2020 Desktop. You will NOT see the External Tools section right after you open it. The reason for that is varied, but suffice to say, you need a specific JSON folder created in your Power BI folder structure and an executable to run.
    We’ve made this easy for you, so just read through our choices of tools and we’ll walk you through how to get these buttons created and working for you in no time!

    Tool Choices

    PowerBI.tips – Part of staying engaged is staying current. What better way to do that then start everyday with a link to your favorite site – Power BI.Tips

    Themes – Need to take the general settings you can do in the Desktop to the next level? Adding our Themes capability into your reports gives you full control over the customization of color, font and properties.

    Charts – Utilizing the amazing work from MSFT research in Charticulator, we’ve created a version called Charts. This tool lets you build no code custom visuals that work right alongside the out of the box one’s. Check out our videos if this is new to you!

    Themes Gallery – Sometimes you just need to find a little inspiration. Look no further than our extensive gallery of color themes. Easily pick and download any color theme you find.

    Themes Gallery

    Charts Gallery – Learning how to build the custom visuals in Charts takes a little bit of time, but while you are learning that craft, or are looking for a unique visual check out the gallery of already built custom visuals you can integrate into your reports.

    ChartsGallery

    Layouts – Need to take your report look and feel to the next level? Our Layouts provide some of the best looking backgrounds tailored specifically to Power BI. We use pop up dialogues for contextual explanation, page navigation and hidden slicer functionality to amaze your end users.

    Scrims – Backgrounds for Power BI. We take all the principles we’ve learned in visual design to create amazing visual canvases that don’t distract from the data. Using these single images reduces the need to render all the different shapes and objects on your page making it a faster/better option.

    Model – Are you a data focused individual? Have you played with Power BI dataflows? Use our Model tool to create the metadata objects you want to utilize in your Common Data Model.

    Connections – Streamline your report files for other report authors by pre-configuring the data source connection. Not familiar with how you create PBIDS files? Check out our tutorial.

    Lingo – In 2018 Power Bi introduced the ability to edit the linguistics schema for enhancing your Q&A experience. This tool gives you a clean and simple interface to create and modify your schema.

    Pick Your Browser

    We know our favorites, but you probably have yours as well. Throw in a dash of IT security and you might not have the best experience with a chosen browser. As we know that is the case, you can choose one of our 3 options for kicking off these tools from the Desktop and opening the right browser.

    Install Your Favorites!

    Featured External tool tutorials

    Want to know more about the featured tools in the MSFT blog? We had the chance to welcome the creators of those tools to tell us all about them. Be sure to check out the webinars for all the details on how to get started with them and all the capabilities they offer.

    ALM Toolkit – Schema compare and deployment tool. Fantastic for Application Lifecycle Management (ALM). How to use ALM Toolkit.

    DAX Studio – The only DAX authoring tool you will ever need. 5 part series that explains it all.

    Tabular Editor – An amazing modeling tool that makes working with your model a breeze. 4 part series.

    If you like the content from PowerBI.Tips please follow us on all the social outlets. Stay up to date on all the latest features and free tutorials.  Subscribe to our YouTube Channel.  Or follow us on the social channels, Twitter and LinkedIn where we will post all the announcements for new tutorials and content.

    Introducing our PowerBI.tips SWAG store. Check out all the fun PowerBI.tips clothing and products:

    Check out the new Merch!

    Hasta La Vista Data
    Go Ahead Make My Data
    PBIX Hat


  • Buy and Apply Power BI Premium P license

    Buy and Apply Power BI Premium P license

    I am working on a project that uses Power BI embedded to display reports to external users via an application. I’ve used the progression of A sku’s (embedded license via Azure) to support the various reports. I love using the A sku for various reasons, it has a low point of entry offered in the A1. It is easy to scale up to the higher tiers as I need to. It has the ability to pause a capacity at any time. I also enjoy the flexibility of pay-by-the-hour the license provides. However, I just got to the point where one of our capacities is about to exceed the 10GB of RAM I get on the A3. As a result, I started to compare the A4 sku to the P1 sku. They are the same in terms of cores and RAM (8/25), but the P1 has an option to be cheaper.

    After researching how to buy and apply the Premium P license I realized there wasn’t an end to end explanation of what to expect and how to apply the P sku to my specific region. This is hugely important in order for some of the Service features to work correctly. When committing to large sums of money, I find its always nice to have these answers up front, so I hope the following walk through helps those decision makers out there.

    Analyze the A sku

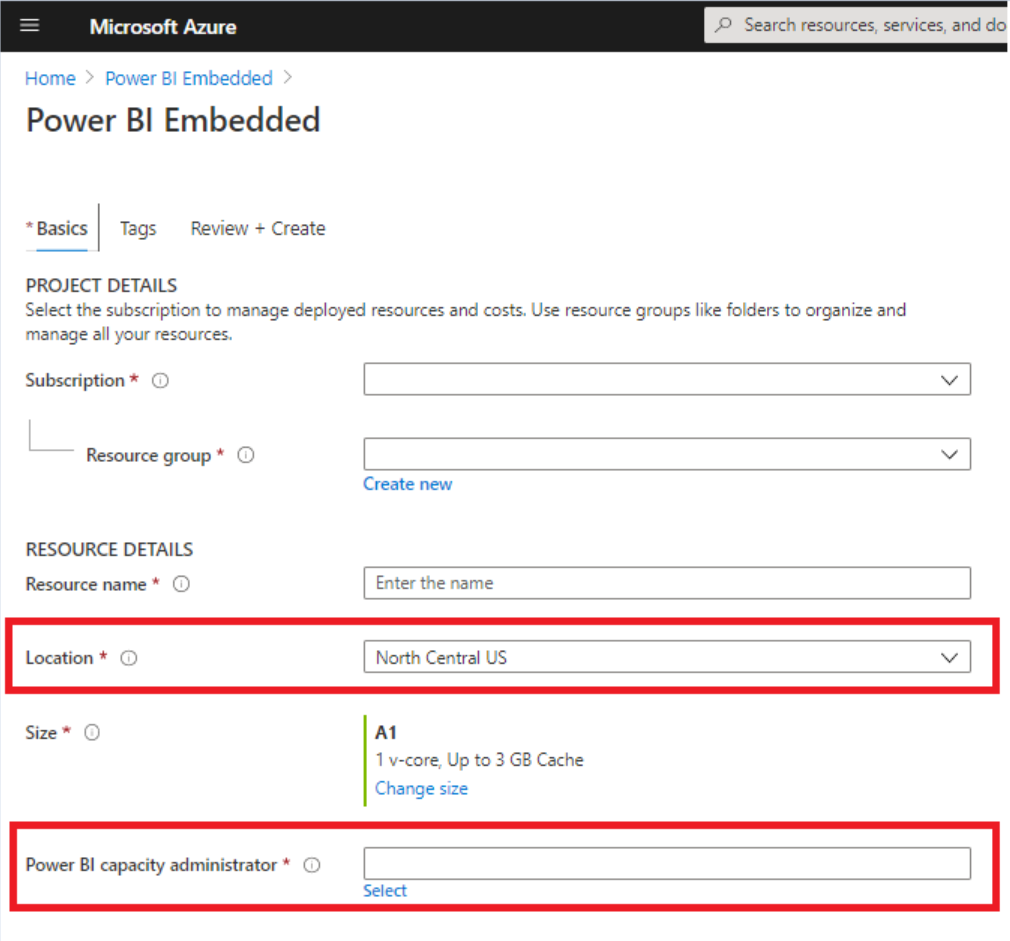
    Before we jump into the P sku, lets take a quick moment to see how an A sku is purchased in Azure. There is documentation out there that explains how to sign up for Premium and includes the A sku in Azure. That can be found here ( https://docs.microsoft.com/en-us/power-bi/admin/service-admin-premium-purchase). However, I want to highlight the two areas that most interest me, that I couldn’t find answers too when trying to commit to buying the P sku. There are two key areas that I care about the most with this purchase. The first, is the location of the capacity (region). Second is who gets assigned as a capacity administrator. When you purchase the A sku, those are front and center. As a result, the license purchase is an easy process because I select them prior to committing any money.

    Purchase the P sku

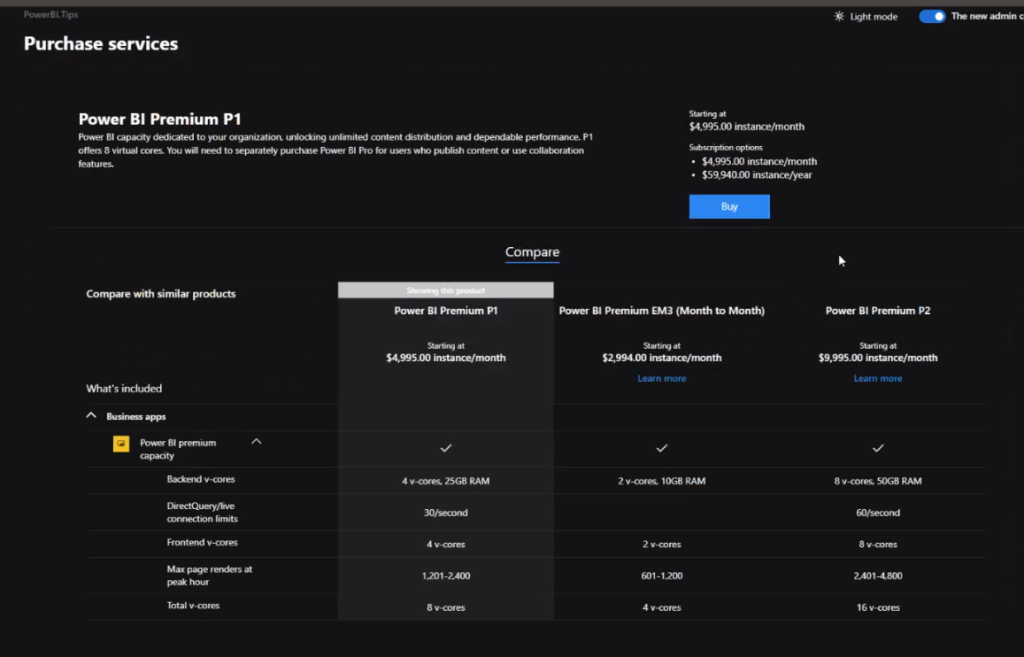
    Unlike the A sku, you purchase the P sku in the Office 365 admin center. The glaring difference from the experience with the A sku is that you purchase the P1 license without any configuration… This can cause a bit of heartburn if you need to ensure that the capacity is applied to the right region upon purchase. For the moment, you can just assume things will come out smelling like roses and move on to the steps to purchase the P1 license. In the O365 Admin Center under Billing you will Select Purchase Services and then Search for Power BI. This pulls up the list of licenses you can choose from and you are going to Select the Power BI Premium P license.

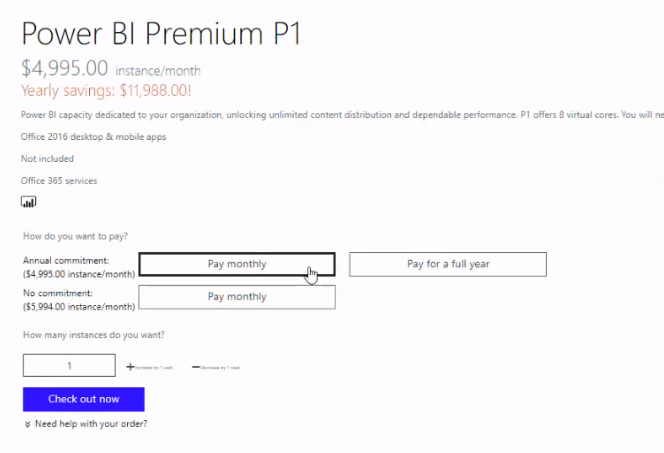
    Selecting the license presents you with the options for payment type.

    Here is where we see the much cheaper price of $4,995.00, but it comes with the yearly commitment. (As a side note, I really wish we had the yearly commitment option with the A sku, with that option available, I wouldn’t even have to muck around with the P sku for my implementation.)

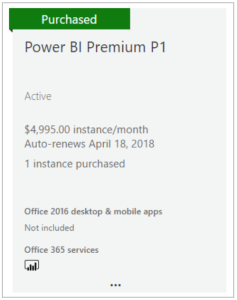
    After you complete the purchase process you can navigate to Purchase Services again and see that the Power BI Premium P license is now active.

    Assign and Configure on Setup

    Now what?

    Well, all you saavy Power BI Admins, we head over to the Power BI Service of course!

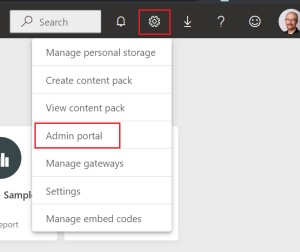
    Log in to your Service (app.powerbi.com) and because you’re all Global Administrators or Power BI Administrators you have access to the Admin Portal. For you first timers, that would be under

    Settings > Admin Portal

    (If you do not see the admin portal you will need to contact your IT or Security guys to grant you the Power BI Administrator Role.)

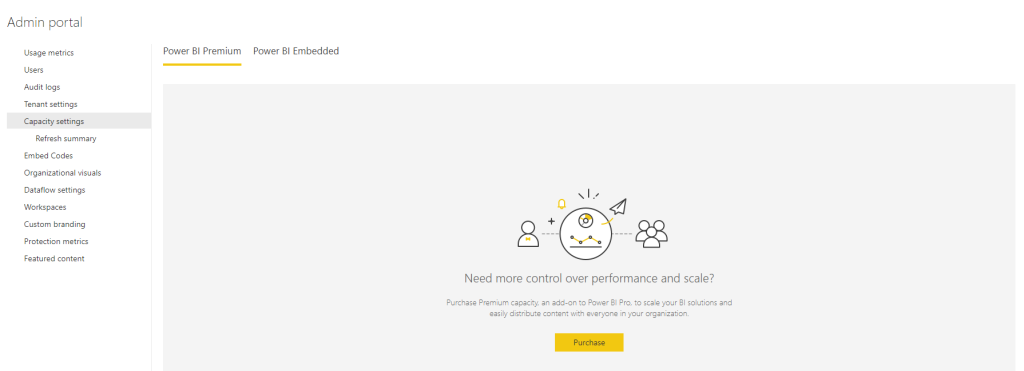
    Now normally when you go into the portal you would see a page that looks like this under Capacity settings.

    But after you purchase the license, in O365, and come back to the Power BI Service you will see this the first time you log in.

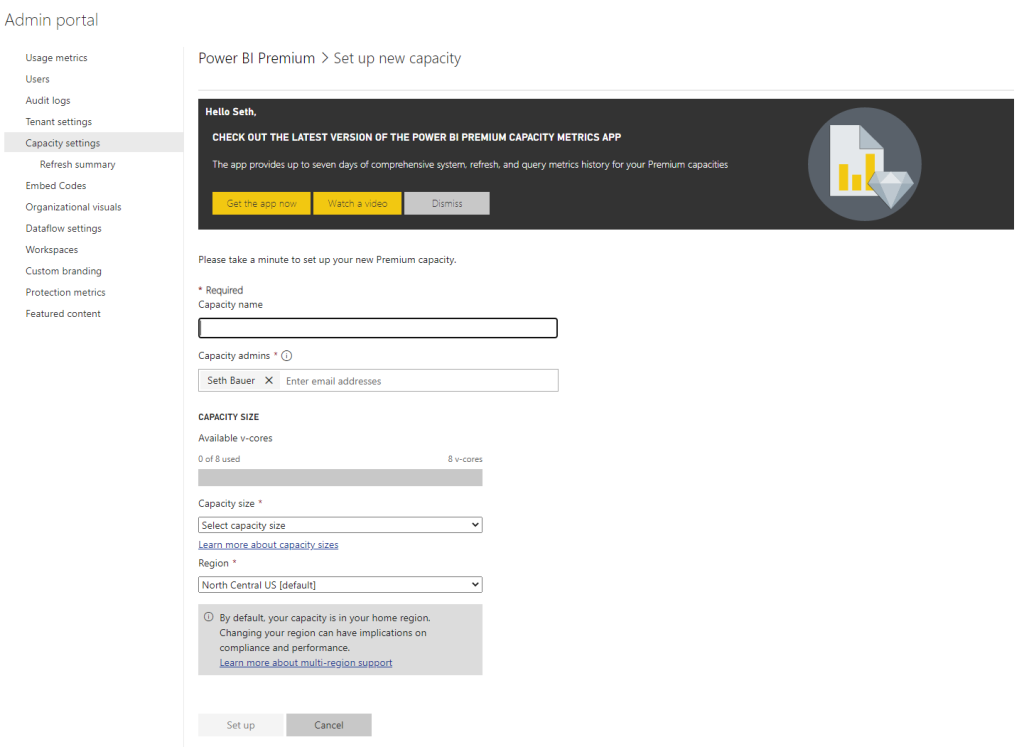
    Click on the Set up new capacity button and you get to the screen that myself and all of you wanted to see from the start. Where you add any additional capacity administrators as well as which region you want to use for your capacity.

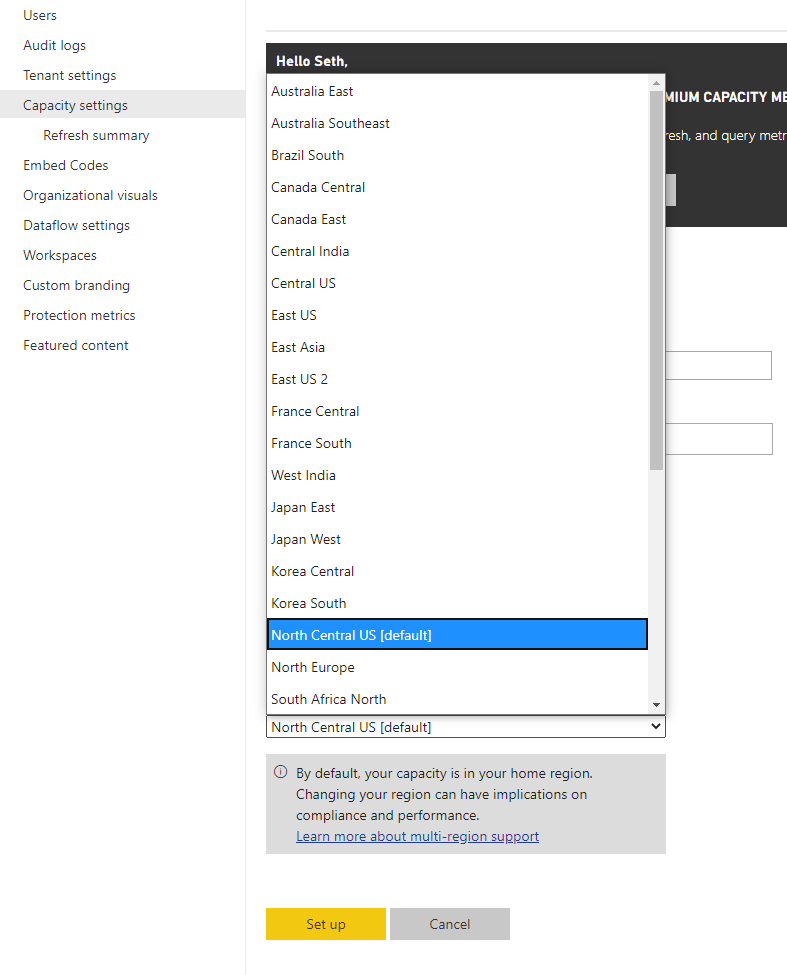
    As the gray box outlines for you, the initial region is the home region of the Power BI tenant, but Clicking on the Region pops up all the other regions you can choose from.

    Make your selections. All that remains to be done is Clicking on the Set up button. Now your capacity is provisioned based on your configuration settings.

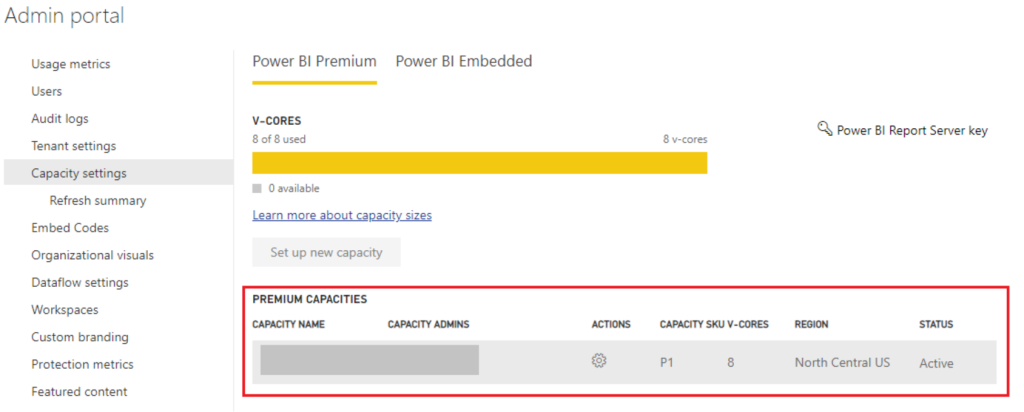
    Your new view when you log in to work with your capacity looks like this. You’ll be back often to monitor and alter any capacity configurations.

    Apply Capacity to Workspace

    I’ll close this out by showing you the final step of how you apply that new capacity to your workspaces.

    Jump back out into the home screen by Clicking Power BI in the upper left hand corner of the browser.

    Click on Workspaces and hover over the workspace that you want to add to the capacity.

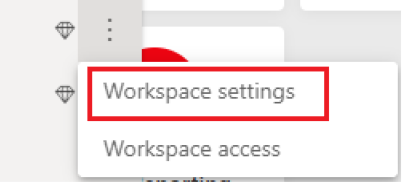
    Click on the ellipses (3 dots) that appear to the far right and Select Workspace settings.

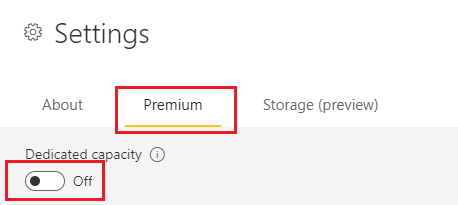
    The Settings dialogue will appear on the right hand side and you will Click on Premium in the header. Give the application a moment and you will be able to toggle the Dedicated capacity to On

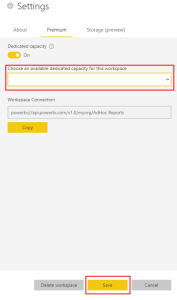
    In the dialogue, Select the newly provisioned capacity and Click on Save.

    You will now see a little diamond next to your workspace name.

    After all that, you now have a Premium P license capacity supporting the datasets and reports in that workspace.

    Wrap Up

    I had too many unresolved questions during this process. I was looking for something like this blog to assure me I was headed in the right direction. Since I didn’t find it, I decided to write up my experience. I want to make sure others with those same questions can to see what it looks like to go through the process from an end to end. Hopefully this perspective helps when making the leap into Power BI Premium P1 licensing.

    If you like the content from PowerBI.Tips, please follow us on all the social outlets to stay up to date on all the latest features and free tutorials.  Subscribe to our YouTube Channel, and follow us on Twitter where we will post all the announcements for new tutorials and content. Alternatively, you can catch us on LinkedIn (Seth) LinkedIn (Mike) where we will post all the announcements for new tutorials and content.

    As always, you’ll find the coolest PowerBI.tips SWAG in our store. Check out all the fun PowerBI.tips clothing and products:
    Store Merchandise

  • Model Performance in DAX Studio

    Model Performance in DAX Studio

    Understand more about your model then you thought possible! This is part two in our series on DAX Studio. If you missed part one be sure to check out the Introduction to DAX Studio.
    In this session Marco Russo shares the fundamentals for model performance in DAX Studio and dives into key areas that you absolutely need to understand. Marco is an accomplished trainer and you won’t find a better resource to guide you on this journey.

    Using DAX Studio in conjunction with Vertipaq Analyzer Marco shows us how we can discover and explore the key statistics about our models.
    Use Vertipaq Analyzer against your open Power BI model or any tabular model. This tool only exports the tabular metadata, not the data! So we can do offline analysis on a model we don’t have access to by having people with permissions export these metrics. Better yet, we can download this into Excel and everything gets broken down for you all the way to your relationships and measures… AMAZING!

    If you like the content from PowerBI.Tips, please follow us on all the social outlets to stay up to date on all the latest features and free tutorials.  Subscribe to our YouTube Channel, and follow us on Twitter where we will post all the announcements for new tutorials and content. Alternatively, you can catch us on LinkedIn (Seth) LinkedIn (Mike) where we will post all the announcements for new tutorials and content.

    As always, you’ll find the coolest PowerBI.tips SWAG in our store. Check out all the fun PowerBI.tips clothing and products:

    Store Merchandise

  • Introduction to DAX Studio

    Introduction to DAX Studio

    Darren Gosbell & Marco Russo join PowerBI.Tips in a 4 part series on how and why to use DAX Studio! They show us why DAX Studio is the ultimate tool for working with DAX queries!

    In this first session we are joined by Darren who gives us a little history on DAX Studio and how we can get started with downloading the tool and getting it up and running. He covers many different areas of the tool including connecting to our various models, the basic functions of the tool, how you can output the results, and everything you need to know to get started.
    Be sure to check out this video and all the rest in the series.

    If you like the content from PowerBI.Tips please follow us on all the social outlets. Stay up to date on all the latest features and free tutorials.  Subscribe to our YouTube Channel.  Or follow us on the social channels, Twitter and LinkedIn where we will post all the announcements for new tutorials and content.

    Introducing our PowerBI.tips SWAG store. Check out all the fun PowerBI.tips clothing and products:

    Check out the new Merch!

    Hasta La Vista Data
    Go Ahead Make My Data
    PBIX Hat


  • Milwaukee Brew City PUG – April 2020

    Milwaukee Brew City PUG – April 2020

    The Milwaukee Brew City PUG for April kicks off with some quick updates and highlights of upcoming events. We spend a quick minute on why we’re so excited about the fantastic line up of webinars that we were able to do recently. They highlight the top 3rd party tools to get the most our of your Power BI experience. We were excited to welcome a brand new Microsoft MVP – Chris Wagner to speak to us in this April PUG. He walks through How to Build a World Class Center of Excellence for Power BI. We also had some great conversation around a myriad of topics at the latter half of the meeting, so be sure to stick around to catch some of that at the end.

    Enjoy the Meeting!

    If you like the content from PowerBI.Tips, please follow us on all the social outlets to stay up to date on all the latest features and free tutorials.  Subscribe to our YouTube Channel, and follow us on Twitter where we will post all the announcements for new tutorials and content. Alternatively, you can catch us on LinkedIn (Seth) LinkedIn (Mike) where we will post all the announcements for new tutorials and content.

    As always, you’ll find the coolest PowerBI.tips SWAG in our store. Check out all the fun PowerBI.tips clothing and products:
    Store Merchandise

  • Keeping it Versatile

    Keeping it Versatile

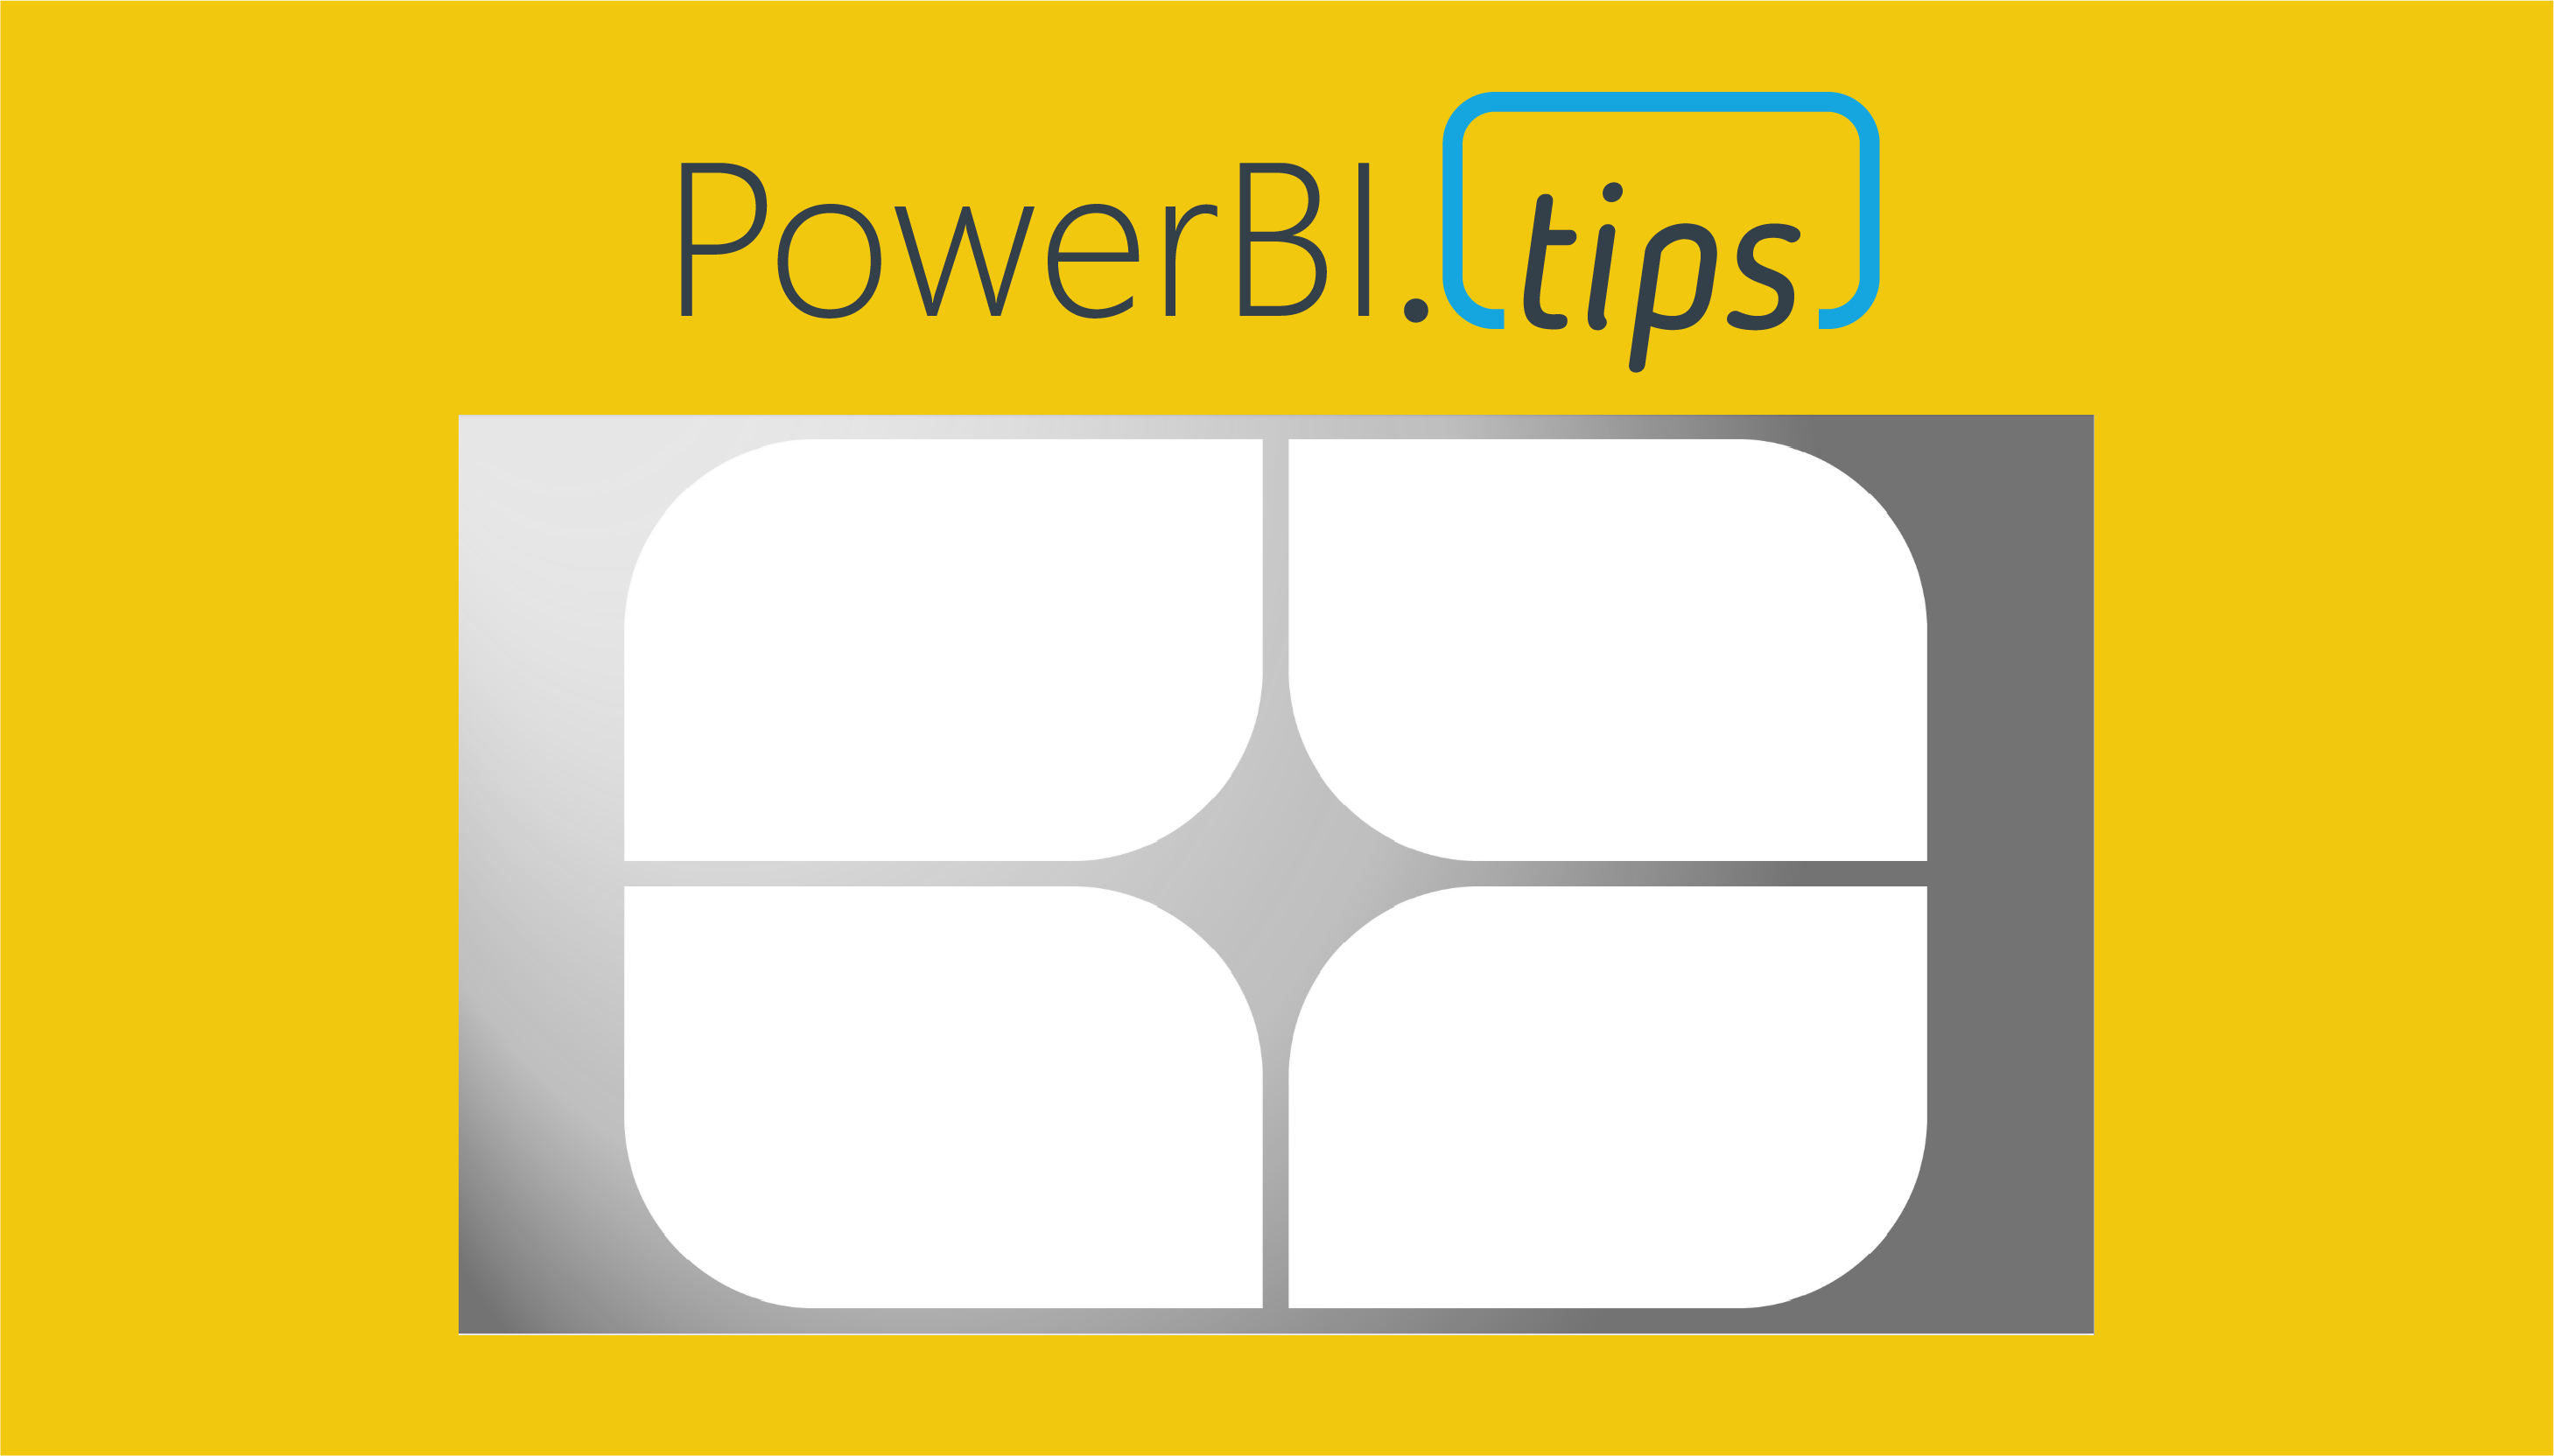
    I was recently working on some new ideas for a Scrim when I stumbled upon something interesting. A scrim is pretty specific in its layout, and this one is no different. The images are set so that the report author can easily snap the visual sizes into the space. This makes the most sense as it is easy and delivers great looking results. However, I believe that some designs will allow us to get much more mileage out of a single Scrim. In this Scrim I have changed the shape of visual spaces and this has led to some interesting outcomes. I’ll be interested if my excitement around the possible use cases for this Scrim are as significant as I think they are. With that said here are some of the biggest highlights of my latest Scrim – Versatile.

    • Gradient background to add depth
    • Transparent background – allows report author to use any background color
    • Visual shapes are curved on two edges
      • Use unique visual shape
      • Use normal square
      • Use area for title
      • Use area for context

    Downloads

    Download this Scrim here:  https://powerbi.tips/product/scrims-versatile/

    For additional details, and how you can implement all the above in this Scrim check out the video below.

    See how to use this Scrim

    If you like the content from PowerBI.Tips, please follow us on all the social outlets to stay up to date on all the latest features and free tutorials.  Subscribe to our YouTube Channel, and follow us on Twitter where we will post all the announcements for new tutorials and content. Alternatively, you can catch us on LinkedIn (Seth) LinkedIn (Mike) where we will post all the announcements for new tutorials and content.

    As always, you’ll find the coolest PowerBI.tips SWAG in our store. Check out all the fun PowerBI.tips clothing and products:
    Store Merchandise