Category: Performance Tips & Tricks

  • More Visuals Mo Problems

    More Visuals Mo Problems

    In some recent conversations the notion of minimizing the number of required visuals came up as a topic. While I know from talking with the Microsoft development team more visuals on a report page increases load time. But I haven’t been able to find any substantial numbers on how performance is impacted by increasing the visual count on a page. Spoiler alert, adding a ton of visuals to a page slows it down.

    Test Set up

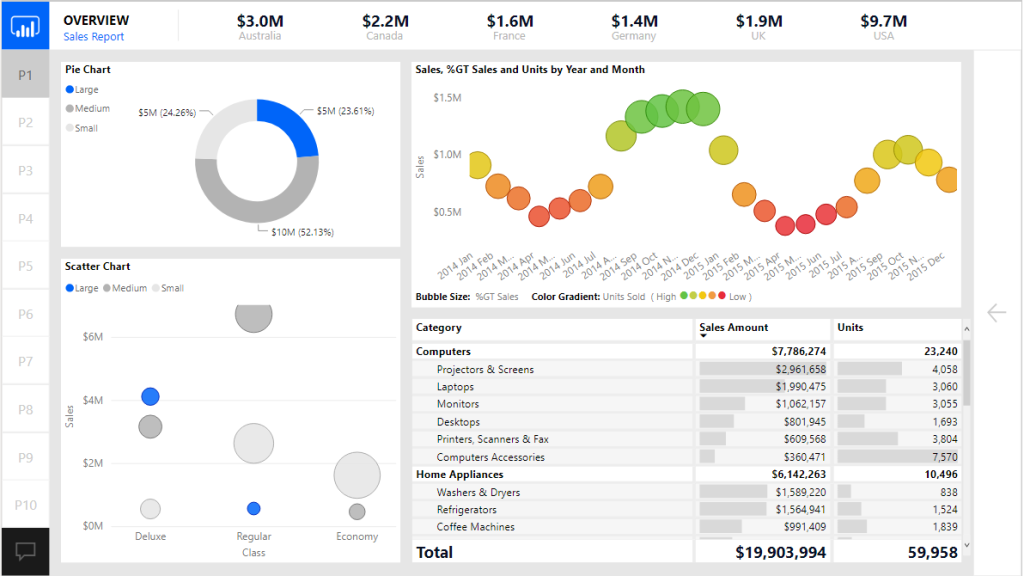
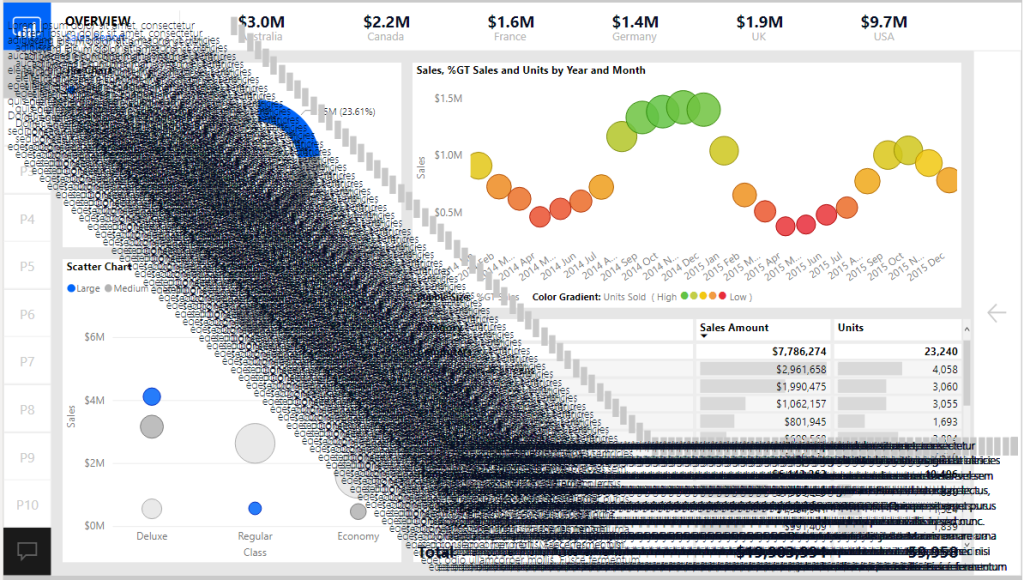
    To begin our test I started with a know report the Microsoft September 2018 Layout. This was a good sample as it already had a number of visuals and buttons on the page. I then proceeded to create a single text box with some text in it. Then copy the text box over one hundred times. All the text boxes are placed into a single group. Grouping the text boxes allows for the ability to toggle on and off all of the visuals with a single click.

    Here is the before image of the report with the text boxes turned off:
    Now with all 100 text boxes turned on. Yes, not pretty I know, but it makes the point.
    Conducting the Test

    Now that the set up was complete we are able to use the performance analyzer to render all the visuals on the page.

    To open the performance analyzer with the new modern Power BI ribbon. Navigate to the View ribbon and click on the Performance analyzer button.

    With the Performance analyzer window open we Click the Start Recording button. This begins how the visuals perform when you interact with the report.

    There are two options at this point to start recording data.

    1. We can click on items on the report page
    2. Click the Refresh visuals button to refresh the entire page

    I chose option number two since I wanted a consistent method to record performance. This removes any human error by performing a sequence of clicks across the screen.

    After clicking the Refresh visuals the Performance analyzer generates a ton of data that we can sift through to understand performance of the report page. You can expand on one of the visual elements to understand how many milliseconds it takes for the visual to render by function.
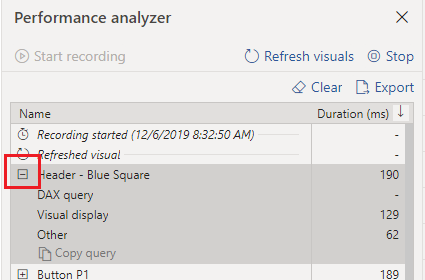
    Note: For more details on each performance component read up on the Microsoft documentation found here: https://docs.microsoft.com/en-us/power-bi/desktop-performance-analyzer

    We can now export the data from the recording by Clicking the Export button.
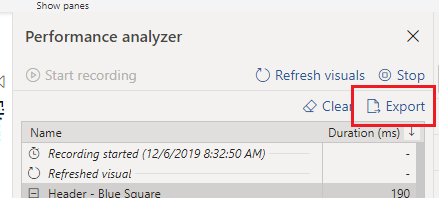
    For my test I ran 5 performance tests with the text boxes turned off and 5 tests with the text boxes turned off. The process was the following:

    1. Click Start Recording
    2. Click Refresh visuals
    3. Click Export to extract the data, name the file for future review
    4. Click Clear to remove all data
    5. Go back to step 2 to Refresh visuals
    6. Repeat process until 5 performance tests are complete
    7. Turn on the Text boxes and repeat the process for 5 performance tests

    The Test Results

    Finally we can dig into the data and figure how much impact we incurred from all the visuals. After a bit of playing around with the datasets in Power Query we are able to come up with the following results.

    At a high level adding the 100 extra text boxes increased the load time from 174 ms up to 3,100 ms which is a approximately a staggering 1700 % increase in load time.

    Here is the detailed break down for average load times compared with and without text boxes.
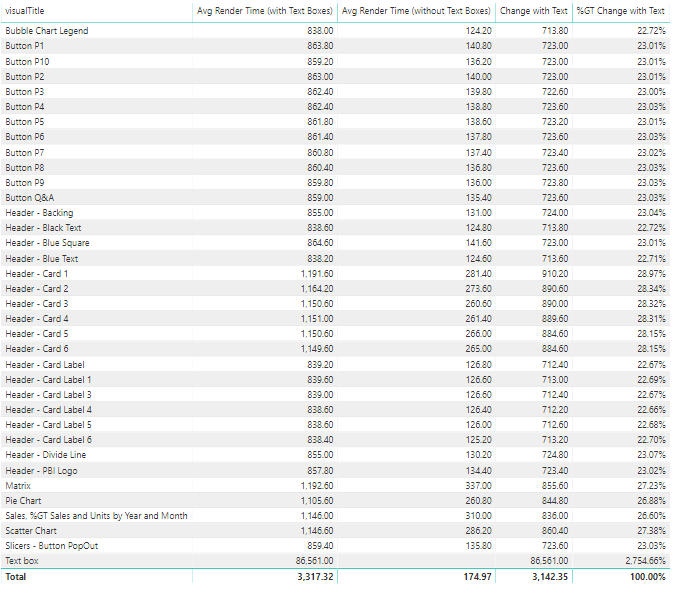
    There are some interesting notes here. When we added the text boxes it caused all other visuals to increase load time from 22 up to 28 % percent longer per object. Clearly the text boxes took the longest to render.

    If you’d like to test this on your own, you can download these materials from this GitHub location: https://github.com/MikeCarlo/PBIReportVisualPerformanceTest

    Implications & Observations

    After completing this test there were a couple of observations that I felt would be best practices when building future reports.

    1. It is important to take time to clearly label your visual elements on the report canvas. Doing so makes it easy to identify each item in the performance analyzer.
    2. Increasing the number of visuals on a page hurts rendering performance. So think carefully about how many visuals you need to add to convey the data story you are trying to tell.
    3. When a visual is not shown it does not impact performance rendering of the page.
    4. A trend I am seeing is individuals are creating really long pages. Meaning the page is 1280 x 3000 or even 4000 pixels long. This is a nice feature that lets the report consumer scroll through multiple visuals. However, this has an unintended consequence adding all the extra visuals is slowing the time for the report to render. Instead of increasing the page length it would be better to control which visuals are being shown by using Bookmarks and Grouping. To learn more about bookmarks & grouping visuals visit:
    5. Limit adding style elements such as drop shadows and visual shading images as these will increase load speeds. Instead push those types of changes down to a background image that can be placed on the page. This is the technique used in creating PowerBI.Tips layouts.

    If you like the content from PowerBI.Tips please follow us on all the social outlets. Stay up to date on all the latest features and free tutorials.  Subscribe to our YouTube Channel.  Or follow us on the social channels, Twitter and LinkedIn where we will post all the announcements for new tutorials and content.

    Introducing our PowerBI.tips SWAG store. Check out all the fun PowerBI.tips clothing and products:

    Check out the new Merch!

    Hasta La Vista Data
    Go Ahead Make My Data
    PBIX Hat


  • Quick Access Toolbar for the Win

    Quick Access Toolbar for the Win

    I’m a lazy engineer.  Let me qualify my statement.  In lazy I mean I like to find the path of least resistance, the shortest distance between two points.  Everyday I challenge myself to be lazy, or efficient how ever you want to view it.  As I have built many reports in Power BI over the years here is a fantastic trick, I use almost every day, Customizing the Quick Access Toolbar.

    Here are a couple reasons why I think this will speed up your report writing.

    • There are only a few shortcuts that I am aware of for Power BI Desktop, thus making your own shortcuts with Hotkeys is faster for repetitive tasks.
    • To achieve a simple task, you might have to jump between ribbons, again adding time.
    • When you set up Hotkeys you don’t have to remove your hand from the keyboard and wiggle your mouse around then come back to the keyboard.  Again, wasting time.

    Enough reasons, if you are still reading this then clearly you are lazy like me.  Let’s just get to the good stuff…

    By default, you get the following Quick Access Toolbar:

    The icons are Save, Undo, and Redo.

    While these icons are good, YOU DON’T NEED THEM… lol

    You can automatically save by using Ctrl + S

    Undo is simply Ctrl + Z

    And Redo… lets be honest no one uses this one.

    Another aspect of the Quick Access Toolbar is when you hit the Alt key you can reveal numbers on the toolbar:

    Pressing the number or letter triggers the next button press. 

    Example:

    • Alt + 1 will automatically save the file

    To take this further you can string together multiple key presses to dig even deeper into the menus

    Example:

    • Alt + H + ii  brings up the import image dialog box
    • Alt + G + D  opens the menu to get data
    • Alt + W + C  Opens the Selection Pane,  Repeating this command closes the Selection Pane

    The downside with multiple commands it takes more time to learn the key strokes to be fast.  As a personal preference I like to use one-step key press options (Ctrl + s or Ctrl + z).  It is easier for my simple mind to remember and commit to memory.  If you use Adobe products for images or video, you will be familiar with this technique.  From my opinion Adobe has some of the best most useful shortcuts that enhance productivity.

    Make it Custom

    Let’s begin customizing our menu. 

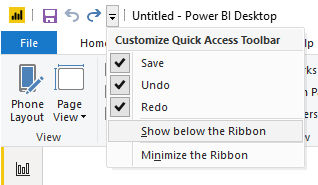
    First Click the Down Arrow at the far right of the toolbar.

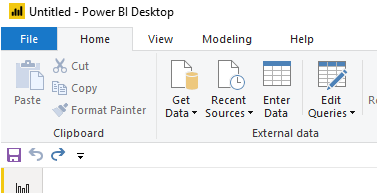
    Click on the item in the dropdown menu called Show below the Ribbon.  This will move the toolbar to the bottom of the ribbon.

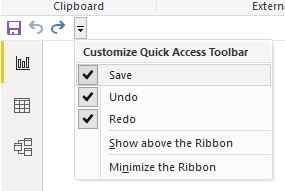
    For each item in the dropdown list Uncheck each item, Save, Undo, and Redo.  This will remove all the items from the toolbar.

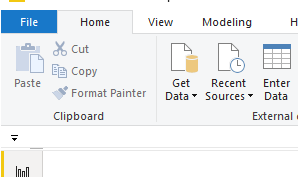
    The Quick Access Toolbar will now look like the following image:

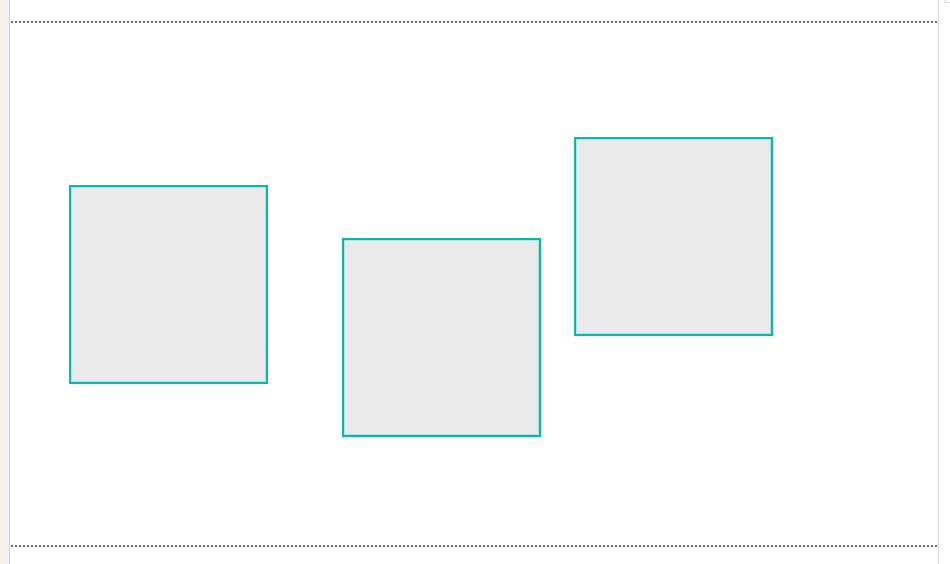
    In our next step we need a hidden toolbar to appear, the Format ribbon.  This Ribbon only appears when multiple elements are on the page.  Thus, we will need to add some generic shapes to the page to reveal the toolbar.

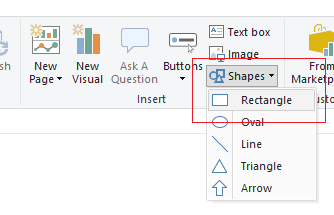
    Add three Shapes (Squares) to the report page.  Click on the Home ribbon and select the Shapes icon listed in the Insert section of the ribbon.  Then Select the item in the drop-down list labeled Rectangle.

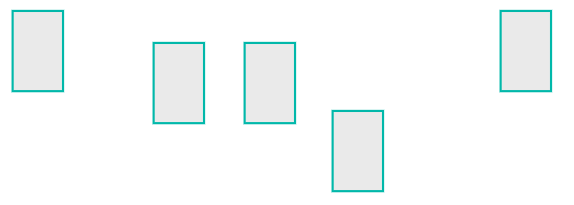
    After adding one rectangle select the rectangle with your cursor.  Use Ctrl + C to copy the shape.  Then, use Ctrl + V to past Two more rectangles on the page.  Use your cursor and move the shapes across the report page.  The order of the shapes does not matter, they just need to be distributed across the page. See below for reference.

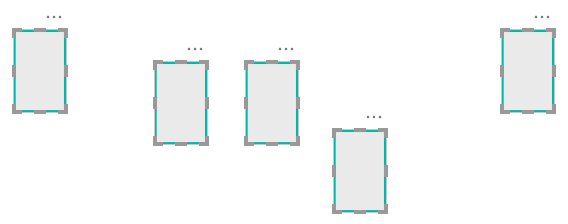
    Use Ctrl + A to select everything on the page.

    Notice a new ribbon appears, the Format ribbon.  This is called a context aware ribbon.  This has been a long standard best practice in office products.  Only show the ribbons that are needed.  Thus, the format ribbon and the Data / Drill ribbons are not exposed until you have visuals selected on the page.

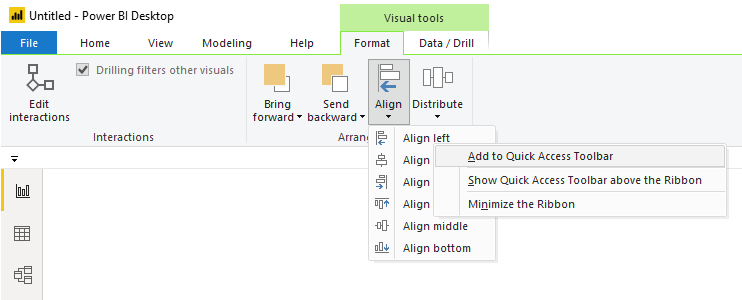
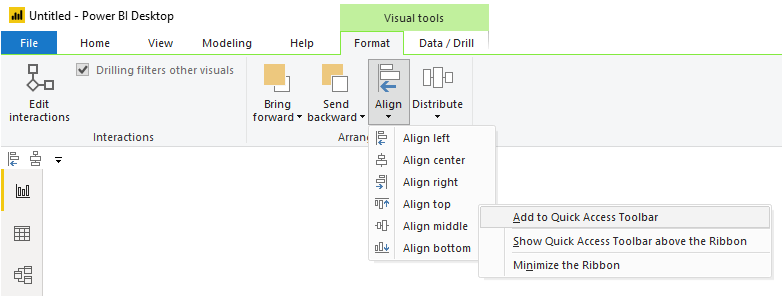
    Click on the Format ribbon.  Click the button called Align in the Arrange section of the Format ribbon.  Then Right click on the first item in the align menu called Align left.  Upon doing this, a menu will appear.  Select the first item in the list called Add to Quick Access Toolbar.

    Repeat the same process by adding the Distribute Vertically action from the Distribute button on the Format ribbon.

    Next, Add the Align top action from the Align button on the Format ribbon.

    Finally, Add the Distribute horizontally action from the Distribute button on the Format ribbon.

    Using the combination of Aligning an Edge / Distribution is just so much faster then moving one object at a time. 

    For example, here is a random arrangement of 5 shapes on a page.

    Using our newly created shortcuts I select the Items I want to move.

    Then using our new key combo, Alt + 3, Boom all the top edges are aligned.

    Then the magic, press Alt + 4 and all the items are evenly distributed

    Superfast and efficient, aka lazy..

    Side Note:

    When I am training new users in building Power BI reports, I like to point out the following, it is important to align your elements on the page.  This follows along with one of the Gestalt principles, symmetry.  Your eye can perceive slight differences in objects that are misaligned.  I can’t tell you the number of reports has something like the following:

    The change is subtle but your eye picks it up.  When these out of alignment objects are near another visual with a straight edge it is even more apparent.

    (Steps off the Soap Box) Ok, enough diversions.  Let’s finish with adding two more items that I use every time I build a report, Selection Pane, and Bookmarks Pane.  We can add these items to the menu as well. 

    Navigate to the View ribbon (or hit Alt + W if you want to be fancy).

    Right Click on the item called Selection Pane.  Select the item in the dropdown Add to Quick Access Toolbar.

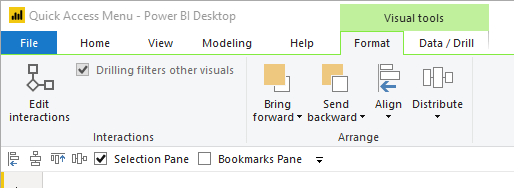
    Do the same for the Bookmarks Pane.  When you are finished your Quick Access Toolbar should look like the following:

    You may be asking yourself… So why did we move the menu to the bottom of the ribbon?  We could have just left it on the top of the screen.  You would be right.  But, I do want to point out one odd behavior when the Quick Access Toolbar is at the top of the ribbon. 

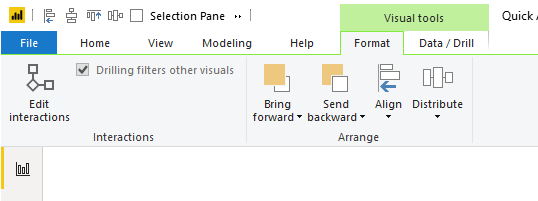
    When I have multiple visuals selected on the page the contextual menu appears.  See below image with the Quick Access Toolbar at the top:

    When this happens any items to the right might get chopped off, and you must access them using the double sideways arrow.  The Alt + # keys will still work even though the items are hidden, but I don’t like the experience of having some of my menu items hidden.  If you had many icons distributed across the Quick Access Toolbar, say 9 of them, you would have to remember its position in the alt keys.  This is the reason why I prefer to show the Quick Access Toolbar below the ribbon.  When the context aware menus appear the Quick Access Toolbar is not covered.

    Thanks for reading along.  Have a great day and I hope this tip / trick makes you a little bit more productive!

    If you like the content from PowerBI.Tips please follow us on all the social outlets. Stay up to date on all the latest features and free tutorials.  Subscribe to our YouTube Channel.  Or follow us on the social channels, Twitter and LinkedIn where we will post all the announcements for new tutorials and content.

    Introducing our PowerBI.tips SWAG store. Check out all the fun PowerBI.tips clothing and products:

    Check out the new Merch!

    Hasta La Vista Data
    Go Ahead Make My Data
    PBIX Hat


  • Custom Usage Metrics Reporting

    Custom Usage Metrics Reporting

    One of the really cool features contained within the PowerBI.com service is the ability to monitor how often your dashboard or report is being viewed.  You’ll find this feature by opening up either a Dashboard or a Report, then clicking the button called Usage Metrics.  Clicking this button will generate a custom usage report.  For more details on Report Usage Metrics see the following article from Microsoft.

    Note: In order to see the usage metrics report you must be able to edit the report and have a minimum of a Power BI Pro license.  Also, the usage metric report only captures the last 90 days of report usage.

    Usage Metrics on Menu Bar

    The sad thing is that this report is only the usage metrics for the Dashboard or Report that you opened.  This report is also read only and cannot be modified.  However, there is a way to fix this, and see all the usage on all the Dashboards or Reports within a workspace.

    Let us begin.

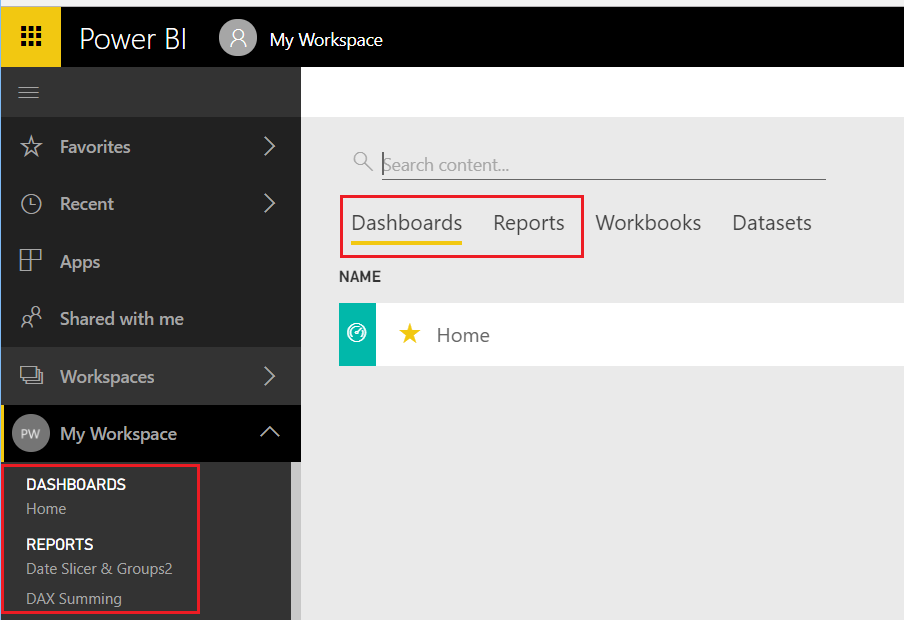
    You will first need to log into PowerBI.com, once you have logged in navigate to either a Dashboard or Report.  To open a dashboard or report start by opening a workspace in the left navigation bar.  If you are already in a workspace you can open a Report or Dashboard by clicking on the Dashboards or Reports headers in the main selection area of the workspace.

    Navigate to a Dashboard or Report
    Navigate to a Dashboard or Report

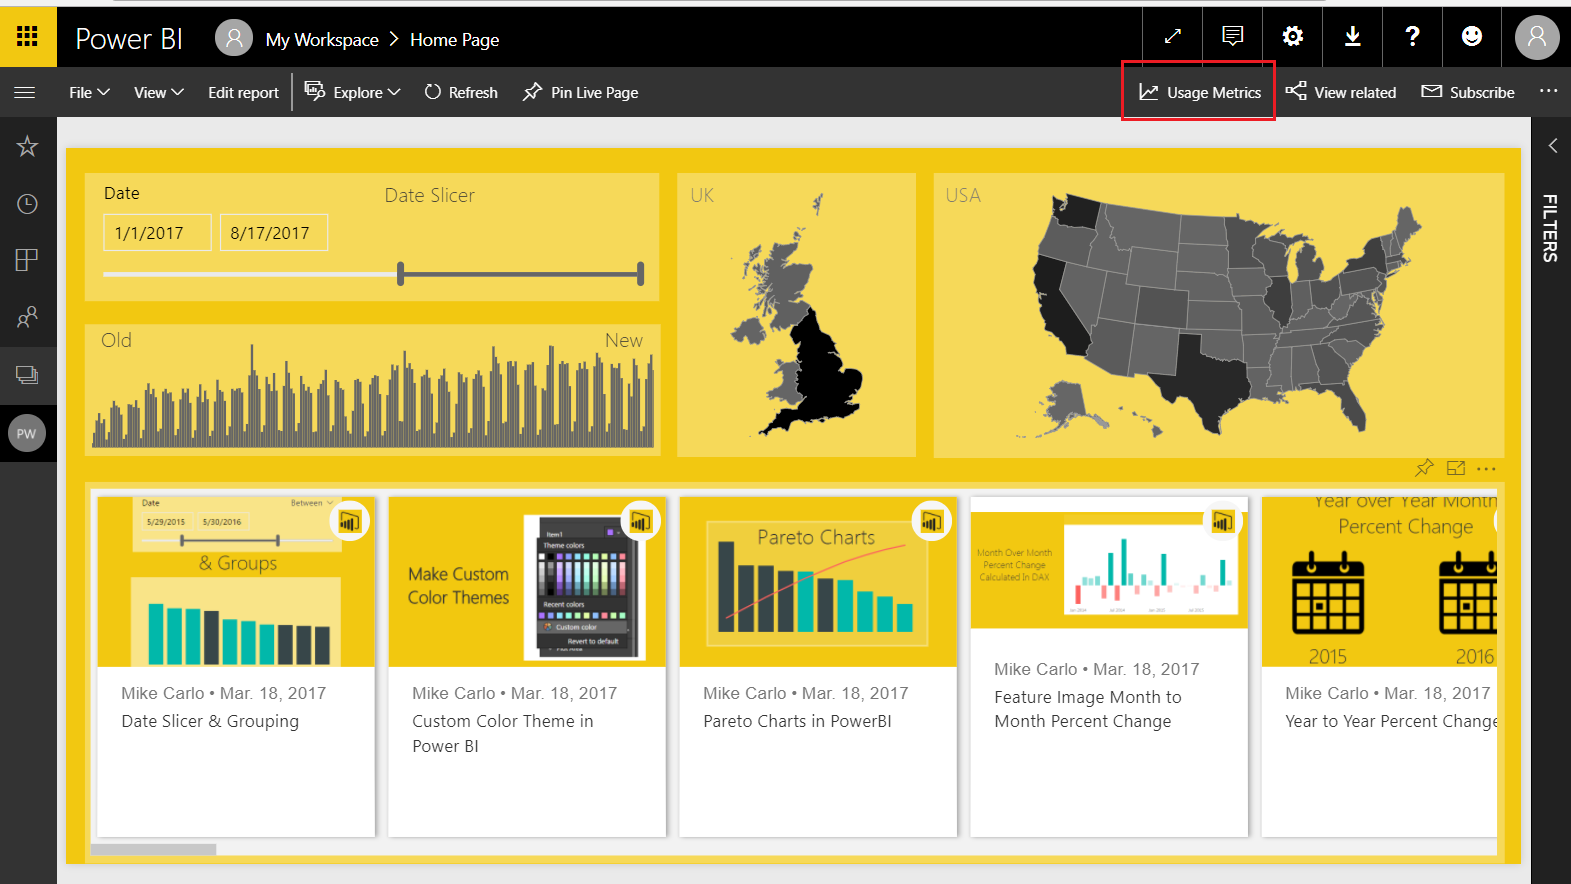
    For this tutorial I will use a report but the same steps will work for both the Dashboard and Report usage metric reports.  Open up the report that your interested in viewing the metrics.  I am using my report called Home for this example, this report is used on PowerBI.Tips, and you can view the report here if your interested.  Now that we have opened the report, click on the Usage Metrics link on the top navigation bar.  This will open up a usage metrics report.   This report is read only and does not allow changes.

    Link to Report Metrics
    Link to Report Metrics

    Here is where we get sneaky… If you observe the URL for the usage metrics report it looks like the following:

    https://app.powerbi.com/groups/me/reports/c6....26/ReportSection?filter=Reports~2FReportGuid%20eq%20%27....ca%27

    Notice the middle of the report where it states “?filter=Reports” this means the Usage Metrics report has been filtered for only one report in the workspace.  The report filter context is passing the Globally Unique Identifier (GUID) of the selected report down to the Report Metrics.  This is good news because knowing this we can modify the report and remove the filter, thus allowing visibility to all the reports in a workspace.

    First we will need to save a copy of the report so we can make changes.  With the Usage Metrics report open click File then in the drop down click Save As.

    Save Report As
    Save Report As

    This will save a copy of the report into the workspace.  Notice we now see in the Power BI header bar that the report has been named Report Usage Metrics Report – Copy.  Also we can now see an Edit report button.

    Usage Metrics Report - Copy
    Usage Metrics Report – Copy

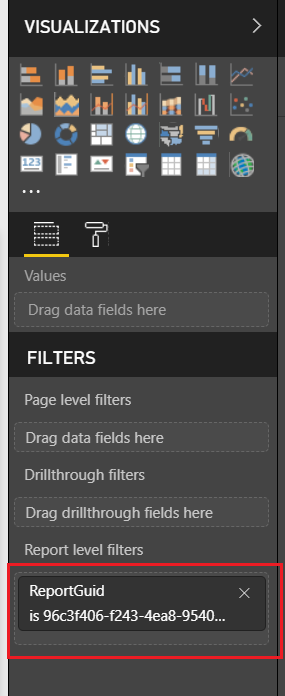
    Click on Edit report to start changing the report.  As soon as you open the report you can see in the visualizations pane that there is a Report filter applied.  Remove this filter by Clicking the little Grey X for the ReportGUID in the Report level filters section of the visualizations pane.

    Report Filters
    Report Filters

    After removing the report filters, we can see all the data from all reports.

    Let the modifications begin.

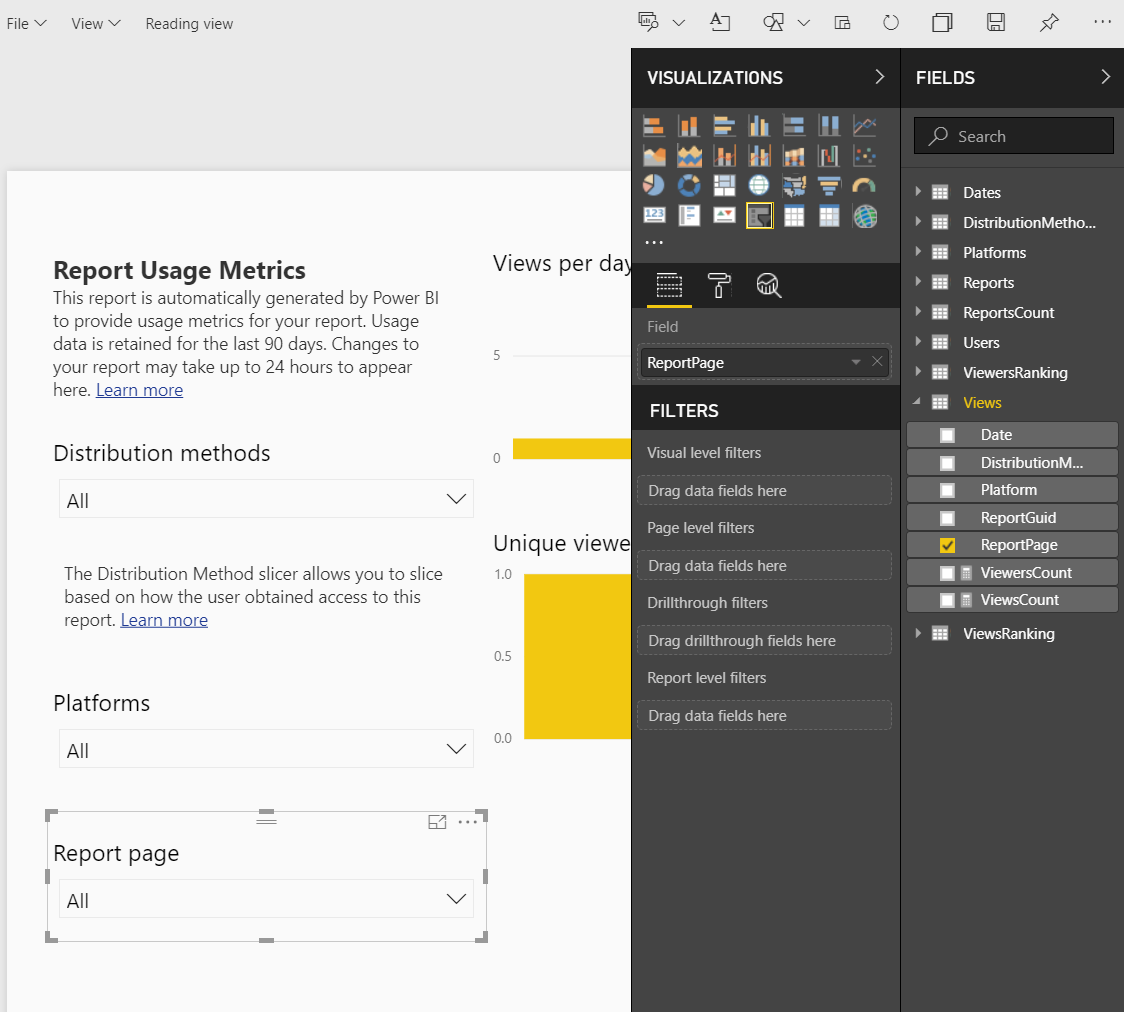
    On the left of the report we have a report page slicer.  This allows you to see the activity on one page of a report.  Now that we can see all the reports across the workspace filtering only pages of each report doesn’t make sense.  We need to add an additional slicer to select reports we are interested in.

    Report Page Slicer
    Report Page Slicer

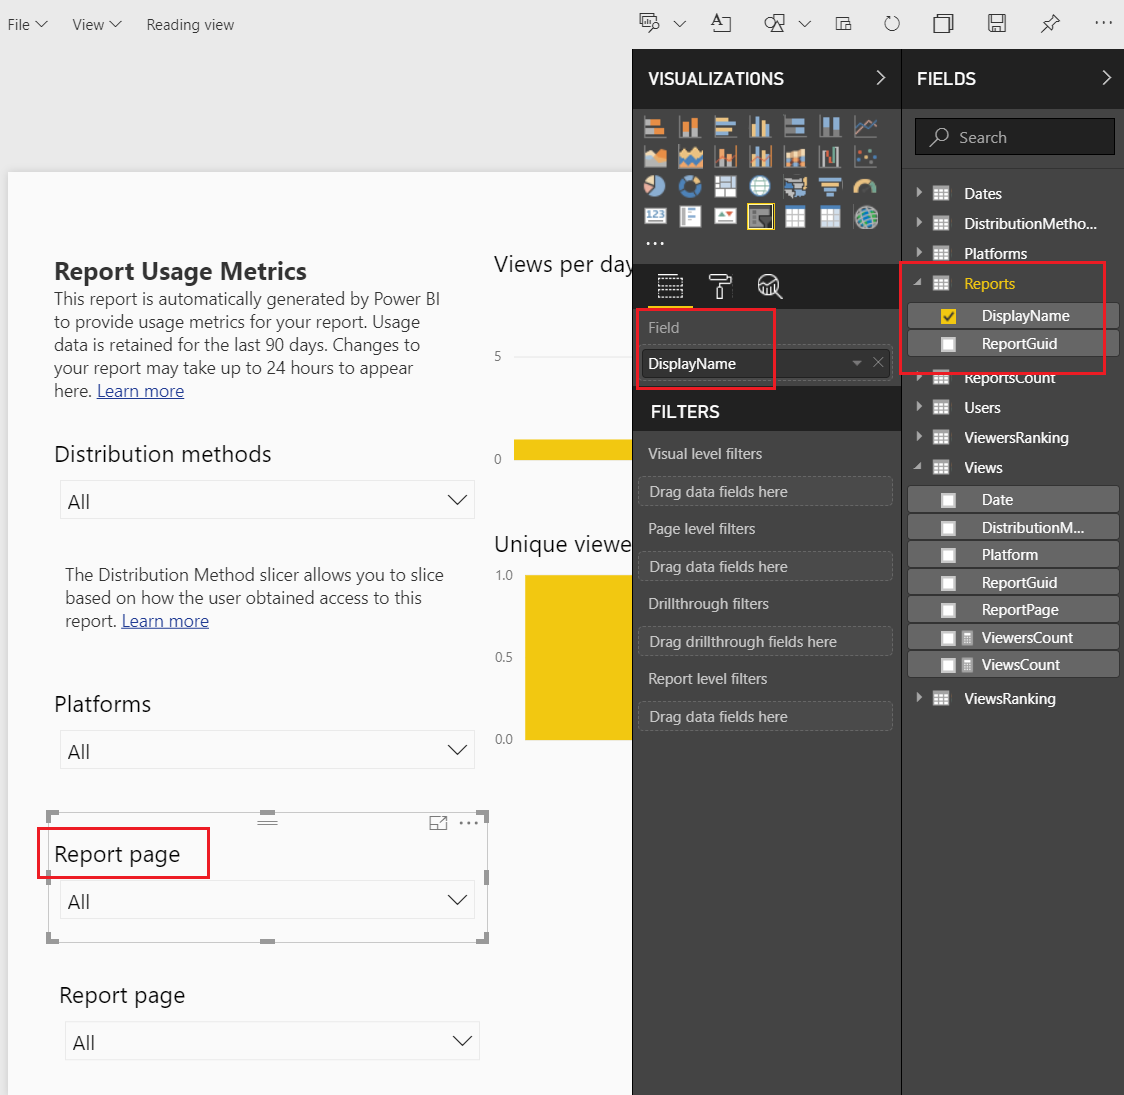
    Select the Report Page Slicer the using Ctrl C copy the slicer, then paste it using Ctrl V.  We should now have two slicers on the page.  Select the top slicer named Report page.  Change the field of the top slicer from ReportPage to DisplayName. The DisplayName is found under the Reports table in the Fields pane.

    Link Report Display Name
    Link Report Display Name

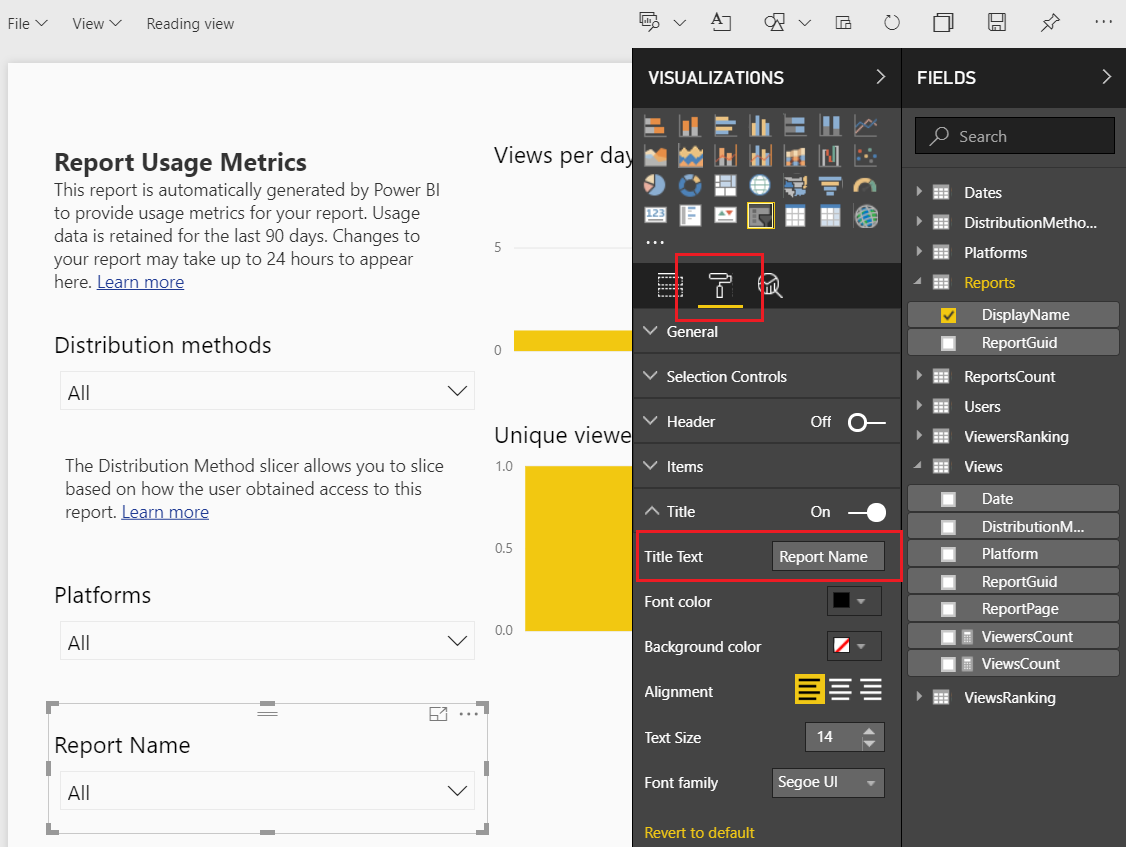
    Notice even though we changed the slicer information that the slicer title did not change.  We have to manually change the title description in the display settings.  Click the Paint Roller to open the display settings.  Expand the Title section and change the Title Text to Report Name.

    Change Slicer to Report Name
    Change Slicer to Report Name

    The title of the slicer visuals is now changed. Sweet!
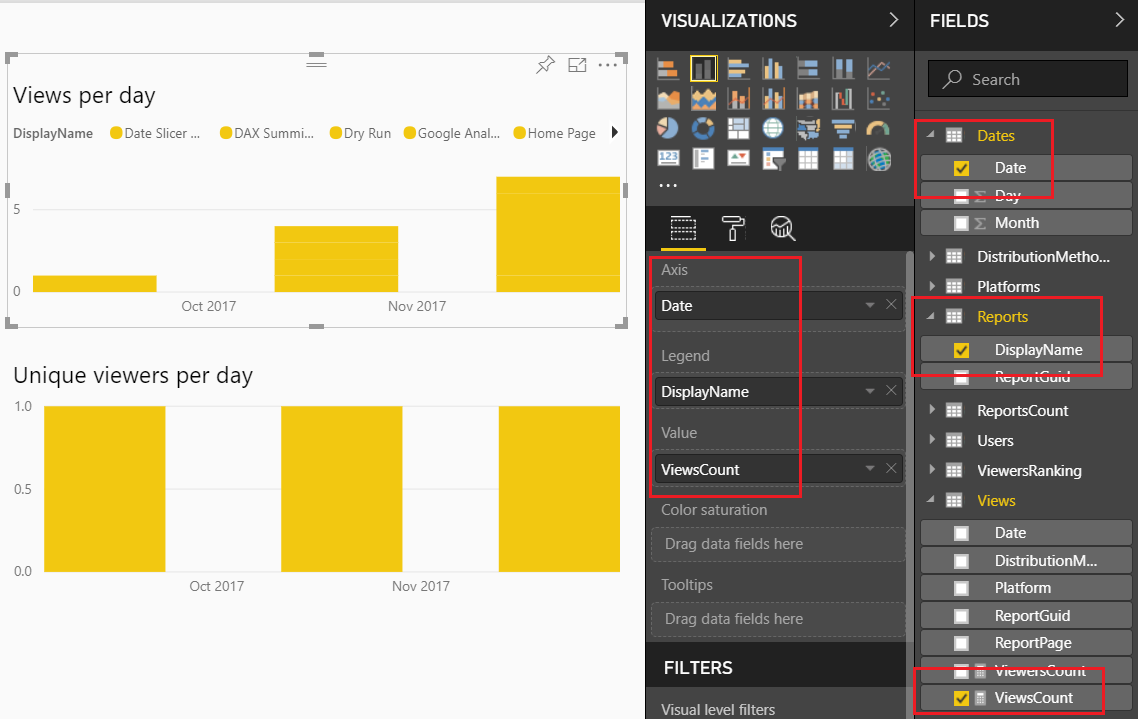
    Let’s move on to modify some of the standard visuals.  Select the report titled Views per day and change it to the following settings:

    Views Per Day Change
    Views Per Day Change

    Note: We changed the Axis Date column field.  We removed the date field from the views table and added the date from the Dates table. 

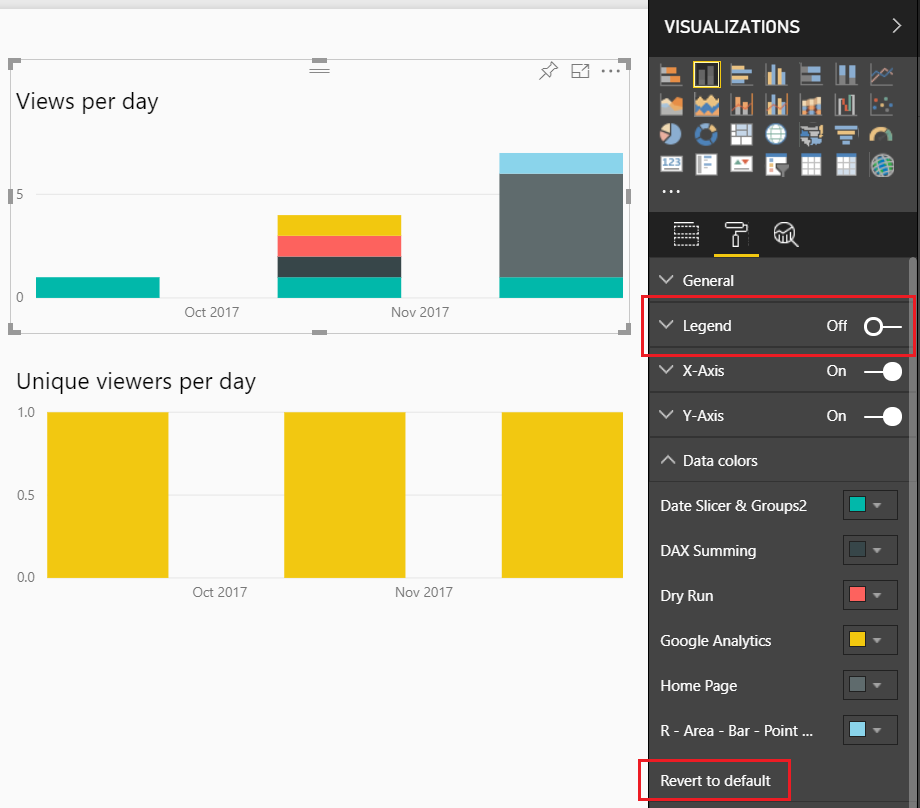
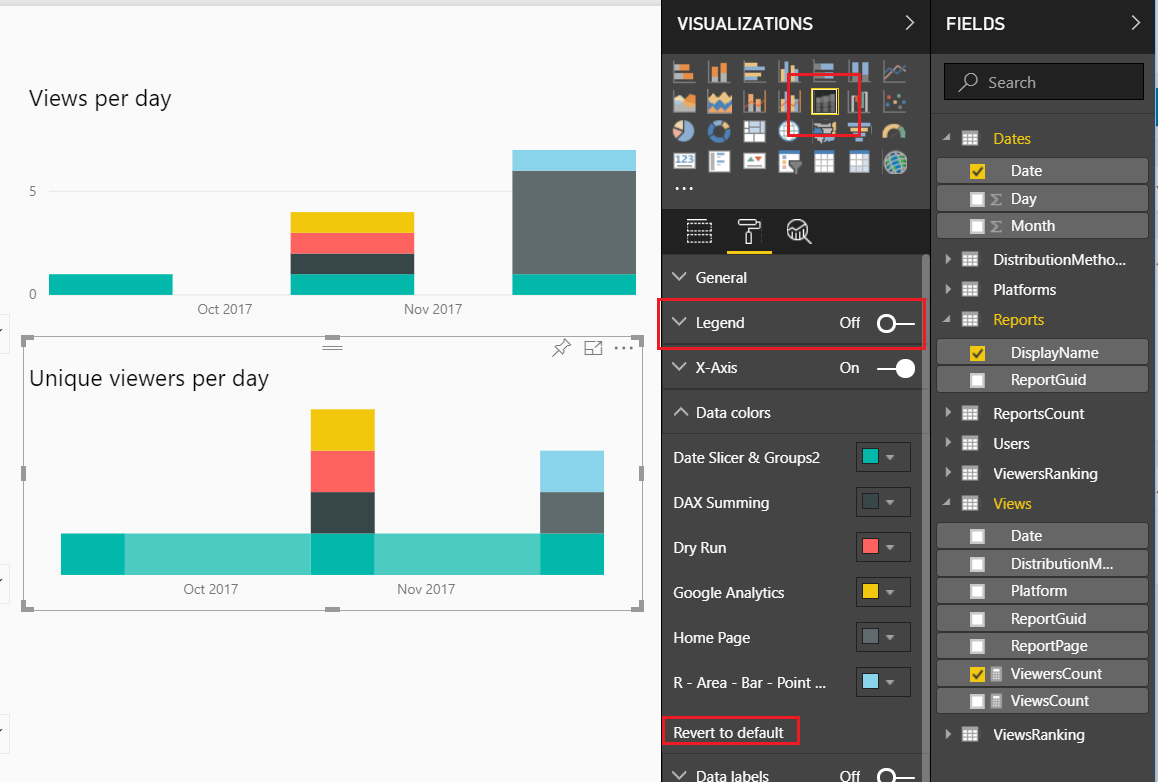
    This allows us to see over time the number of views per report.  Lets clean this up a bit.  Change the settings of this visual by Clicking on the Paint Roller ribbon.  Start by Turning Off the Legend, then open up the Data Colors, and Click the Revert to default to return the visual to it’s normal colors.

    Change Visual Settings
    Change Visual Settings

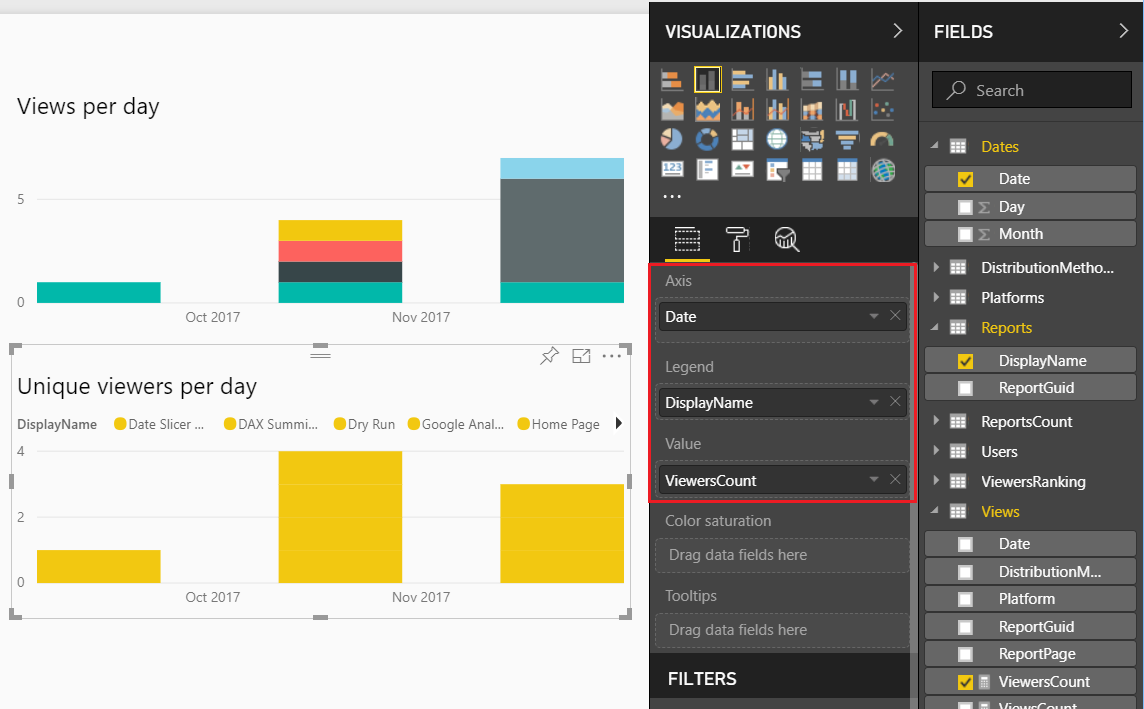
    Now, lets modify the Unique viewers per day.

    Change Unique Viewers per Day
    Change Unique Viewers per Day

    Again, the formatting of this visual isn’t great so let’s modify it.  Click on the Paint Roller again and Turning Off the Legend, then open up the Data ColorsClick the Revert to default to return the visual to it’s normal colors.  Finally, change the visual type from Stacked Column Chart to the Ribbon Chart.  Your visual should look like the following:

    Change Visual
    Change Visual

    This visual will show you which report has largest viewing audience.

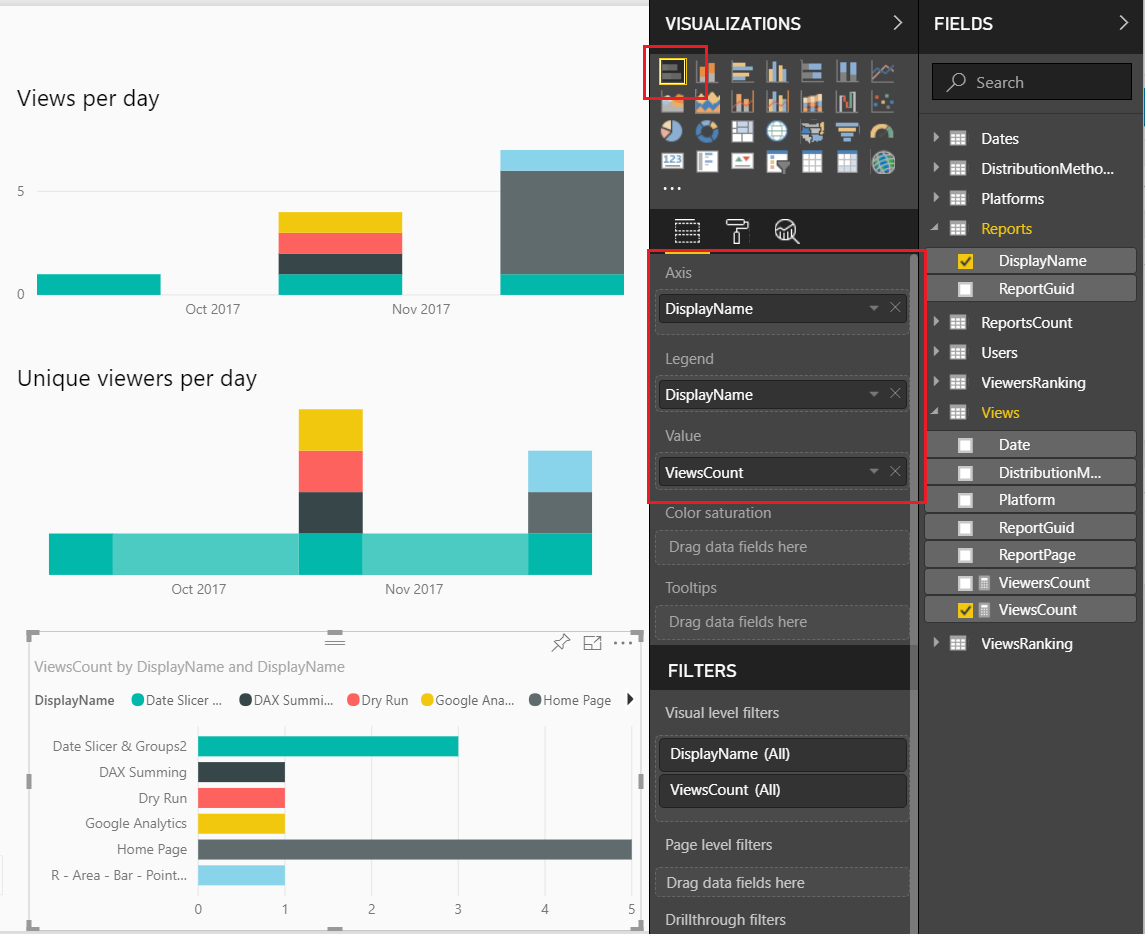
    You might have noticed that in both of these visuals I’ve been removing the legends.  Which means, you don’t know which report is represented by each color.  We will fix that by adding a final visual.  Add the Bar Chart visual from the visualization pane.  Add the following field names to the visual, as shown below:

    Add Bar Chart
    Add Bar Chart

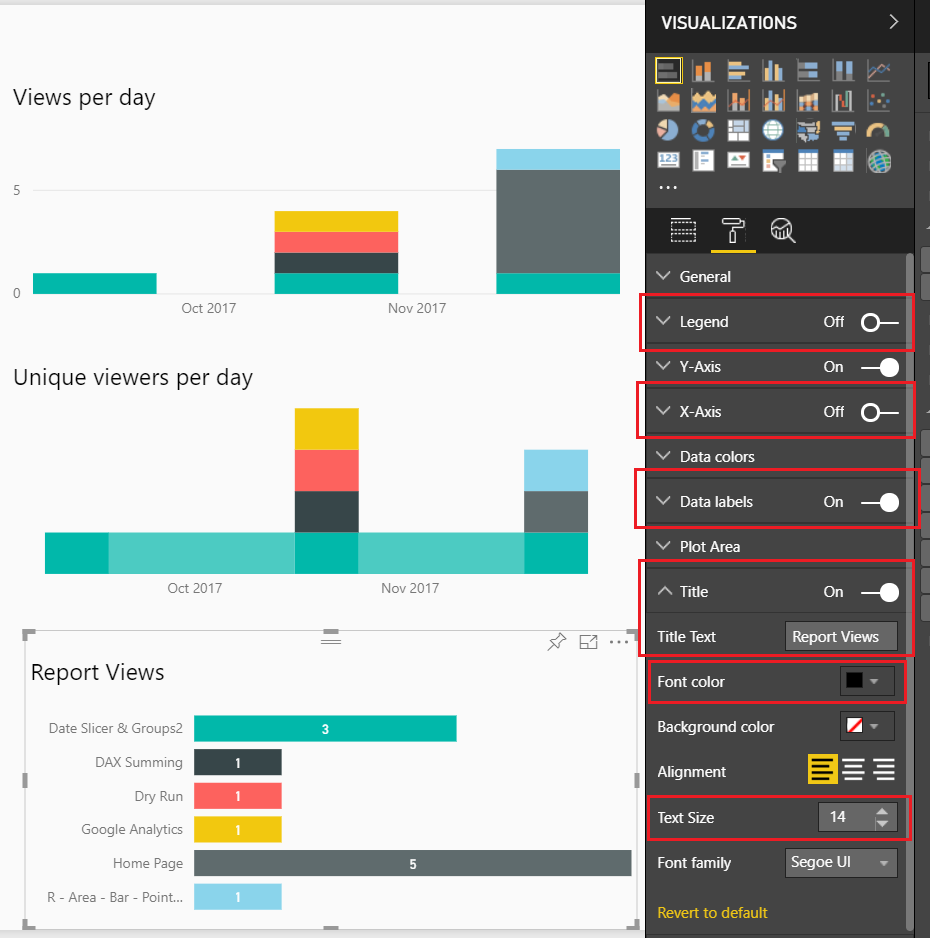
    Next, we will format the visual to clean it up.  Make the following changes, Toggle the Legend to OffToggle the X-Axis to Off, Toggle the Data labels to OnToggle the Title to On and change the Title Text to Report Views, finally change the Font color to Black and Text Size to 14.

    Formatting the Bar Chart
    Formatting the Bar Chart

    We want to sort the reports not by name but by how often they are viewed.  To do this, Click on the ellipsis and from the drop down Select sort by ViewsCount.

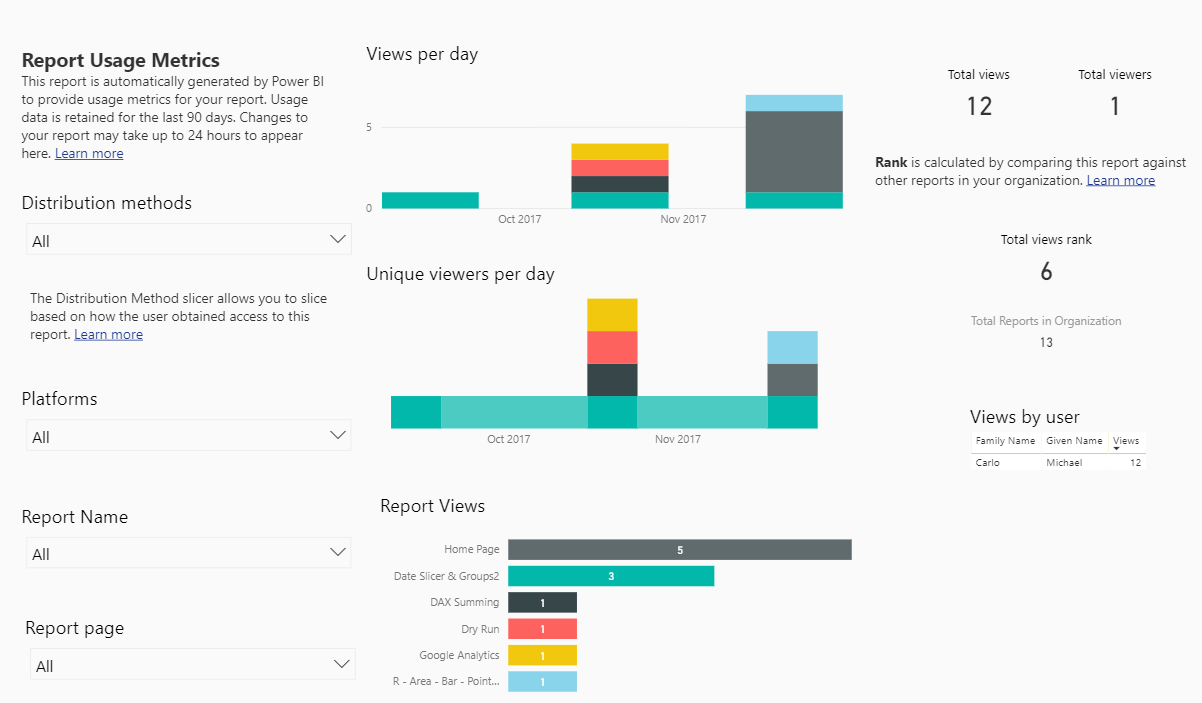
    Now we have a custom Usage Metrics Report.

    Final Report
    Final Report

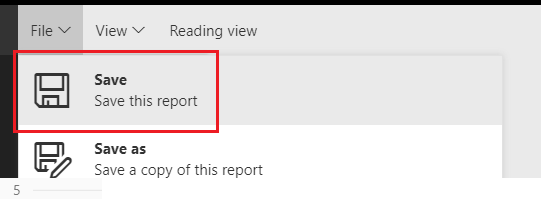
    Be sure to save the file.  Click on File then in the drop down Click the Save button.

    Save Changed Report
    Save Changed Report

    You will notice that our modified Usage Metrics Report will be saved in the Workspace.

    Thanks for following along.  If you found this tutorial helpful please share it with someone who will find this valuable.