Tag: Power BI Admin

  • Standardizing KPI’s around a Business Intelligence Team

    Standardizing KPI’s around a Business Intelligence Team

    This article follows from Episode 5 of the new Explicit Measures Podcast, a whole new way to talk about Power BI. If this article strikes you as relevant, subscribe to the podcast on Spotify, Apple, or wherever you listen. You can also watch live at 7:30am CST every Tuesday and Thursday morning on YouTube.

    On the latest Explicit Measures Podcast (Episode 5), the team dived into what should a BI Team focus on for their own KPI’s. One theme was consistent across each host however: Any KPI for a BI Team starts with the question: how do you evaluate and define success? This idea of success and the value for a Power BI pro can fall into many different opinions, depending on the size, team, and current culture at an organization. We wanted to share an initial template of KPI’s that any BI Team or Pro should start using and integrating in their own workflow.

    Evaluating Success for Power BI

    How can you properly gauge whether reports and data is satisfying the role in a company? At least from the opinion of the Explicit Measures Podcast, the basis starts with the ability to provide value, trust, and insights to an organization through their data. Starting with this as the end-goal, a BI Team can and must strategize on translating success into measurable targets. Let’s break this out into three distinct elements of success, with examples of KPIs for a BI Team.

    Elements of Success

    Adoption

    Adoption has become a buzz word in our industry over the past few years, and with good reason. One could make the argument that the ability to drive adoption should take higher precedent than some of the reports themselves. For reference, we are defining adoption as the maturity, growth, and reliance an organization has on their data via Power BI.

    Value / Time

    While most BI professionals do not directly create revenue, there is no question that there is a cost. With an ever increasing workload and requests for our time, the ability to validate and choose to work on impactful and value-added reports is essential. If a pro is working on one report, there are five others that are being ignored. Further, are the reports that are being developed and deployed providing the expected insights and information to an organization?

    Data Quality

    Anyone who has worked in Business Intelligence can tell you – once teams lose trust in the data, it is an awfully long and difficult road to gain it back. If users cannot trust the data in Power BI reports, that both reverts adoption and users will find other means to get their data. BI teams must be able to monitor how up-to-date published reports are, and ensure that the content that is available is current and accurate.

    Examples of Success KPI’s

    The following are examples of what a Power BI team or Pro can use to evaluate their own success based the pillars of Adoption, Value, and Quality. This is by no means an exhaustive list – this is an amazing community that consistently contributes new and innovate ideas – however there is no current standard for a BI Team success KPIs.
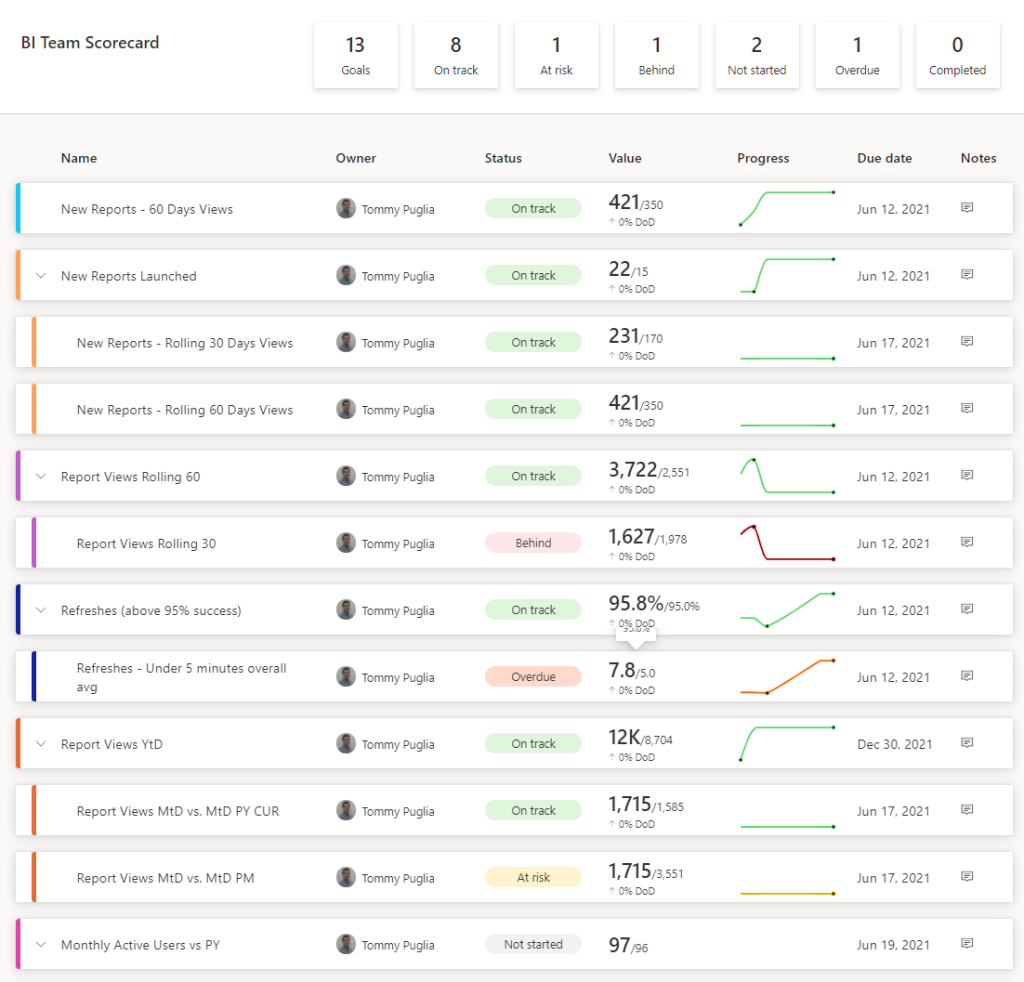
    An Example BI Team Scorecard using the new Goals in Power BI

    Adoption – KPI’s

    Rolling 14 Days / 30 Days Report Views

    Just with a basic department metric, simply looking at the aggregate does not create a KPI. While Report Views are important, giving context to the current performance transforms how you view this. This KPI not only shows you your top reports on a 2 week and month period, but also compare with the previous 14 / 30 day period.

    Viewing Report Usage on a 30 Day Rolling Basis

    Active Users (Weekly, Monthly)

    The relationship between the number of Report Views and Users may not be as straightforward as you think. Keeping watch of engaged consumers should occur on a weekly and monthly timeframe. For this, you can simply use a filter on a minimum of X reports viewed per week or month. Depending on your data, you can gauge the current state.

    User Distribution by Report

    Do not be fooled by high usage numbers in your reports alone! By this, make sure you can identify power users who are hoarding the majority of views for a given report. For example, a great technique to understand this is using the Pareto Principle, or the 80/20 rule in your report views. For example, for your top report, try to track the 20% users, and how much of total views they make up for an entire user base.

    SAT Scores, Feedback

    The majority of the KPIs in this article focus on quantitative metrics. However, there should attention to create subjective feedback in Power BI. For example, creating a Power BI Feedback Survey can create high value. In regard to when to send out a Survey, the following scenarios are suggested:

    • 45 Days after New Reports Launched (per-Report Feedback)
    • Quarterly Feedback Surveys (Overall experience using Power BI)

    Collecting this data via Power Automate and integrating into Power BI becomes a powerful tool.

    Using Customer Voice to Send out Report Feedback Surveys using Variables for Report Name

    Value / Time – KPI’s

    New Reports Launched

    Like Supply Chain Management, ensure you can track newly published reports. Bear in mind, this is not a growth target. There should be some range depending on the size of the BI Team that should aimed for. For example, a consistent small number may show a backlog. However, to high of a number may be saturating the overall experience for users.

    New Report Usage

    In parallel with tracking newly published reports, keep an eye on the immediate interest from consumers for these new reports. Like with the New Reports Launched KPI, depending on your team and size, decide on a sweet spot regarding range of views you expect. Likewise, have a filter on this based on the date the report was launched, looking at 30 to 45 days forward. The only usage metrics that should be included are ones based on the date the report was published.

    Report Lifespan

    This is a favorite. Too many times has a BI Author worked on what was deemed an urgent report, imperative to the business. These types of projects involve stress, pressure, and most importantly time taken to get right. Despite this, some of these reports seem to lose their luster once completed, not to be heard from again.

    In short, the ability to understand the durability and longevity of reports is essential. This can be taken both from viewing at an individual report level or an aggregate of newly launched reports. Are the reports being built showing value to consumers, not just once, but giving them a reason to return to the report on a consistent basis?

    Data Quality – KPI’s

    Report Refresh Rate

    An obvious choice when referring to Data Quality, if your reports are consistently failing that causes multiple problems. For one, consumers are not receiving the most current data. Secondly, this should trigger within the BI Team an alert that a data model may need to be reviewed for best practice standards.

    What is the target rate? While there is no current industry standard, targeting anything near the 95% rate should not be over achievable.

    An Example of Report Refresh KPIs

    Days Since Report Views

    From a bird’s eye view of all the reports in an organization, flagging unused report becomes an actionable KPI. In addition, mapping this to also track duration on a per-user basis provides a wholistic scorecard to future decisions. Firstly, Reports with consistent low Days Since Views should be treated with extra care if any updates are needed. On the other hand, Reports that have not been viewed in over 2 weeks may indicate loss of interest. Depending on the report, a BI Team can decide either to re-promote a report or assess if a report is not providing the value it should.

    From the User perspective, tracking Days Since Views by User can provide value in multiple ways. For instance, Users who are “top customers” (i.e. those who overall and per-report have low Days Since Views) tell Authors who to reach out to or who knows what can enhance reports in the future. By contrast, Users with high Days Since Views provide the ability for push-back for requests for new builds. For example, any colleague that may be requesting the most report builds but do not return to their reports give support to Project Managers that this may not be worth the value.

    Flagging a Report with 40 Days since being viewed by User

    Reports Retired

    As we discussed monitoring how many Reports have been launched, what about Reports on their way out? That is to say, how many reports have been removed from the service and from the “public” view. The importance of keeping track of this KPI is all about quality for the consumer experience.

    Ensuring that any data published for an organization is current, has a clear objective, and provides clarity is paramount. Above all, this grows the trust and reliance on using Power BI for users. From a discovery standpoint, there is no confusion on reliable data.

    Taking the previous KPI (Days Since Views) into account, a BI Team can create a view to monitor “at-risk” reports. For example, any Report with over 45 Days Since Views should be strongly considered to be retired. Any report that meets the threshold should alert users on a pending retirement date. If there are no objections, then these reports should be moved to an Archived workspace.

    Getting the Data from Power BI

    This may be obvious, but a prerequisite of creating and using KPI’s is having the data. So where is this data coming from? If you are a Power BI Administrator in your tenant, you can import the data via PowerShell. Install the Power BI Module in PowerShell using the following command:

    Install-Module -Name MicrosoftPowerBIMgmt

    Once you installed the cmdlet, you can use the following script to pull in usage day (by day) into a specified folder on your PC.

    Login-PowerBI
    ## $a is the starting Day. Start with the you want it run and subtract 1
    $a = 17
    Do {
        "Starting Run $a"
        $a
        $a++
        $ab = "{0:00}" -f $a
        "Running Day $a"
        $daytype = "$ab"
        ## Update monthly the 05 for start date for the current month
        $startdate = '2021-05-' + $daytype + 'T00:00:00'
        ## Update monthly the 05 for end date for the current month
        $enddate = '2021-05-' + $daytype + 'T23:59:59'
        $activities = Get-PowerBIActivityEvent -StartDateTime $startdate -EndDateTime $enddate | ConvertFrom-Json
        ## Update the 05 with the current month
        $FileName = '2021' + '05' + $daytype + 'Export.csv'
        ## Add where you want the files to go
        $FolderLocation = 'C:\Users\PBIActivity\'
        $FullPath = Join-Path $FolderLocation $FileName
        $activities | Export-Csv -Path $FullPath -NoTypeInformation
        ## Change the number for what day of the month you want it to run until
    } Until ($a -gt 19)

    The script above collects activity data from your tenant and creates a CSV file per day. Note that this can only go back 30 days – make sure you run this on a weekly basis and change the variables. To learn more about what else you can do with the PowerShell cmdlets for Power BI, read the announcement from the Power Blog here.

    To collect refresh statistics, Marc Lelijveld (Data-Marc) has a great tutorial here.

    Conclusion

    The KPIs outlined should serve as a starting point to monitor performance. Power BI Pros without insight into their own performance are stunting their own growth. Not only are metrics for Pros essential for an organization, but it alters the way new reports are built in the future.

    Like the content here? Then you will love the Explicit Measures Podcast!  Subscribe to the Podcast on Spotify, Apple or multiple platforms on Anchor. Want to join us live? We stream every episode on YouTube Tuesdays and Thursdays at 7:30 am CST. You can also subscribe to new events on the PowerBI.tips LinkedIn Page

    If you like the content from PowerBI.Tips please follow us on all the social outlets. Stay up to date on all the latest features and free tutorials.  Subscribe to our YouTube Channel.  Or follow us on the social channels, Twitter and LinkedIn where we will post all the announcements for new tutorials and content.

    Introducing our PowerBI.tips SWAG store. Check out all the fun PowerBI.tips clothing and products:

    Check out the new Merch!

    Hasta La Vista Data
    Go Ahead Make My Data
    PBIX Hat


  • Building a Power BI Admin View using Power BI APIs

    Building a Power BI Admin View using Power BI APIs

    We just completed an amazing webinar from Parker Stevens over at https://bielite.com/ . In this webinar, Parker walks us through how to connect to the Power BI Admin APIs. The Admin API contains a wealth of knowledge for all activity within your Power BI tenant.

    While there is a good amount of reporting built into the Power BI admin page, you may need more. This is why you would use the Admin APIs to gather all the activity data from within your Power BI. For more information, learn about the Power BI Admin Portal.

    Parker takes us through a deep dive connecting to the Power BI admin apis and shows us how to build a robust dataset ready for Admins to produce the reporting they need.

    Watch the Full Webinar

    If you like the content from PowerBI.Tips please follow us on all the social outlets. Stay up to date on all the latest features and free tutorials.  Subscribe to our YouTube Channel.  Or follow us on the social channels, Twitter and LinkedIn where we will post all the announcements for new tutorials and content.

    Introducing our PowerBI.tips SWAG store. Check out all the fun PowerBI.tips clothing and products:

    Check out the new Merch!

    Hasta La Vista Data
    Go Ahead Make My Data
    PBIX Hat


  • Power BI is part of the greater data solution

    Power BI is part of the greater data solution

    Power BI is a powerful reporting tool that has been dominating the market and rapidly evolving. Yet, in many organizations people seem unaware of its true potential or core purpose. As a result, too often it is deployed to simply extract or visualize data points in an ad hoc reporting manner.

    Power BI is greater than a report

    Power BI should not be thought of as a separate product to ETL, AI/ML or overall data strategy. Rather, organizations need to include it as part of a data culture with all of the products working in union.

    To deploy Power BI successfully, do not use it to simply design reports. Instead, design a culture and architecture. This is one that allows business users to understand, interpret and react to rich and powerful data driven insights.

    The many additional products, services and capabilities that come packaged in Power BI are too frequently overlooked. As a result, people see only the top level – visuals in reports and dashboards. But there is a whole host of rich and exciting features below the surface.

    With that, here are some common mistakes I have frequently seen new users make when rolling out Power BI.

    Mistakes made to under utilize Power BI

    • Using it for Data extraction
      Large tables with a selection of filters that you may or may not look to export. Instead, Power BI is designed for trends, insights and cross slice and dice. Large tables and data dumps do not give insight.
    • Using it for a data visualization to tell a single point
      Design a visual that can convey information quickly, rather than an infographic type solution. If you are looking for that pixel perfect data visualization for a news story that tells a specific point, there may be other options. Paginated reports or predesigned Excel documents are viable options. Design data pipelines that are regularly updated. Create visuals that are designed to be interactive. This will help users drill down and find insights.
    • Ad hoc only reporting
      While this can be a great tool for ad hoc reports, you may be underutilizing and doing extra work. Instead, build reusable data models that are designed for multiple reports. Write DAX business logic and KPI that can serve as a single source of truth. Be sure to document your measures inside the data models. By clearly documenting measures data consumers will understand how to use the data model to build new reports.
    • Current reporting tool / Excel replacement
      A common request is to “lift and shift” all excel reporting into Power BI. These products are different and have different uses. If you are moving to Power BI, don’t try and recreate old solutions. Instead, a better approach is to design new reports that play to Power BI’s strengths. Utilize the rich features and powerful engines that make Power BI beneficial. This is a story of it’s better together. Using just Power BI or just Excel has it’s advantages and dis-advantages. Conversely, using both Power BI and Excel can play to each tool’s strength.
    • Not building a data culture
      Matthew Roche has an amazing blog series on building a data culture with why and how to do this. Building a good data culture is vital for adoption within the organization. The data culture will start with an Executive sponsor who can push for adoption. So, first and foremost, be sure to have a leader who believes in your vision.

    Mistakes made when deploying Power BI solutions

    • Focusing on raw numbers, not business insights
      Instead of simply displaying numbers, great reports often have the following KPI, trends, drill down, interactivity and slicing capabilities. This allows business users to gain meaning information about the direction for the business.
    • Ignoring the deployment approaches
      Many business users are familiar with a typical process for reports; a user submits a ticket to IT. IT writes a bunch of SQL queries to get the data for this request. They then surface the data in tables and simple graphs. In contrast, Power BI does a great job at breaking down this long turnaround and getting the data in users hands quick. An organization should deploy a top-down, blended or bottom-up approach. As a result of utilizing this approach, they can merge the business and IT side of operations and remove silos.
    • Failing to Think like the Business and Act Like I.T.
      The I.T. organization has many strengths related to how to make data available quick and reliably. Power BI is mainly designed for business users. Thus, Power BI has features that borrow from best practices from I.T. One such best practice is the use of Deployment Pipelines.
    • Not utilizing Data Models or ignoring self-service reporting
      Data models, as described in this blog by Matt Allington, contain all the metadata needed for reporting. This includes the business logic and data transformations. However, creating and maintaining these can be time consuming. Instead, it is possible to reuse data models and keep one source of the truth for many reports. The modeling experts can own and maintain the models. Furthermore, business users can connect and build their own Power BI reports utilizing the models. This is done without even needing to write a single line of code.
    • Treating Power BI as a stand alone product, not part of the greater data or AI solution
      You should not treat Power BI should as just a visualization tool (read this blog by Gil Raviv). Instead, Power BI is a business insights tool, a way to serve and communicate the information within the organization. In addition ML and predictive analytics are baked into it, as are ETL processes, data storage and security. As a result a unified approach to a data culture should be built. Users from all business areas need to be aware of the strategy.

    Using Power BI the right way

    Power BI should be unified and part of the entire data stage – not a visualization layer on top of it. A modern data platform typically has 4 steps:

    • Load and Ingest – extract the data out of the source system and transform it.
    • Store – Land this data somewhere so we can run analysis on it.
    • Process (or transform) – Run analytics on your data and draw out KPIs, AI and predictions.
    • Serve – present this data in an easily way for stakeholders to consume it.

    Power BI can be all of these steps. From a single report using power query (Load and Ingest) to import data (Store). Next, you can build a model and DAX measures (Process). Lastly, you can surface the data in visuals on the report pages (Serve).

    This can be a more enterprise level solution and scale well too. Firstly, Dataflows are set to extract and transform data from many sources (Load and Ingest). You can back-up and store in a data lake gen 2 storage (Store). Secondly, the data can take advantage of automated ML (AutoML) and cognitive services. Build DAX expression over them, combining a powerful DAX language with the power of AI (Process). Last, you can package these as reports, dashboards, apps or embedded into other applications (Serve).

    Alternatively, Power BI doesn’t have to be all these steps. A traditional data platform architecture is described by Microsoft in the picture below. You can utilize other tools such as Data Factory to Load and Ingest data. Next, you can use Databricks to Process/Transform the data. Power BI and Analysis services models will serve the data to the end user.
    This is a great example of Power BI fitting into a greater data solution. However, you should implement the deployment with the entire solution in mind. Power BI is not as a tool for simply creating visuals. A good deployment is deeply rooted in the culture. Each step must consider the others in the pipeline, not sit in silos.

    Source: Microsoft

    Bonus: See this great diagram by Melissa Coates, showing Power BI end to end features.

    Azure Synapse

    Microsoft is expanding this ecosystem with Azure Synapse. As they roll it out, they are designing data engineering as a single platform. This combines this entire pipeline and tools into a unified experience. Power BI being a part of this platform.

    Source: Microsoft

    Synapse provides Consistent Security

    When we think about user level security, Azure Active Directory (AAD) is the gold standard for access and security for organizations. Synapse leverages this technology to remove friction between different azure components. You can leverage AAD across the multiple services for data factory, Data Lakes, SQL and Spark compute as well as Power BI.
    The experience of governing data on a user by user basis improves with the Synapse experience.

    A Low Code Data Engineering Solution

    There are many Azure components you can use to produce a well engineered data pipeline. Azure Synapse brings all these tools under the same portal experience. For example, using Azure Data Factory, then writing data into a data lake. Picking up the data and querying flat files with compute engines such as SQL or Spark. Azure Data Factory also has built in features that can simplify data lake creation and management using mapping dataflows.

    More Computing Options

    No longer do We have to choose just SQL or Spark, rather We have options. We can use Provisioned SQL which was previously Azure Data Warehouse. Synapse now offers on-demand SQL, and Spark compute engines. This is where we are really seeing the technology move to where we have separated the storage layer from the compute layer. This means Azure Data Lake Gen2 serves as storage, and SQL and Spark serve as compute.

    One Place for all information

    Whether it is Azure Data Factory, Spark, SQL or Power BI. Synapse has now become the single portal for integrating all these services. This in general simplifies the experience and management of all your data pipelines.

    If you like the content from PowerBI.Tips please follow us on all the social outlets to stay up to date on all the latest features and free tutorials.  Subscribe to our YouTube Channel.  Or follow us on the social channels, Twitter and LinkedIn where we will post all the announcements for new tutorials and content.

    Introducing our PowerBI.tips SWAG store. Check out all the fun PowerBI.tips clothing and products:
    Store Merchandise

  • Power BI Refresh Overview

    Power BI Refresh Overview

    There are different ways you can connect to a multitude of different data sources. I’ve written about the different connection types before and you can find those articles here if you are unfamiliar with what I’m talking about.

    When you import data and publish a Power BI report to the Power BI Service you need to schedule a dataset refresh in order for the report data to be updated. This can be done manually by refreshing the PBIX and re-publishing the file, but for any production report that you want to set a schedule for, you need to ensure that you set up things to automatically update without further intervention.

    The first thing you need to check is whether or not you need a gateway. For any data source that is located within your company servers, on a local machine, or within certain types of cloud infrastructures are considered “on-premises”. When a data source is on-premises you require a gateway in order to refresh the data. If your data is in a cloud source such as OneDrive or SharePoint Online, then you will not need a gateway to refresh.

    Once you determine whether or not you require a gateway, you need to understand that there are two different types. The first is called a personal gateway, this gateway will allow you to use the majority of Power BI data sources with no configuration. After you install this gateway and publish your report using a data source that is supported by that gateway you can set up a dataset refresh in the Power BI Service without any additional setup. The second type of gateway used to be called the “Enterprise Gateway”, but now it is just the gateway that is not (personal mode).

    Install a gateway from here: https://powerbi.microsoft.com/en-us/gateway/

    gateway installer

    This gateway is designed for use in your enterprise wide reports. It has a lot more data sources that it supports for refresh (That list can be found here) It also requires some additional setup, configuration and management from an Administrator. Let’s walk through how you set one of these up so that you understand how to do it, or how you can request to have it done for your organization. It is highly recommended that you install the “Enterprise Gateway” on a server that will never shut down or be on a scheduled maintenance cycle. You can download this gateway to your local computer, but if the computer is off, so is your gateway, and the reports will not refresh.

    Installing the gateway:

    Installation is very similar to the personal gateway, except you have options to add the gateway to a cluster or incorporate a recovery key. ALWAYS set a recovery key and SAVE IT! This key will allow you to move the gateway at a later date if you need to without impacting any of your reports. This key is GOLD, treat it like it and you will save yourself a bunch of headaches in the future. Outside of that, the install of the gateway should be really straightforward, if you do run into issues there is a comprehensive guide to troubleshooting the problems that you can find here. I recommend using an administrative account to set up the gateway because the ownership of the gateway in the Service will begin with this user. If you have one account that manages all the Enterprise Gateways, then you’ll save yourself a ton of pain down the road from an administration standpoint in discover-ability. If you aren’t the admin, be sure to either have an admin set up an account for you or let them know that you have an Enterprise gateway set up using your account and have them securely store the gateway recovery key. Alternatively, if an admin account is not used, be sure to add an IT admin as a gateway administrator in the next step as you configure the gateway.

    Configuring the gateway:

    After the installation of a gateway you need to log in to the Power BI Service (app.powerbi.com) with the user that you configured the gateway with. Go to Settings > Manage gateways and you will see several different configuration options that will affect how end users can see and interact with data sources on this gateway. The main call-out I have in these options is the first one. More often then not, you will want to make sure that you allow users to “mix” cloud and on premises data sources.

    gateway options

    If Gateway Administrators want other people to be able to access and create new data sources on the gateway for others to use it requires that every on-premises data source be setup and configured (Unlike the personal gateway). This means that the data source can use a single user/permission set for a data source and the report and end users will inherit the read permissions of that user. (A caveat to that would be the application of row level security, or a live connection, but that is beyond this overview).

    data source

    After the data source has been configured, the administrator needs to add any users to the data source so that they can deploy reports using the gateway. This is an ideal use case for using Active Directory security groups, this allows administrators to apply a single group and add and remove users from that group verses managing all the data sources in Power BI. If a user is not added to the data source on the gateway, the report publisher will not be able to setup a refresh using that gateway.

    data source users

    Scheduling a Report dataset to refresh:

    Now that you have completed the set-up of the gateway and added your users (including yourselves) to the gateway, you can publish a Power BI Desktop report and schedule a refresh.

    First, publish the report from the Power BI Desktop to the workspace that you want the report to live in.

    publish

    Next navigate to the workspace and select datasets, follow the dataset ribbon to the right and click on the ellipses:

    dataset location
    dataset settings

    Navigate to Datasets and expand the Gateway connection section. Enable the use of the gateway if it is not enabled already. All your source will be listed here, and if you have any data source connections strings that do not match exactly in your PBIX file it will become apparent very quickly that you have a broken dataset. All data sources in the gateway need to match exactly to what is in your PBIX file.

    enable gateway

    Once the gateway is enabled and all your data sources are working, you can schedule a refresh.

    schedule refresh

    One thing in particular to note here, when you deploy your report from your local time to the Power BI Service all times are stored in UTC times. So, if you are doing time specific calculations you may need to take some time zone things into consideration. Reza Rad has a good article outlining some methods to sort this problem out, you can find that here.

    A recent update to the dataset refresh now also allows us to add in email enabled groups or other specific users to the refresh failure section. This is extremely helpful in ensuring a wider audience of users can be notified any refresh fails.

    I hope you found this overview helpful, stay tuned for more blogs that walk through specific data source connection and refresh setups that will help ease the process of connecting to, and refreshing all your various data sources in Power BI.

    If you like the content from PowerBI.Tips, please follow us on all the social outlets to stay up to date on all the latest features and free tutorials.  Subscribe to our YouTube Channel, and follow us on Twitter where we will post all the announcements for new tutorials and content. Alternatively, you can catch us on LinkedIn (Seth) LinkedIn (Mike) where we will post all the announcements for new tutorials and content.

    As always, you’ll find the coolest PowerBI.tips SWAG in our store. Check out all the fun PowerBI.tips clothing and products:
    Store Merchandise