This weeks tutorial focuses on the need to control groups of visuals independently. This recently came up in a project where I needed to adjust all the items on the left side of the screen independently from the right side. By using the Edit Interactions button found on the Format ribbon you are able to adjust how different visuals interact with each other. Finally, adding multiple Slicers to the page for controls finishes out the report. I hope you enjoy this weeks tutorial.
Followup:
On the demo page of the report you’ll notice that when various items are selected, some of the non-selected items dis-appear. This is handled by using some formatting within the measures for the visuals. All the measures used in this tutorial are listed below:
Taking an Average of a Numerical Column:
Average of Values =
VAR calc = AVERAGE( Data[Value] )
RETURN if( calc = BLANK(), "", calc )
Making Dynamic Titles off of a list of items in a table:
Title =
VAR title = CONCATENATEX( VALUES( Data[Customer] ), Data[Customer], " & " )
RETURN if( title = BLANK(), "", title )
Producing a sum of values:
Total of Values =
VAR calc = SUM( Data[Value] )
RETURN if( calc = BLANK(), "", calc )
Want the file:
Need a little more help? Like the content from PowerBI.Tips. Please consider purchasing the demo PBIX file to support more great content.
[product id=”17894″ ]
Be sure to follow:
If you like the content generated from PowerBI.Tips please follow me on all the social outlets to stay up to date on all the latest features and free tutorials. Subscribe to me on YouTube. Or follow me on the social channels, Twitter and LinkedIn where I will post all the announcements for new tutorials and content.
Often when working with a Power BI report you will add a slicer that has a “Blank” item in the selection criteria. From a usability standpoint you might not want this item shown. Or maybe you have multiple items in the slicer that you would like to hide from the report consumers. The video, linked below, walks you through why the “Blank” item is shown and how to remove it.
Video on Adding Filters to a Slicer
Additional Slicer Materials
If you want to read more about syncing slicers check the official documentation release from the Microsoft Power BI Blog. This feature was originally released in February of 2018 and was announced here in the Power BI Blog.
Thanks for watching. If you like this content be sure to subscribe and follow along for more content.
Subscribe to me on YouTube. Or follow me on the social channels, Twitter and LinkedIn where I will post all the announcements for new tutorials and content.
This is part 2 in the 3 part series on developing super cool tables using some fancy measures. In part 1 we walked through how to build a table that uses an un-pivoted data source in the Query Editor. This technique allows you to change the types of categorical values in a table. If you missed part 1 and want to get caught up follow this link. Now, continuing with the series, Part 2, we will build the supporting materials (Selector Table, What If Slicers, and measures) for the report.
Once we are done the final product will look like the following:
Part 2… Go.
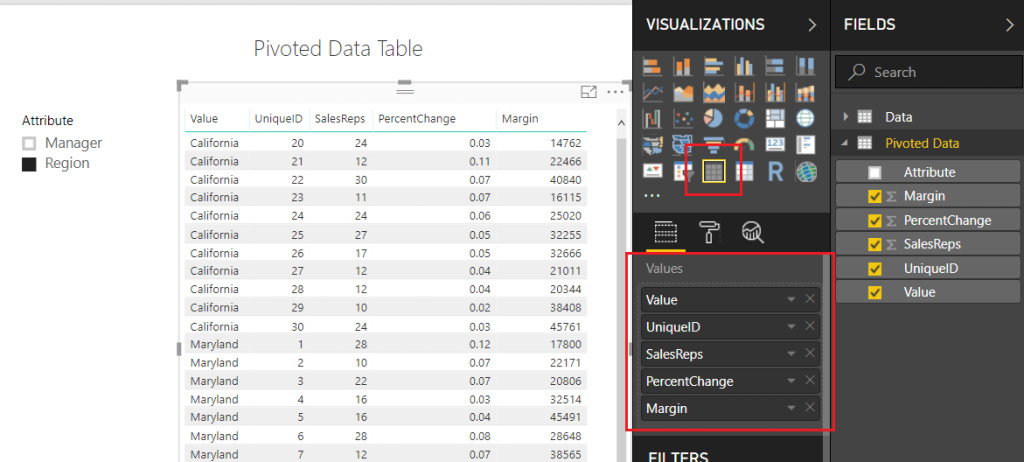
To make sure we are starting off on the correct step. We left off part 1 when we had completed a Pivoted Data Table and included an Attribute Slicer that would allow us to toggle between the Manager and Region Categories. Your table should look like the following diagram: (If you don’t have this you might want to start with Part 1 found here)
Pivoted Data Table
Note: I have also included a Slicer which is used with the Attribute field.
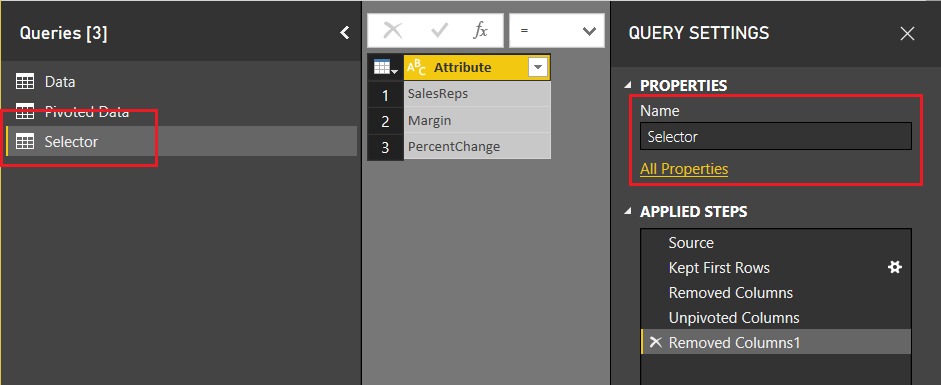
Next, we will need to add a table that will allow us to use the SalesReps, PercentChange, and Margin column headers in our report. On the Home ribbon click Edit Queries, then select New Source on the Home ribbon. In the Get Data window select Blank Query, click Connect to proceed. Open the advanced editor by clicking the Advanced Editor button found on the Home ribbon. Enter the following M code into the Advanced Editor:
let
   Source = #"Pivoted Data",
   #"Kept First Rows" = Table.FirstN(Source,1),
   #"Removed Columns" = Table.RemoveColumns(#"Kept First Rows",{"Attribute", "Value", "UniqueID"}),
   #"Unpivoted Columns" = Table.UnpivotOtherColumns(#"Removed Columns", {}, "Attribute", "Value"),
   #"Removed Columns1" = Table.RemoveColumns(#"Unpivoted Columns",{"Value"})
in
   #"Removed Columns1"
Click Done to close the Advanced Editor. Rename the table to Selector. When you are finished your table should look like the following:
Create Selector Table
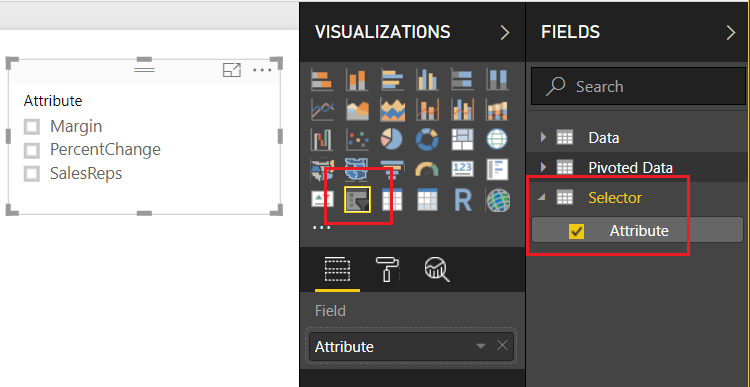
Click Close & Apply on the Home ribbon to close the Query Editor. Add a slicer with the following selections:
Add Selector Attribute Slicer
Now, we want to detect which of the Attributes have been selected from this table. We can accomplish this by creating a measure using the DAX function SELECTEDVALUE. Right Click on the table named Selector and from the drop down select New Measure. Enter the following DAX equation:
rankBy = SELECTEDVALUE(Selector[Attribute])
In addition to the knowledge of which column was selected from the selector table, we will also want to detect to make sure at least one categorical value has been selected. The categorical values we are talking about were generated earlier. The values could be either the Manager or Region values of the Attribute column in the Pivoted Data table. Using the ISFILTERED DAX function enables this section. Add the following measure to the Pivoted Data table:
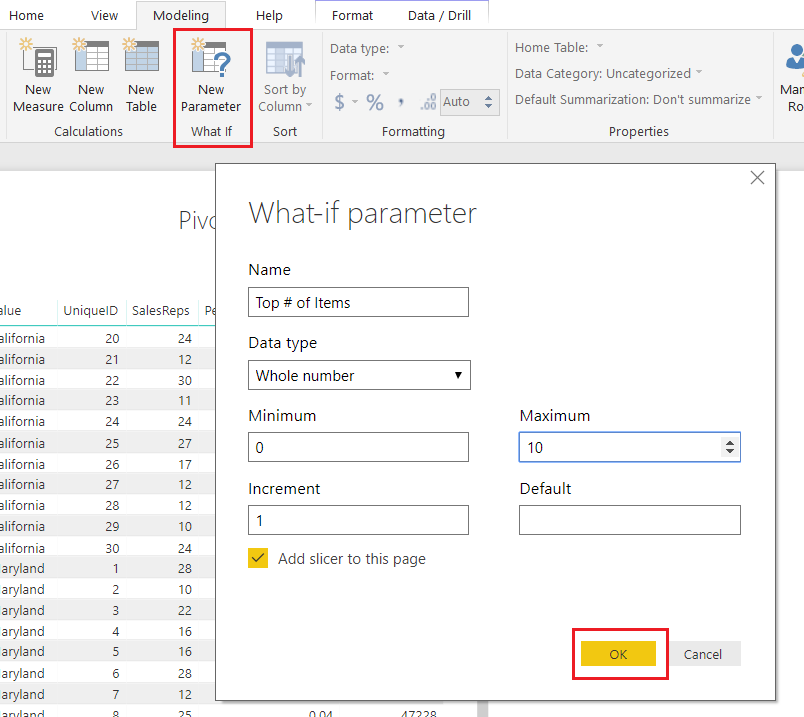
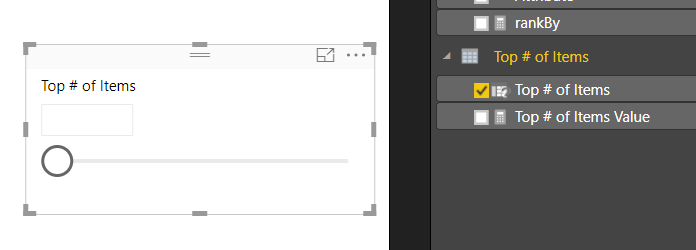
Next, we need to gather some user input in the form of a number from 1 to 10. To input this information we need to produce a What If Parameter. On the Modeling ribbon click New Parameter in the What If section of the ribbon. Enter the following information into the What-if parameter dialog box:
What If Parameter
Note: Don’t forget to change the Name of the parameter.
Click OK to proceed. Power BI will automatically produce a measure table, a measure and a slicer on the report page.
Slicer Produced by What-if
Note: By default there is nothing selected in the box. However, you can adjust the slicer and a number will appear within the value box. You can also type in a number between 1 and 10 to the box to adjust the value.
This is where we go crazy with DAX. This portion of DAX is where all the magic happens.
We start off by building our totals measures. Place all these measures in the Pivoted Data table.
Total % Change = MAX( 'Pivoted Data'[PercentChange] )
Total Margin = SUM( 'Pivoted Data'[Margin] )
Total SalesReps = SUM( 'Pivoted Data'[SalesReps] )
These will be used repeatedly in our next group of DAX formulas.
The following measures will produce a calculated ranking for each numerical column. OK, Pause, This part really excites me here because the next few measures are where the magic happens. Pay close attention to what is happening here. Un-Pause, by using the DAX Switch function we can dynamically tell Power BI to adjust which column we want to see ranked by the top items. For example, if we select SalesReps in our attribute slicer. The following measures will automatically rank all the items in the table by the column named SalesReps. Thus, the items with the highest counts of SalesReps will be listed first. When you select Margin, the table will automatically adjust and re-rank the items by the Margin column. This is being done in the switch statement. For each column we are calculating custom rankings and then hiding or replacing values with the Blank() DAX function to not show items we don’t want.
Enter the following three measures into the Pivoted Data Table:
Whew, that was a ton of measures. All the key components are complete now. In part 3 we will clean up our report page and make it shine. I hope you enjoyed this tutorial. Also, follow me on Twitter and Linkedin where I will post all the announcements for new tutorials and content.
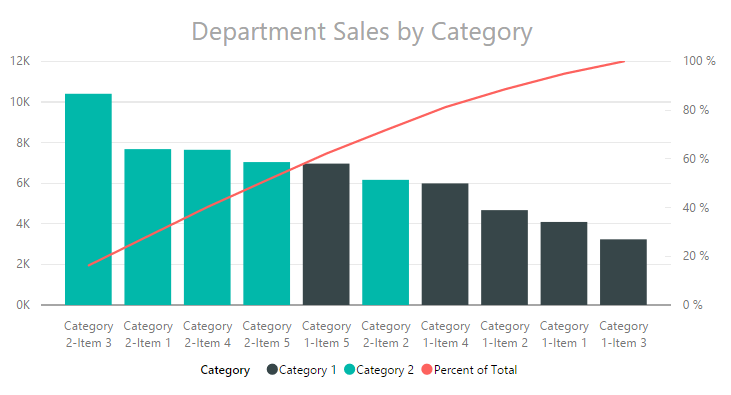
The Pareto chart is a handy visual, but is not so easy to build in either excel or PowerBI. In a Pareto chart, information is provided about an individual product or category as a bar, and a cumulative scale as a line which compairs all bars. This type of visual can be extremely helpful when conducting failure mode analysis, causes of a problem, or even product portfolio balances. For some more information on Pareto charts you can learn more here or here. If you’re interested in building a Pareto chart in excel, I have found this post from Excel Easy to be helpful.
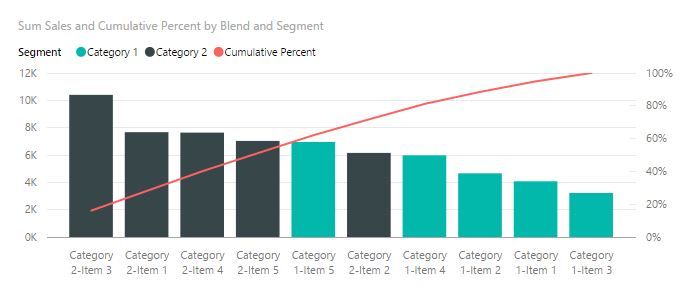
To give you a little teaser of what we will be building today, below you will see an image of the final Pareto chart. On the left side we have sales of units, and on the right is the cumulative percent of all sales. Using the Pareto chart a user has the ability to see which products comprise the majority of your sales. For example, the first 4 bars total approximately 50% of all sales.
Pareto Final Product
Alright, let’s get started.
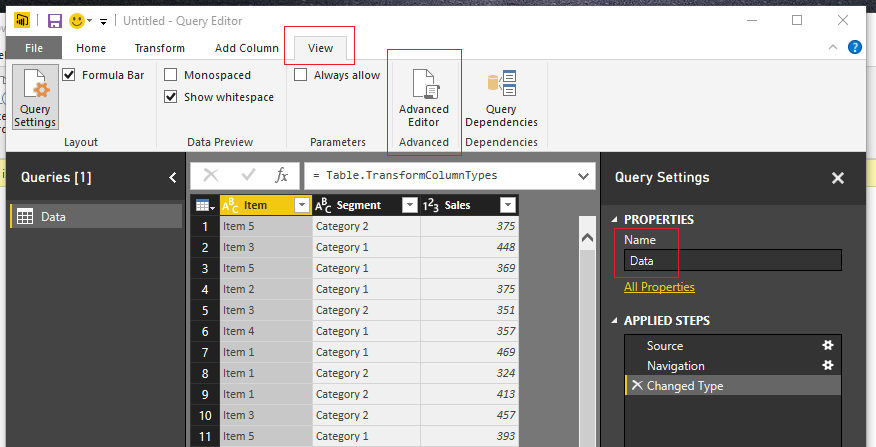
Open up PowerBI Desktop, Click the Get Data button on the Home ribbon and select Blank Query. Click Connect to open the Query Editor. ClickAdvancedEditor on the View ribbon. While in the Advanced Editor paste the following code into the editor window.
Note: If you need some more help loading the data follow this tutorial about loading data using the Advanced Query Editor. This tutorial teaches you how to copy and paste M code into the Advanced Editor.
let
 Source = Excel.Workbook(Web.Contents("https://powerbitips03.blob.core.windows.net/blobpowerbitips03/wp-content/uploads/2016/10/Sample-Data.xlsx"), null, true),
 Table1_Table = Source{[Item="Table1",Kind="Table"]}[Data],
 #"Changed Type" = Table.TransformColumnTypes(Table1_Table,{{"Item", type text}, {"Sales", Int64.Type}, {"Segment", type text}})
in
 #"Changed Type"
Rename the Query to Data. Once you’ve completed the data load your data should look like the following.
Load Data to Query Editor
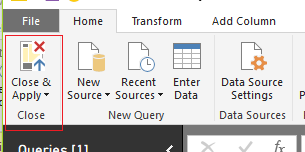
On the Home ribbon click Close & Apply to complete the data load.
Close and Apply
Let’s begin with a little exploration of our data.
Pro Tip: When I am building reports I often load the data and then immediately start building a couple of tables and slicers. It helps me understand how my data reacts to the slicers and helps me determine how to shape the data so that the visuals will work properly. For this example, we only have one table, but when loading data things can get rather complex due to loading multiple tables with multiple relationships.
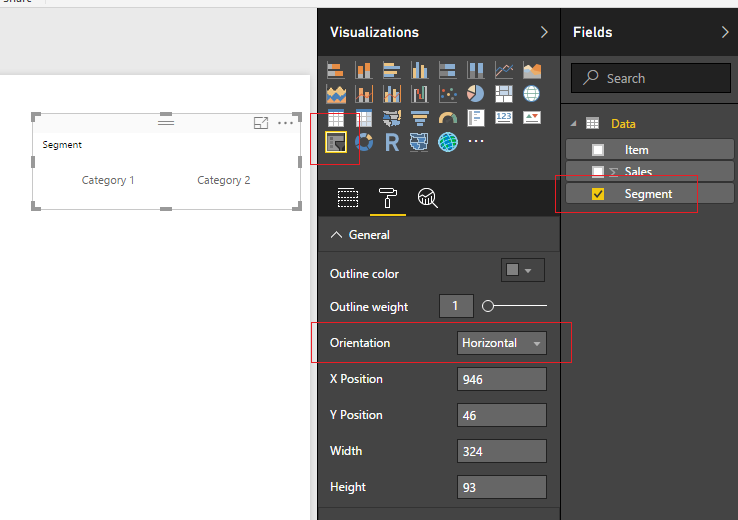
Add a Slicer for the Segment. Enhance the look of the slicer by changing it from a vertical to a horizontal slicer. While the slicer is highlighted, click the Paint Roller expand the General section and change the orientation from vertical to Horizontal.
Segment Slicer
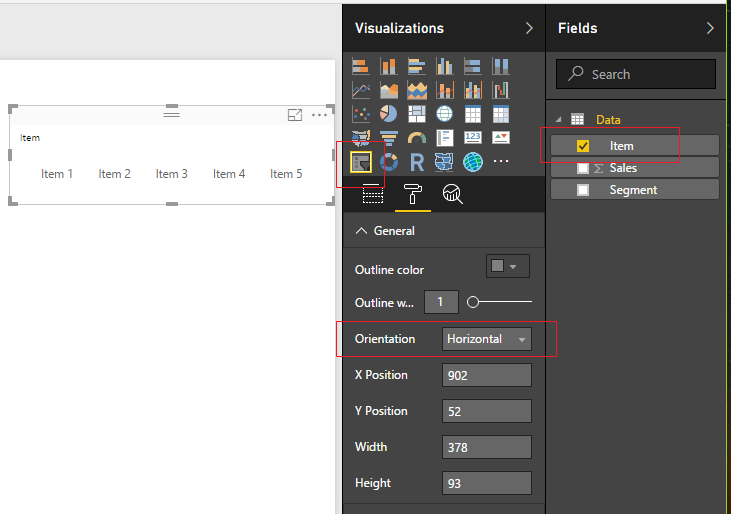
Repeat the same process to add a Slicer for the item field.
Item Slicer
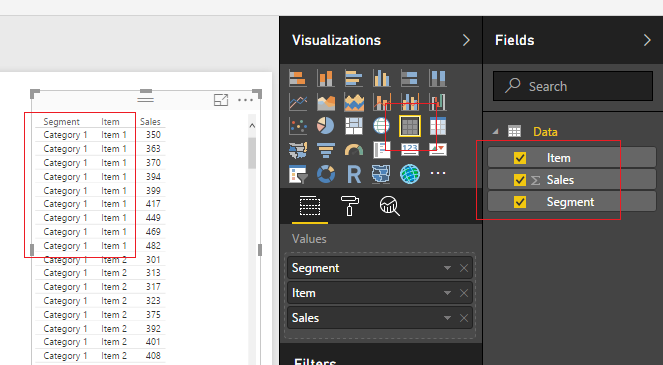
Next, add a table view of all the fields. Start with Segment, then Item and finally add Sales to the Table Visual.
Data Table
Notice, now that we added all the Fields, there are a number of repeating values. We have Category 1 and Item 1 repeated 9 times. In some cases, it will be necessary to have this level of data brought into the data model within PowerBI. A common reason is that this level of granularity is required for other report pages, or visuals. It is OK to bring large amounts of data, but as a method of best practice it is recommended that you bring in the data required to support the visuals.
Now, to address these multiple items that we see in our data. In the sample Pareto image provided at the beginning of this Tutorial we only had one bar for Category 2 Item 3. Thus, we need to summarize each grouping of every Category and Item combination. To do this we will construct a summary table.
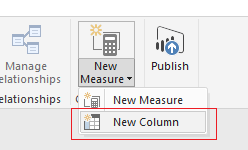
First, we will create a unique Key that will be used to summarize each combination of Category and Item pair. Click the bottom half of the New Measure button located on the Home ribbon.
Calculated Column
Enter the following DAX expression. This new column titled Blend will be the unique Key that is utilized to summarize the data.
Blend = Data[Segment] & "-" & Data[Item]
Select the Modeling ribbon and then click on the New Table button. Enter the following DAX expression.
For more information on the SUMMARIZE function you can visit the Mircosoft Summarize documentation page. In this equation we first select the table and in this case it is ‘Data’. Then the column we want to summarize or group by is the Segment column noted as Data[Blend]. The next field is the title of the summarized field column, noted as “Sum Sales”. Then DAX function that calculates the Sum of the column labeled Data[Sales], noted as SUM(Data[Sales]). It is relevant to point out here that the SUMMARIZE function will only work with building a new table and not as a calculated column or measure.
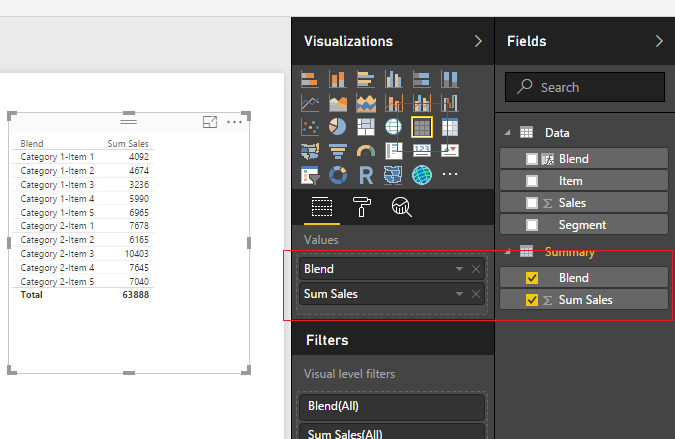
Add a new Table visual to the report and include the two newly created fields from the Summary table.
Summary Table Visual
We have a field titled Blend which is our Key for all the summarized groupings. Next, we will want to parse out the Segments and Items from this blend column. We will want to use Category 1 & 2 in a slicer and the same for Items 1 to 5. Highlight the summary table by clicking the grey space next to the word Summary. Click the New Column button on the Modeling ribbon and enter the following DAX expression.
In this expression the Substitute function replaced the dash “-” with a “|” character. Then the PATHITEM function can then parse the text into segments. By entering a 1 we select the first item in the sequence. For our example we only have two items, but when you’re working with file paths you can have multiple items in the path such as “\users\mike\my documents\my folder\”, which would equate to users = position 1, mike = position 2, my documents = position 3, etc..
Add another new column with the following DAX expression for the item column.
Note: We changed the PATHITEM position from 1 to 2.
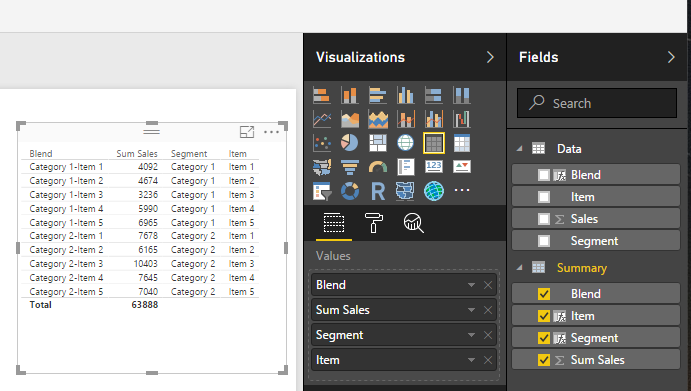
Next add the newly created Segment and Item columns to our summary table visual that we created earlier.
Add New Fields
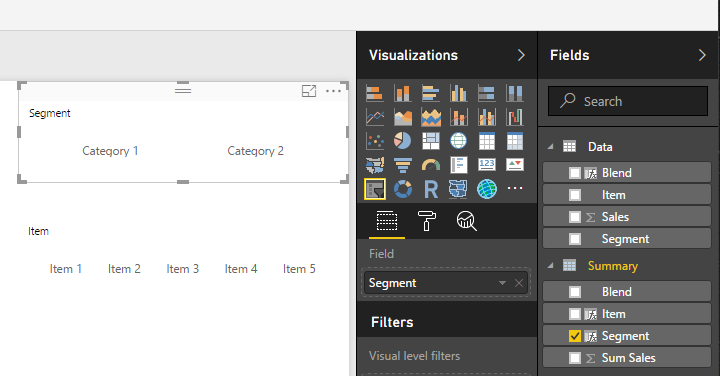
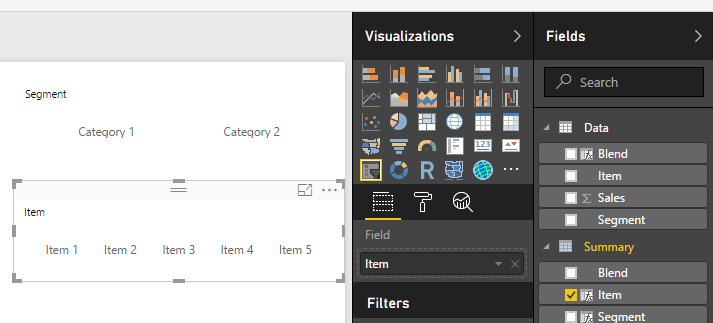
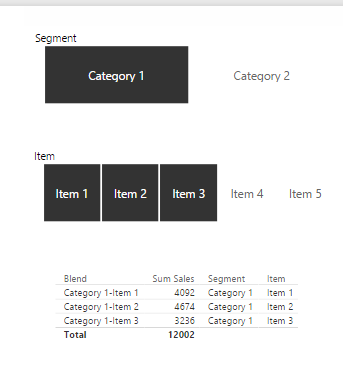
Nice job so far. Now we have to modify our slicers to point to the new Item and Segment fields we created in the Summary table. Select the Segment Slicer Visual and add the Segment Field from the Summary table.
Update Segment SlicerUpdate Item Slicer
Now that we have updated the slicers, we can now can control the table visual made from the Summary table.
Select Category 1 and Items 1 to 3
Pro Tip: To select multiple items in a slicer you can hold down the Ctrl button on the key board and click multiple slicer items. This is how I was able to select Items 1 to 3.
Now we are ready to build the measures that will support the Pareto chart. Click on the bottom half of the New Measure button on the Home ribbon and select New Column. Add the following DAX expression to rank all the items in the Summary table.
Ranking = RANKX( 'Summary', 'Summary'[Sum Sales])
Add a measure for the Cumulative total according to the new ranking column we created. Click the top half of the New Measure button on the Home ribbon. Add the following DAX expression.
Repeat the add measure process and add a Total measure which will total only the items from the summary table that have been selected in the report view. Add the following DAX expression.
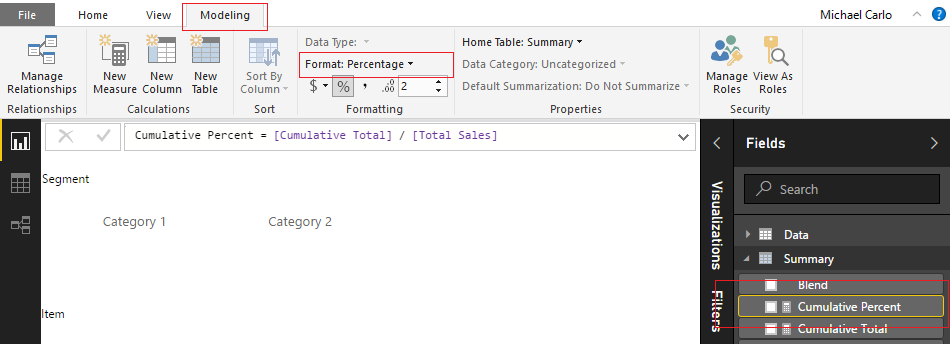
The Cumulative Percent measure is a calculated as a percentage, thus we need to change this measure’s formatting to percentage. Click the measure labeled Cumulative Percent then change the Format to Percentage which is found on the Modeling ribbon.
Change Formatting
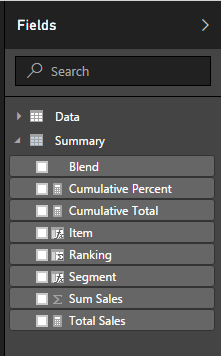
Your Summary table should now look like the following.
Updated Fields List
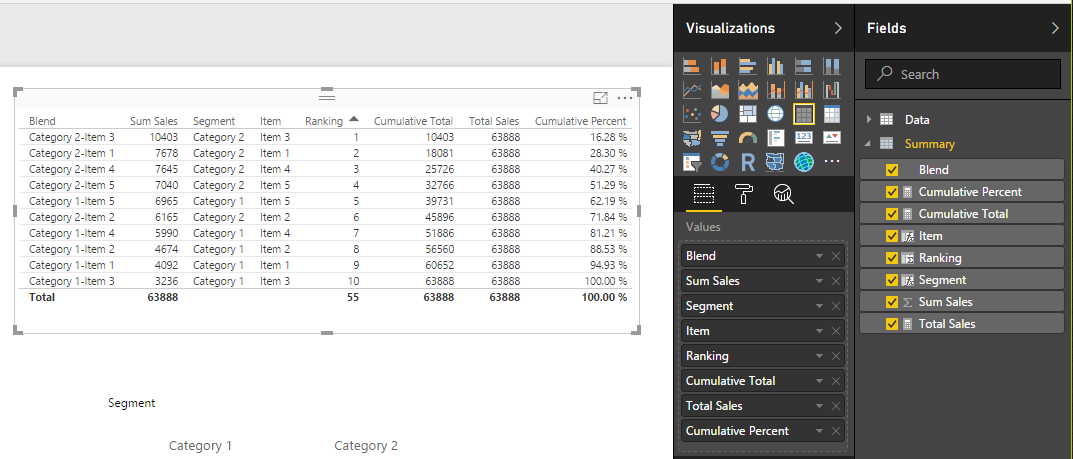
To see all the calculations that we just created add all the fields from the Summary table to the Summary table visual we created earlier.
Full Summary Table Visual
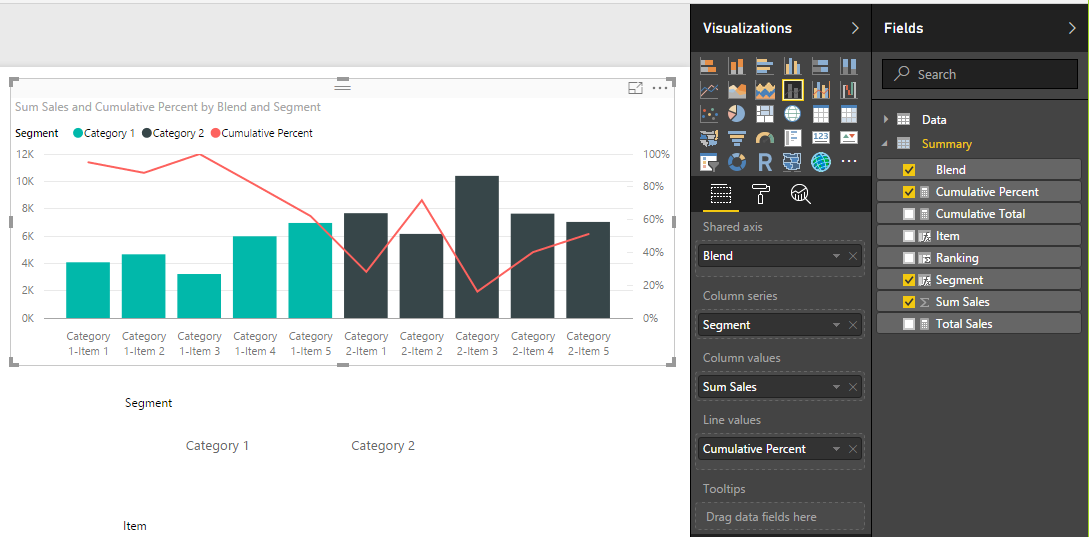
At last, we are ready to add the Pareto chart. Add the following fields to the line and stacked column chart.
Add Line and Stacked Bar Chart
Order the data in descending order by the number of sales by click the visual’s Ellipsis and selecting Sort By Sum Sales.
Sort by Sales
This changes the order of the items to make a Pareto chart.
Final Pareto Chart
Thanks for following along. Share if you enjoyed this tutorial.
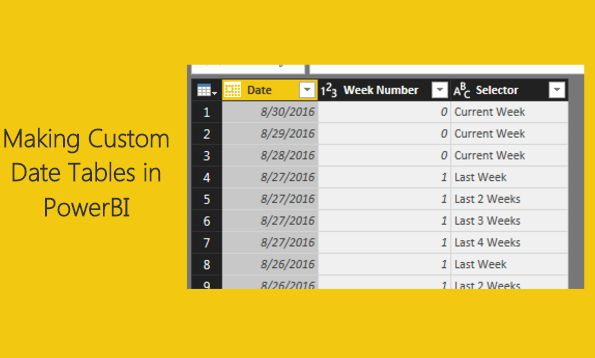
Recently at work I’ve been working with a number of large data warehouses with time series data. Often when working on such data you need to incorporate a data calendar to compute date ranges. So, for this tutorial we will build a custom date table directly inside PowerBI.
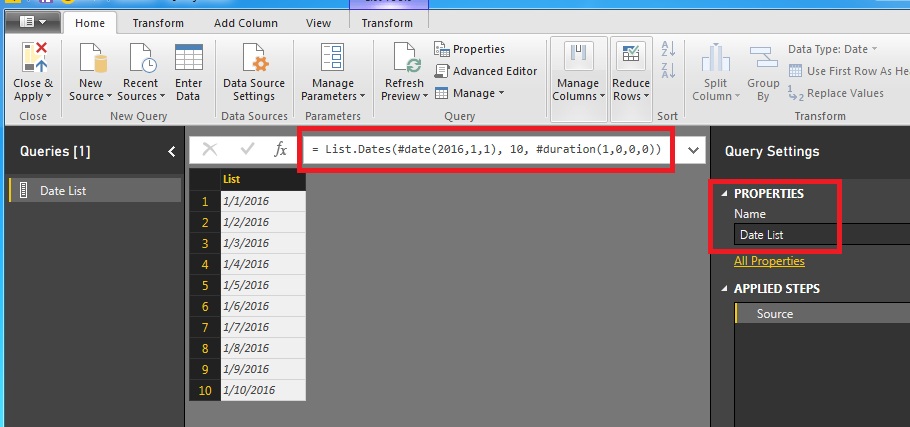
Start by opening up power BI and clicking Get Data on the home ribbon, then select Blank Query. Like always make sure you start by re-naming the query into something meaningful. Change the name of the Query to Date List. Next enter the following equation into the formula bar:
Note: For more information on the M language you can visit here. Also, here is the link to the List.Dates function found here.
Once we enter the formula into the formula bar the list of dates will appear below.
Date List
The quick explanation about the List.Dates function is below. I’ve simplified the variables below:
List.Dates( Start Date , Number of intervals , Type of interval )
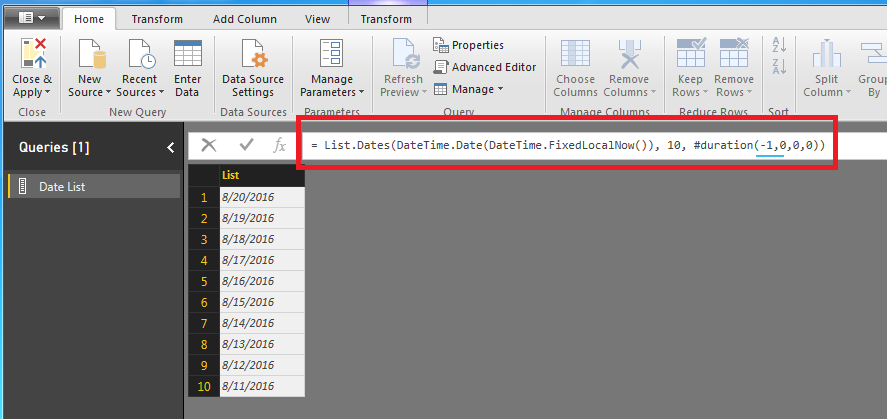
While this is interesting it does not help us make a report that updates the date range dynamically. The real world use case for this would be you have a report with data that is being generated daily, say for example a website. Maybe you want a custom date range that automatically changes every day you log into PowerBI. For example if today is 08-20-2016, I want the first date to be today and then list the dates that previous 10 days.
Note: In this equation we have changed the duration to -1. This is important to note because now our date table returns older dates. In our previous equation we used a positive 1 and we return future dates.
In this new equation we have defined the Start Date to the following statement : DateTime.Date( DateTime.FixedLocalNow() ) This is tricky because if you only use DateTime.FixedLocalNow() the statement will error out. The error occurs because the DateTime.FixedLoaclNow() is a date and time. The List.Dates function is expecting a Date only value. Hence why we use the DateTime.Date() function to remove the time stamp and only return today’s date.
Date List Using Date of Today
It is most likely your date ranges will be different than the ones in the example because the DateTime.FixedLocalNow() function will be pulling in your computer’s current date.
Next modify the equation to now pull the last 90 days (highlighted in red below)
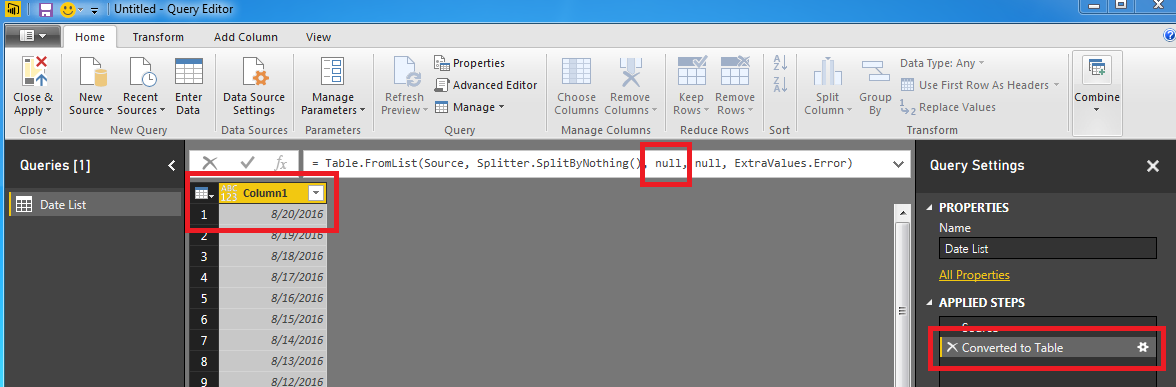
The list of dates is just that a list. We really can’t do to many other enhancements to our data with only a list of dates. Now transform the list into a table. Click on the Transform ribbon and select To Table. Notice now that we have a new column and a new applied step.
I colored the first null in the equation. This is actually a parameter that you can use to name the new column we just made. Tricky, Tricky, PowerBI. Modify the equation to the following:
Our table is updated and now has the name Date. Nice work!
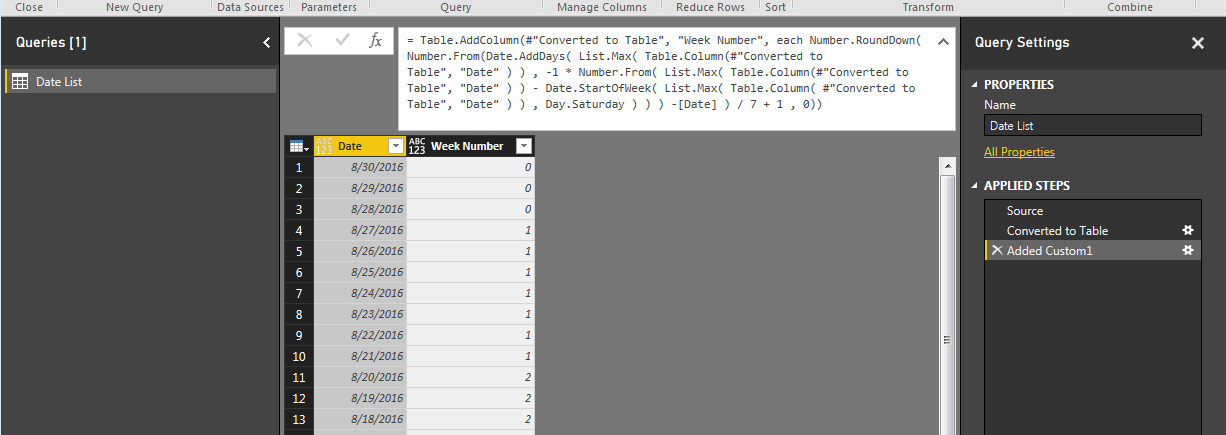
Now lets make our date list useful. Click on the ribbon labeled Add Column and then the button labeled Add Custom Column. Add the following equation to the new column and name it Week #, then click OK, to continue.
This equation defines the start of the week highlighted in RED. Since today is Tuesday 8/30/16, then the days 8/30 (Tues), 8/29 (Mon), 8/27 (Sunday) are considered week 0 or the current week. All dates prior will start with weekly increment.
Date List
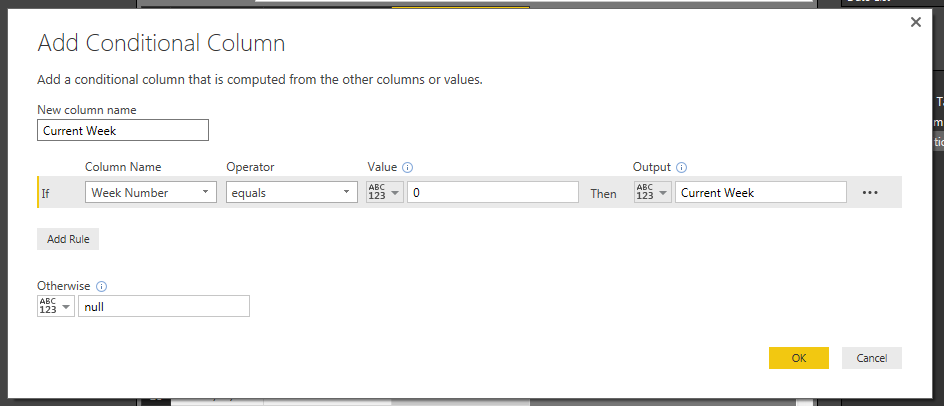
Now we can add some logic to define week variables. Click on the Add Column ribbon and select the Conditional Columnbutton. Using the drop downs in Column Name, Operator, Value and Output enter the following:
Current Week Logic
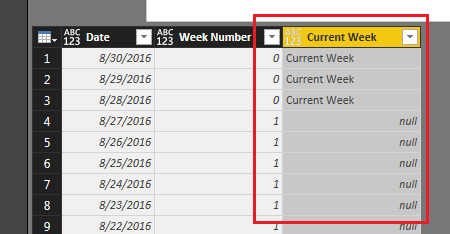
Click OK to proceed. We have now added an additional column with a text description of the week.
Current Week Column
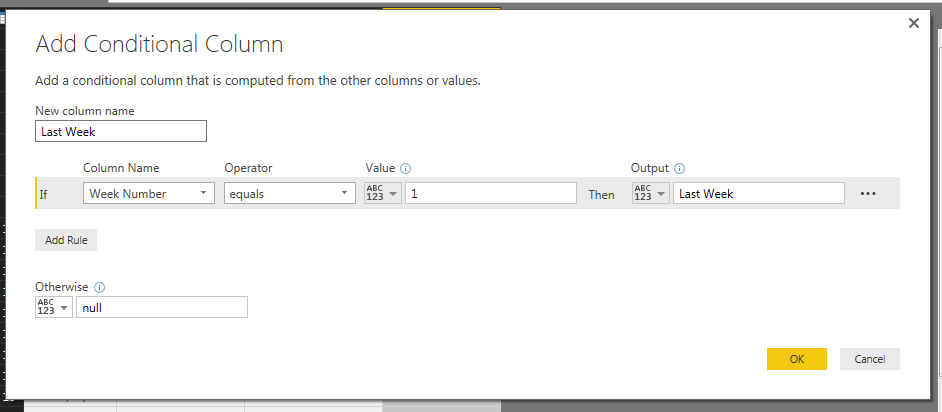
Following the add column steps mentioned above we will now add more week descriptions. Add the following conditional column for Last Week:
Last Week Logic
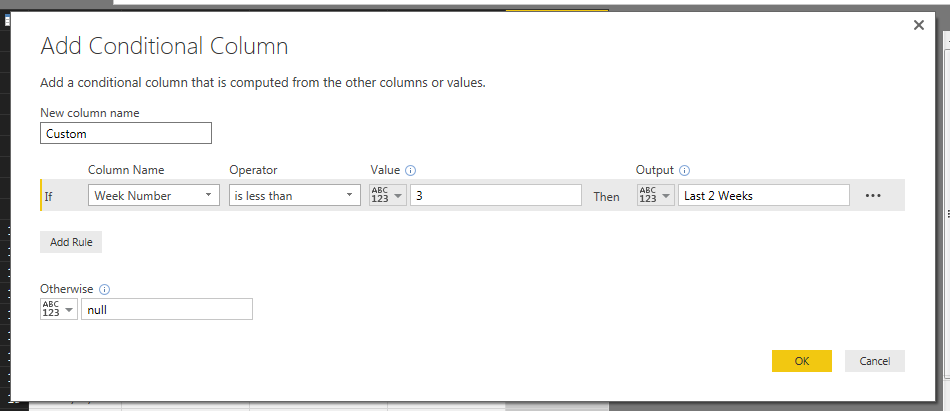
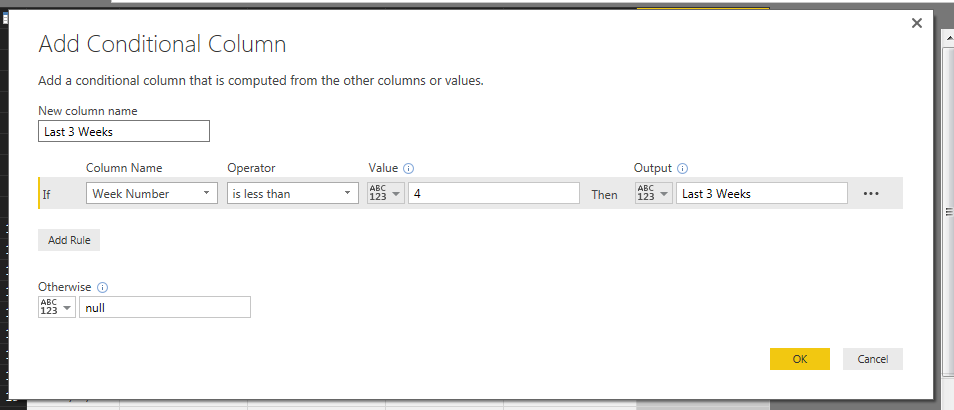
From here you can make custom columns for how you want to describe your data. In this example we will build last 2 weeks, 3 weeks and last 4 weeks. See the add conditional column logic for each of those respective weeks.
Conditional Column Logic for last 2 weeks:
Last 2 Weeks Logic
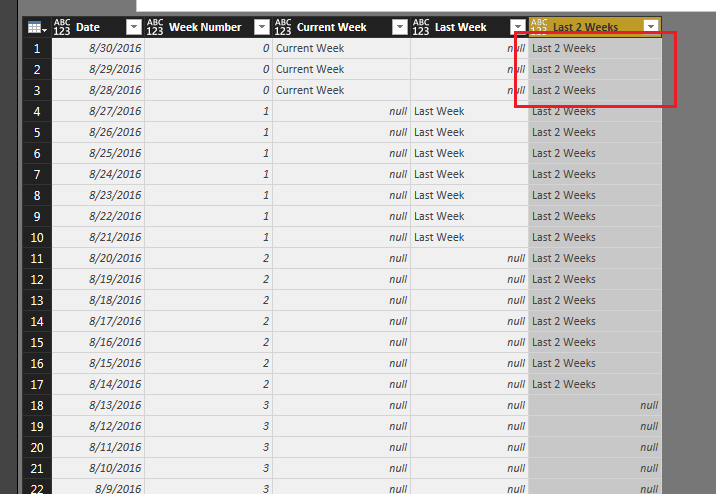
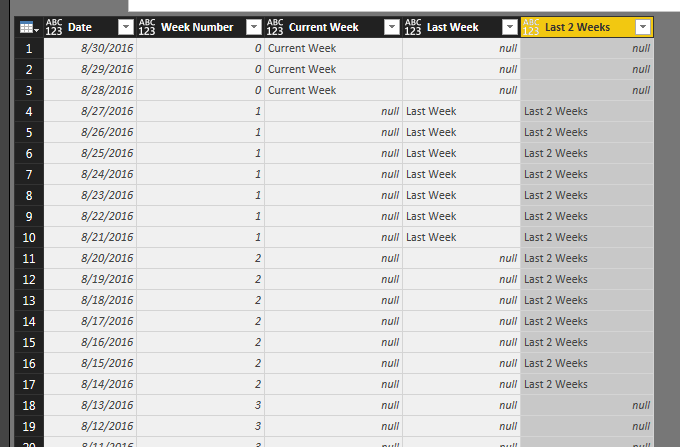
Note: When we added this conditional column we label week 0 as last 2 weeks. See image below as an example:
Last 2 Weeks Column
To fix this we modify the code that generated this column. The code initially states the following:
= Table.AddColumn(#"Added Conditional Column1", "Last 2 Weeks", each if [Week Number] < 3 then "Last 2 Weeks" else null )
We modify this code to the following: (changes highlighted in bold)
= Table.AddColumn(#"Added Conditional Column1", "Last 2 Weeks", each if [Week Number] < 3 and [Week Number] > 0 then "Last 2 Weeks" else null )
This now removes the first three days from our Last 2 Weeks column reflecting a more accurate picture of our time ranges.
Corrected Last 2 Weeks Column
Next we will add the Last 3 Weeks column and the Last 4 weeks column. Each time we will modify the add column code to remove the first three dates of the current week.
Last 3 Weeks Logic
Last 3 Weeks auto generated code:
= Table.AddColumn(#"Added Conditional Column2", "Last 3 Weeks", each if [Week Number] < 4 then "Last 3 Weeks" else null )
We modify to the following to achieve the correct Last 3 Weeks data range: (changes highlighted in bold)
= Table.AddColumn(#"Added Conditional Column2", "Last 3 Weeks", each if [Week Number] < 4 and [Week Number] > 0 then "Last 3 Weeks" else null )
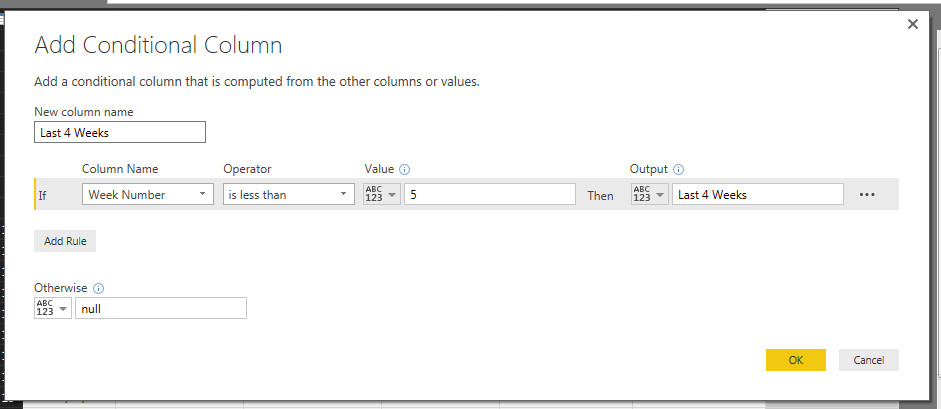
Add the Last 4 Weeks column:
Last 4 Weeks Logic
Last 4 Weeks auto generated code:
= Table.AddColumn(#"Added Conditional Column3", "Last 4 Weeks", each if [Week Number] < 5 then "Last 4 Weeks" else null )
Modify the code the following to correct the column: (changes highlighted in bold)
= Table.AddColumn(#"Added Conditional Column3", "Last 4 Weeks", each if [Week Number] < 5 and [Week Number] > 0 then "Last 4 Weeks" else null )
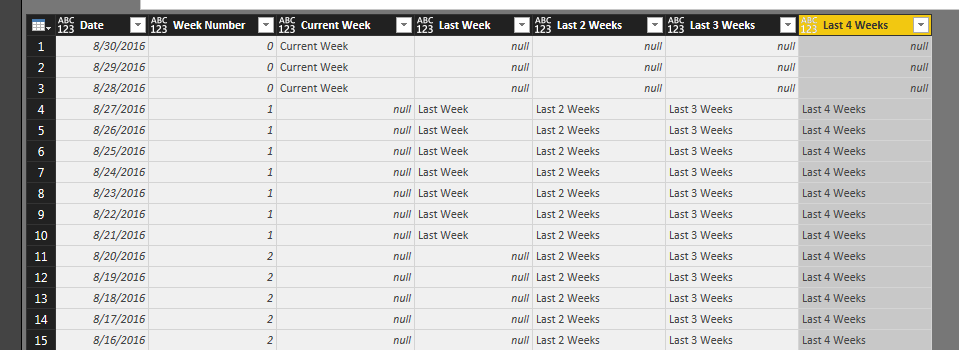
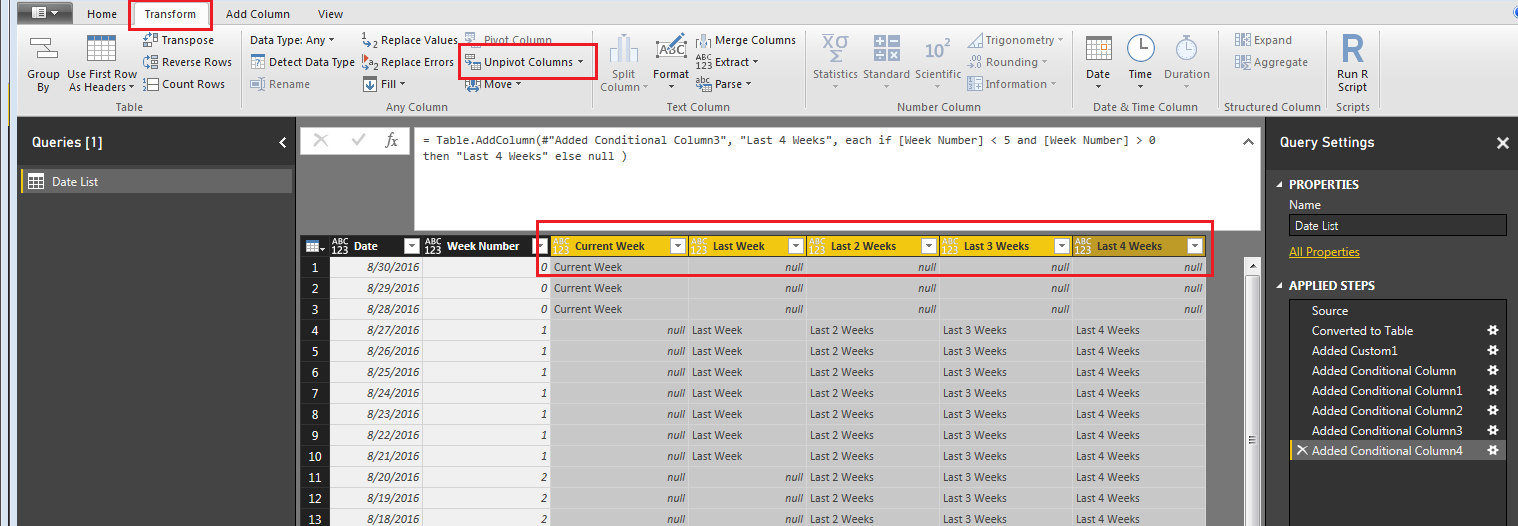
Nice job so far. We are almost to the end now. After all those additional columns you should have something that looks similar to the following:
Date Table
Next we will pivot all the data down to one column. This will enable us to select a time period and automatically have our date table update to the specific range.
First, shift select the following columns, Current Week, Last Week, Last 2 Weeks, Last 3 Weeks, and Last 4 Weeks. Then on the Transform ribbon click the Unpivot Columns button.
Unpivot Columns Command
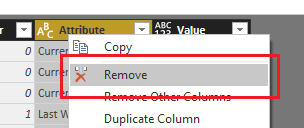
Next delete the Attribute column using a right click on the Attribute column and selecting Remove Columns.
Remove Attribute Column
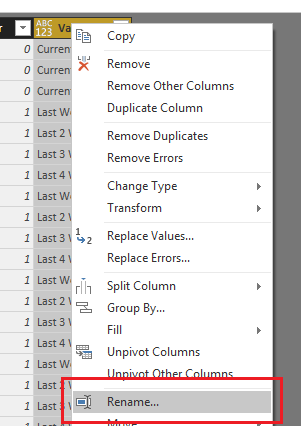
Rename the Value column to Selector by right clicking on the Value column.
Rename the Value Column
Modify each column to have the correct Data Type on the Home ribbon.
Date column data type should be Date
Week Number column data type should be Whole Number
Selector column data type should be Text
Note: It is important to always check your data types for each column before you leave the Query Editor. If you don’t you’ll find that the visuals that your trying to build later on on the page view will not work as expected.
Next, click the Home ribbon and select Close & Apply. You can now build the following visuals:
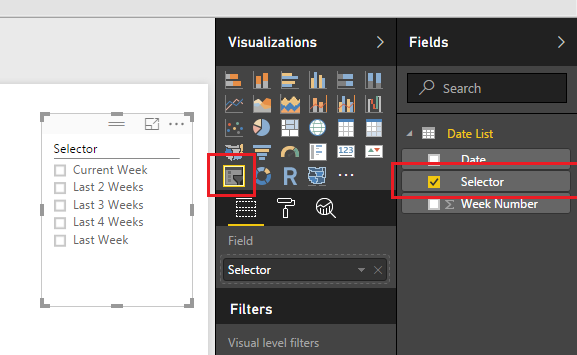
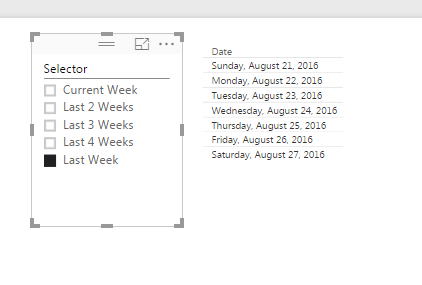
A slicer for the Selector column:
Selector Column as a Slicer
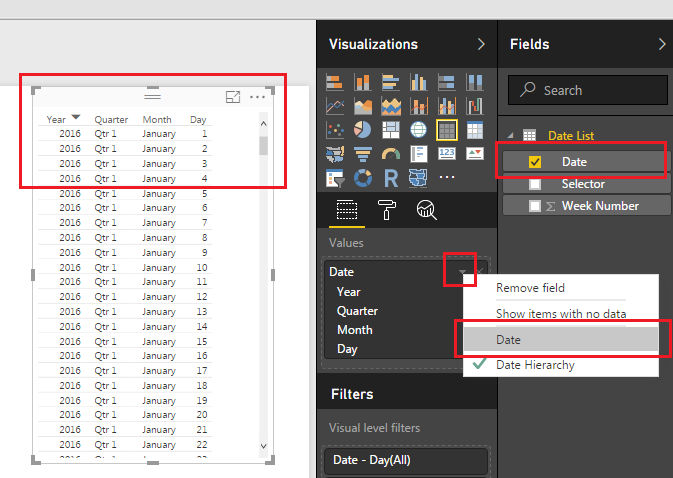
Table visual for the Date column:
Note: When you use the Date Column as the data source for the Table Visual the data will automatically be added as a Date Hierachy. This does not work well with our data so you will need to change the date from a Date Hierarchy to a standard Date. To do this click the little triangle next to the Date in the Values box. Then select Date.
Date Table
Now you can finally play around with your data and by selecting different items in the Selector slicer you can filter down to different date ranges. Below I selected the Last Week item, which filters down my dates to only the 7 days from last week.
Last Week Slicer Selected
Nice job making a custom date table in PowerBI. The nice part about this table is that it will always refresh with the latest dates whenever the queries are refreshed for this PowerBI file.
Bonus: For those of you who want to cheat and just have the M code to generate this custom date table it can be used from here:
let
 Source = List.Dates(DateTime.Date(DateTime.FixedLocalNow()), 90, #duration(-1,0,0,0)),
 #"Converted to Table" = Table.FromList(Source, Splitter.SplitByNothing(), {"Date"}, null, ExtraValues.Error),
 #"Added Custom1" = Table.AddColumn(#"Converted to Table", "Week Number", each Number.RoundDown( Number.From(Date.AddDays( List.Max( Table.Column(#"Converted to Table", "Date" ) ) , -1 * Number.From( List.Max( Table.Column(#"Converted to Table", "Date" ) ) - Date.StartOfWeek( List.Max( Table.Column( #"Converted to Table", "Date" ) ) , Day.Saturday ) ) ) -[Date] ) / 7 + 1 , 0)),
 #"Added Conditional Column" = Table.AddColumn(#"Added Custom1", "Current Week ", each if [Week Number] = 0 then "Current Week" else null ),
 #"Added Conditional Column1" = Table.AddColumn(#"Added Conditional Column", "Last Week", each if [Week Number] = 1 then "Last Week" else null ),
 #"Added Conditional Column2" = Table.AddColumn(#"Added Conditional Column1", "Last 2 Weeks", each if [Week Number] < 3 and [Week Number] > 0 then "Last 2 Weeks" else null ),
 #"Added Conditional Column3" = Table.AddColumn(#"Added Conditional Column2", "Last 3 Weeks", each if [Week Number] < 4 and [Week Number] >0 then "Last 3 Weeks" else null ),
 #"Added Conditional Column4" = Table.AddColumn(#"Added Conditional Column3", "Last 4 Weeks", each if [Week Number] < 5 and [Week Number] > 0 then "Last 4 Weeks" else null ),
 #"Unpivoted Columns" = Table.UnpivotOtherColumns(#"Added Conditional Column4", {"Date", "Week Number"}, "Attribute", "Value"),
 #"Removed Columns" = Table.RemoveColumns(#"Unpivoted Columns",{"Attribute"}),
 #"Renamed Columns" = Table.RenameColumns(#"Removed Columns",{{"Value", "Selector"}}),
 #"Changed Type" = Table.TransformColumnTypes(#"Renamed Columns",{{"Date", type date}, {"Week Number", Int64.Type}, {"Selector", type text}})
in
 #"Changed Type"
Manage Consent
To provide the best experiences, we use technologies like cookies to store and/or access device information. Consenting to these technologies will allow us to process data such as browsing behavior or unique IDs on this site. Not consenting or withdrawing consent, may adversely affect certain features and functions.
Functional
Always active
The technical storage or access is strictly necessary for the legitimate purpose of enabling the use of a specific service explicitly requested by the subscriber or user, or for the sole purpose of carrying out the transmission of a communication over an electronic communications network.
Preferences
The technical storage or access is necessary for the legitimate purpose of storing preferences that are not requested by the subscriber or user.
Statistics
The technical storage or access that is used exclusively for statistical purposes.The technical storage or access that is used exclusively for anonymous statistical purposes. Without a subpoena, voluntary compliance on the part of your Internet Service Provider, or additional records from a third party, information stored or retrieved for this purpose alone cannot usually be used to identify you.
Marketing
The technical storage or access is required to create user profiles to send advertising, or to track the user on a website or across several websites for similar marketing purposes.