
Every so often you find a hidden gem, something so valuable, just hiding there in plain sight. Recently, I found out that I LOVE the using Variables with in a DAX expression. Ok, brief introduction, I was trying to calculate sales changes between different years. The data looked similar to the following table:
| Year | Month | Sales |
| 2013 | 1 | 20 |
| 2013 | 2 | 25 |
| 2014 | 1 | 22 |
| 2014 | 2 | 23 |
| 2015 | 1 | 21 |
| 2015 | 2 | 31 |
I wanted to sum the sales for each year and compare the percent change between each year. If you have followed my blog for a while, I have a ton of tutorials about percent change. ( See list of other tutorials dealing with percent change )
Now, for the twist making this calculation more difficult. I want to calculate percent change even when a filter is applied by clicking on a visual. By using variables we can apply some data modeling voodoo magic to get the desired results. See a sample of the measures working in the Power BI Embedded sample below:
Let’s dive in!
Open up PowerBI Desktop, Click the Get Data button on the Home ribbon and select Blank Query. Click Connect to open the Query Editor. On the View ribbon click the Advanced Editor button. While in the Advanced Editor paste the following code into the editor window, click Done to complete the data load.
Note: If you need some more help loading the data follow this tutorial about loading data using the Advanced Query Editor. This tutorial teaches you how to copy and paste M code into the Advanced Editor.
let
 Source = Excel.Workbook(Web.Contents("https://powerbitips03.blob.core.windows.net/blobpowerbitips03/wp-content/uploads/2017/05/Clothing-Sales.xlsx"), null, true),
 ClothingSales_Table = Source{[Item="ClothingSales",Kind="Table"]}[Data],
 #"Changed Type" = Table.TransformColumnTypes(ClothingSales_Table,{{"Date", type date}, {"Category", type text}, {"Sales", Int64.Type}}),
 #"Inserted Year" = Table.AddColumn(#"Changed Type", "Year", each Date.Year([Date]), type number)
in
 #"Inserted Year"
Your loaded data should look like the following:
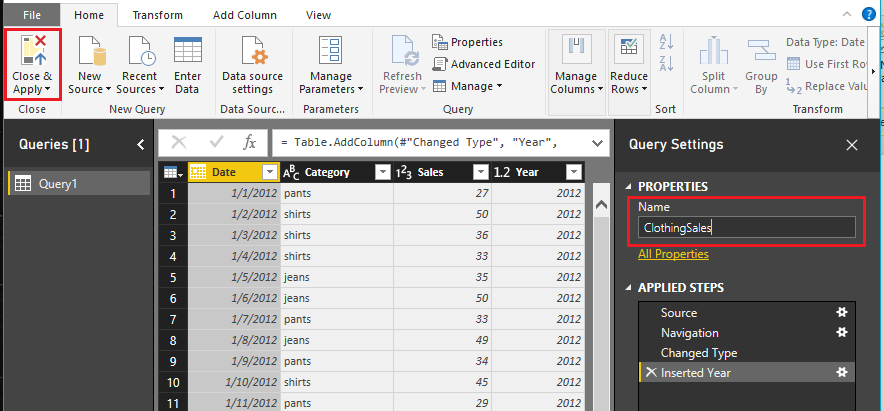
Rename the Query to ClothingSales, and click Close & Apply to load the data into the data model.
It is a good practice to review the data columns and verify that the formatting is set up correctly. To do this click on the the column Date in the Fields pane, then click on the Modeling ribbon. In the Formatting section change the format to Date Time and select M/d/yyyy format. Repeat this for the following columns:
- Format Sales to Currency then select $ English (United States)
- Format Year to Whole Number
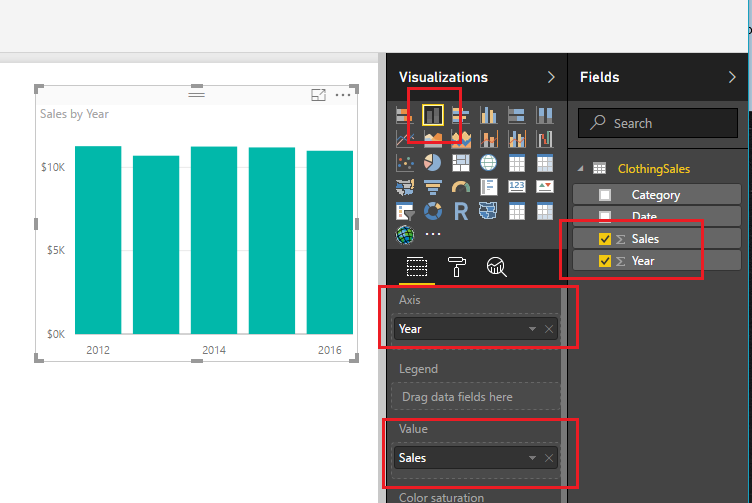
With our data properly formatted we are ready to build a simple bar chart. See the image below for the bar chart set up:
To start we will create a explicit calculation for the total selected sales. On the Home ribbon click the New Measure button and enter the following code:
Total Selected Sales = SUM(ClothingSales[Sales])
Pro Tip: To learn more about explicit vs implicit calculations within Power BI Click the following link.
Add a Card visual and add our new measure.
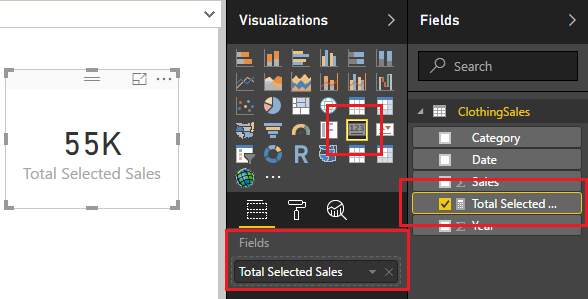
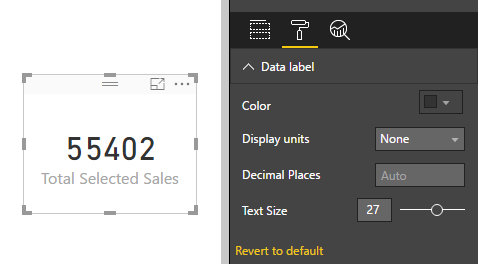
Let’s change the formatting measure so we can see the full number. With the Card still selected click the Paint Roller expand the section labeled Data label and change the units from Auto to None. This allows us to see the entire sales number.
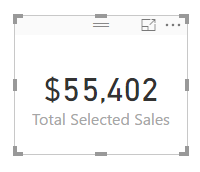
Let’s enhance this card visual further by adding dollars formatting. Make sure you have the Total Selected Sales measure selected by Clicking on the words of the measure. Then, click on the Modeling ribbon click and change the Format to Currency, then select $ English (United States). The final format of the card visual should look like the image below:
For the next step we will repeat the previous steps for our new measures.
- Create the measure
- Change the formatting of the card
- Change the formatting of the measure
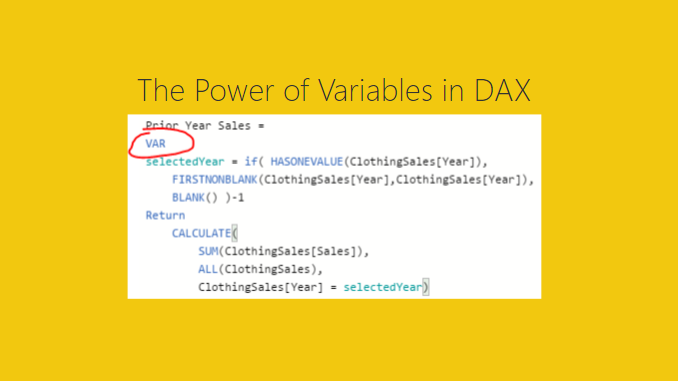
The next measure will calculate the prior year total sales, but only calculate this value when a filter context from a different visual is applied. Take note this is the magic I was talking about!!
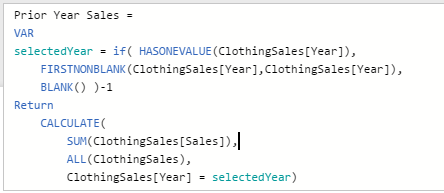
Prior Year Sales =
VAR
selectedYear = if( HASONEVALUE(ClothingSales[Year]),
    FIRSTNONBLANK(ClothingSales[Year],ClothingSales[Year]),
    BLANK() )-1
Return
    CALCULATE(
        SUM(ClothingSales[Sales]),
        ALL(ClothingSales),
        ClothingSales[Year] = selectedYear)
I am going to pause a second here and explain what is going on in this measure as we have multiple things going on. First, we are creating a variable with the VAR. In the below image I show you that the variable that we are defining is called selectedYear. SelectedYear returns a value of blank if multiple years are selected. This is accomplished by using the if statement and the HASONEVALUE() DAX formula. The Return in then allows us to output a value. In this case we are using the CALCULATE() to sum all the sales. The next part is crucial to making this work. Within the Calculate we are applying two filters. The first filter selects the entire table with the All() then we apply the filter from the earlier defined variable with the name of selectedYear.
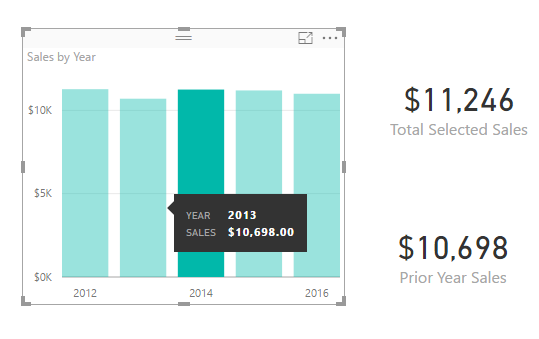
Apply the same formatting steps 2, and 3 mentioned earlier. Now, we can select one of the years within our bar chart. Doing so populates the two measures we created. The selected year total sales, and the prior year of sales. I selected the year of 2014, which has sales of $11k. Hover your mouse over the bar for year 2013 and the tool tip will appear showing a total sales of $10K.
Now we will make our percent change measure. Enter the following as a new measure:
Percent Change = DIVIDE([Total Selected Sales],[Prior Year Sales],1)-1
Pro Tip: Use the DAX function DIVIDE when dividing two numbers, this protects against odd cases where the denominator is zero.
Click on the Modeling ribbon and change the formatting of the measure to Percentage. Add a final measure that calculates the difference. See measure below:
Prior Year Delta = [Total Selected Sales] - if( [Prior Year Sales] = BLANK(), [Total Selected Sales],[Prior Year Sales])
This measure calculates the total changes in sales between the two selected years. The if statement at the end of the equation handles a special case that if you don’t have any individual year selected the prior year delta defaults to zero.
Thanks for following along an learning about variables. Trust me, these are super helpful. Make sure you spend some learning how to leverage variables in your DAX equations.
This Tutorial was inspired by the following article I found from SQLBI authored by the master of DAX Alberto Ferrari. I mean, come on, Ferrari, how baller is that last name! I guess that is why he is the master. Kudos to you Alberto!
Still need more reading about DAX, check out the following books: