The Quality Problem – Ep. 304
Mike and Tommy dig into the quality problem in analytics work — why teams keep shipping brittle solutions and how to change the incentives. They lay out practical habits for raising the end-to-end quality bar, from requirements and modeling to testing and automation.
News & Announcements
-
Fabcon Community Conference — See link for details.
-
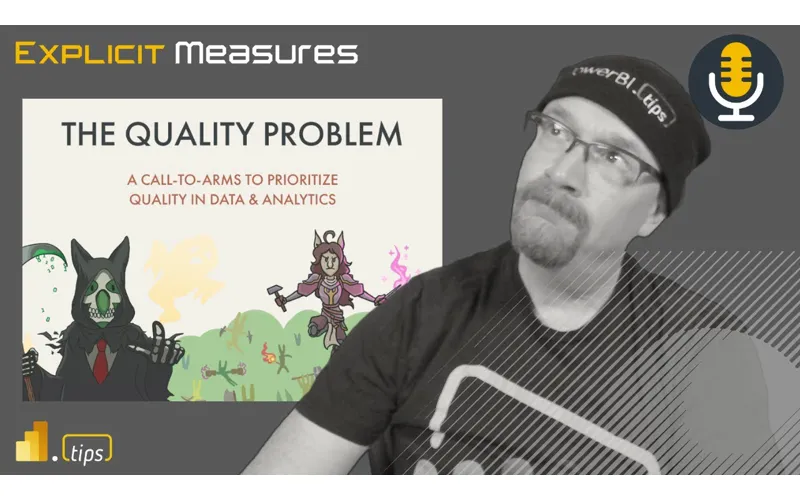
The Quality Problem: A Call-to-Arms — DATA GOBLINS — In this article, I discuss why quality is a often problem for data and analytics, and how DataOps can help.
-
PowerBI.tips Podcast — Subscribe and listen to the Explicit Measures podcast episodes and related content.
Main Discussion
This episode is a straight talk about why quality slips in BI projects (even when everyone has good intentions) and what it takes to reverse that trend. Mike and Tommy frame quality as something you design into the system — not something you add later once the visuals look good.
The Hidden Cost of Good Enough
They dig into how small shortcuts (skipping requirements, rushing modeling decisions, under-testing refresh and edge cases) compound into ongoing support load. The punchline: the team pays for low quality every single week, even if the delivery looked fast on day one.
Requirements, Standards, and Repeatability
A big theme is building repeatable practices: consistent naming, modeling conventions, code review, and a definition of done that includes validation. Quality isnt about perfection — its about reducing surprises and making the system predictable.
Testing and Automation (Yes, Even for Power BI)
Mike and Tommy talk through the kinds of testing that actually matter for Power BI and data platforms: refresh validation, data quality checks, and automating the boring-but-critical safeguards. The goal is fewer snowflake reports and more resilient solutions.
Looking Forward
They close with a mindset shift: quality is a feature, and its usually the fastest path long-term. If your organization wants to scale analytics delivery, you cant scale heroics — you scale systems, standards, and automated checks.
Episode Transcript
0:31 n good morning everyone welcome back to the explicit MERS podcast with Tommy Seth and Mike good morning everybody good morning guys I meant to do this Tuesday but I have one thing to say to you guys always blue oh my gosh found the little little toy oh it’s blue oh blue surprisingly incredibly cheap the kids actually love
1:02 incredibly cheap the kids actually love it and I didn’t know how to search for it and it was like kids toy baby toy I’m like really apparently that’s what it is so so you got to give us the background now Tommy this is this is a good intro so why why is always blue a thing and why are we raving about this toy that you just recently picked up off the internet so we were at the MVP Summit all last week yep incredible time in Seattle getting to meet I don’t know how many times they said I love your articles articles it’s nice to finally meet you to someone
1:33 it’s nice to finally meet you to someone and this is your first time to the MVP Summit right Tommy this is my first MVP Summit in person awesome so we stayed with foru Gilbert and Daniel Marsh Patrick from Vega or denb and the three of us so that was a house for of six days so Microsoft doesn’t pay for your housing just to be clear Microsoft doesn’t pay for housing when you go to these things so we had to do is we say hey we’ll just get an Airbnb and we’ll just all have a
2:04 Airbnb and we’ll just all have a place to stay so that’s kind that’s kind place to stay so that’s kind that’s why we were able to formulate a of why we were able to formulate a little group of MVPs who went to the conference so we all car pulled together Seth drove us in his nice little car and then it super fun but in the evenings go ahead Tommy start didn’t me to interrupt there no no this is this great all day you’re jam-packed sessions in with the confer but in the evenings either after dinner I think probably by Wednesday or mean I think probably by Wednesday or Thursday we were I think all of us were just done they’ve been full days and
2:36 just done they’ve been full days and like we just all needed to chill and I think someone was talking about a show I know I mentioned the first day I was on went to the Microsoft campus like oh this is where they get the idea of the show Silicon Valley from that Google and I not as bad apparently Google’s a lot worse and so I we were just talking about that I’m like we should watch it and and let’s just watch an episode because I I think some people haven’t seen it or I think Gil Gil and Daniel Daniel definitely saw it we had
3:07 Daniel Daniel definitely saw it we had some fun and we basically powered our or we went through all of the first season in like two days yeah we were we would get home to the house we would have some snacks Seth would cut up some cheese and beat things and make little platters and we’d sit there drinking wine and watching Silicon Valley and there’s a there’s a scene inside it where they have all the guys sitting around and someone has this little K kinetic toy that you throw in the air and it changes colors as it as you throw it in the air and this it’s
3:37 you throw it in the air and this it’s they kept yelling blue because it would it has blue and green on it yeah because if I throw this up it either goes to green or blue yeah and when you catch it again it turns into like it solidifies into a color yeah so everyone was yelling always blue always blue it kept throwing in the air and it kept turning BlueAnt just a chant so then the rest of the week it was like whenever we would get out of the car or we’d move between buildings it was like oh way blue oh wa it’s blue any but just one of those memories this one of the perfect memories from a conference you
4:07 perfect memories from a conference you perfect memories from a conference that’s that’s when you know that’s that’s when you have a great time a week away but no it’s been finding its value and it’s also a Marvel of innovation actually I have no idea how I do this there we go Hy Marvel’s at simple things this is this is the episode for today is it our main topic for today is going to be around data quality so as in triple IAL in typical amazing fashion data goblins pulls out an incredible article so we’re going to be reviewing the data goblins powerbi
4:38 reviewing the data goblins powerbi quality I think the name of the article is the quality problem that’s what we’re going to talk to but before we do that any other announcements before we want to jump in or any news items all right I don’t think we have anything else on the docket here the only thing I will say is NE next week I believe is the Microsoft fabricc con fabcon I think is what they’re called calling it fabric conference I believe is is the name of the conference and everyone’s invited to go so you are invited to join us at the conference I’ll be there the
5:09 conference I’ll be there the conference if you want to go get tickets it’s Azure datac com. com it starts next week I think you can still get tickets I believe but if you want to get $100 off you can use Carlo 100 to get tickets off of the event it’s in Las Vegas so go visit Azure datac com. com and you can go check out the conference happy to see you there make sure you say hi if you actually do attend all right let’s jump into our main topic here the quality problem great article I’ll put the the link here
5:39 great article I’ll put the the link here in the chat window just in case anyone wants to peruse the article as we get going here but very well written as always lots of great things to consider here there’s a couple acronyms that are presented in here some some talking around data Ops which I think is a very need topic to talk about more I don’t really feel like there’s a lot of data Ops type Solutions today currently for tab your models at this point but it seems like it’s going to become more of a topic and then also This Acronym
6:12 a topic and then also This Acronym that is the reaper acronym reliable efficient automated polished easy to use and robust we’re thinking about data quality all right jumping in what are your initial thoughts for or Tommy honestly at first I’m going to say I’m upset at Kurt because you’re upset so so let’s let’s let’s let’s just precursor Kurt is probably one of our favorite guys to to review an article or or you
6:42 review an article or or talk about what he’s thrown out know talk about what he’s thrown out into the community the man is writing blogs on Tabler editor three and he did the course and things he’s writing documentation for Microsoft and he’s listening listening to what do you want to say to Kurt what do you want yeah go ahead how come on he’s in the room Tommy yeah no I I how how how what how is he doing it all how’s he doing it all you’re upset because he’s putting
7:12 all you’re upset because he’s putting out all this content like but every he’s got his hand and everything no it’s awesome though it’s awesome though because I honestly all the Articles he does and I this is one that I don’t think about in terms of the priority on something we have to implement or or this is going to be part of our implementation planning that’s going to be high on the list like we always talk about data quality but Mike to your point there’s not really any set way and
7:43 point there’s not really any set way and we’ve had some conversations on it but they’re they’re not exactly tied to Tabler models they’re usually database data quality it’s very old school it’s like getting your computer right but you’re working on Doss it doesn’t work for the infrastructure that we have now so I love that not just there’s an article out there but how in depth this is because like where can we start as as
8:15 because like where can we start as as Team business intelligence teams from whether it’s it’s a small or Enterprise in terms of getting started on a process and a methodology to say hey we’re going to evaluate and see how successful we are on our data quality issues so I I love this article and I’m glad that it’s something that maybe we talk about more so I guess where my mind initially went on this article was say look at the article and I thought I read through it I thinking to myself how does this
8:46 I thinking to myself how does this relate to organizations and what data quality things that are popping out from different teams across the company and the reason I’m the reason I’m bringing that this up is because I was I’m thinking about this going I I’ve had a number of times where I’m working in data analytics I’m I’m being asked to produce some numbers and the boss comes down to a person or a team member and says I need information about this we’re going to make decisions on things and it feels like in some cases sometimes these really large decisions are being made by trusting
9:16 decisions are being made by trusting someone to go into the data manipulate it produce their analysis and then kind it produce their analysis and then explain have that user present the of explain have that user present the explanation of their data here’s where we’re at here’s the analysis I went through here’s the here’s where I got to the answer and so I had a number of kind the answer and so I had a number of like meetings where we’re deep diving into challenges why things were up why things were down trying to figure out on reason through the explanation and we would put multiple team members on it and potentially we bring in a black belt and they would statistically walk through some stuff we had some pretty detailed conversations around all
9:47 pretty detailed conversations around all this but things that were not considered in those conversations was the quality of the day that was given to you you assumed here’s what is given and so and I don’t I don’t know how to articulate this way leadership trusts certain people to do analytical things they show up with a problem you’re given some data and then you walk through the analysis and out pops the answer and then everyone trusts it that that there’s trust in it someone’s looked at it and you move on
10:17 someone’s looked at it and you move on that’s should be no different when you’re building a semantic model or other things and so there’s another trust thing here and like if it’s coming out of these other automated systems it feels like there’s a bit less Trust I don’t know any I’m not sure if this is actually a real thought or just maybe just random pieces I’m putting together here but I also want to think about like where people are coming from I think a lot of the powerbi space comes from business users who had to just figure out problems solve them use the data they had and do the best with they what
10:48 they had and do the best with they what they what they had been given to them I’m not necessarily sure that’s the first thing you think of when you do that is quality how do I know this is quality data how do I know that I didn’t screw up an Excel file formula I think it’s just an accepted way of doing business to some degree and maybe now what we’re seeing is the introduction of data Ops these other Concepts that seems a bit more of an it-centric way of thinking you’re you’re poking on something here so and I want to I
11:18 something here so and I want to I want to I to lean into what you said right because businesses everybody in business is operating on this this wavelength that trust is you this wavelength that trust is all the reporting done is you know all the reporting done is you know all the reporting done is manually is is trustworthy and this know manually is is trustworthy and this is how we’re making decisions and then all of a sudden when we get over to reporting it it can be scrutinized right it’s and if there are trust problems then we have a big big deal I’m going to
11:49 then we have a big big deal I’m going to challenge that idea because what I see is that more often than not when anyone in the business business is manually putting together numbers innate trust is given to that person and the numbers because nobody can validate it and and frankly I’ve seen also like being part of those processes one you realize a ton
12:20 of those processes one you realize a ton of them are hey we were doing this matching exercise and only 60% of the matches that we found and now that is 100% of our conversation so everybody assumes that that’s in totality all of the information that we need and it’s not you’re you only have 60% of it and whatever actions we’re taking are only on 60% of that but nobody Downstream knows I think that’s the value though of data not manipulated
12:50 the value though of data not manipulated like by a person or one off whatever is understood like transforms understood full data sets that can validate the reports that are put out there and that’s what teams of people that you’re using reporting tools can do where it’s not behind the scenes and what I what I do want to say is I I’ve Kurt is probably one of the most polished and well-written writer writers
13:21 polished and well-written writer writers of Articles out there and very comprehensive in this one I swear I pick up like a lot of frustration in other in parts of the article but it’s it’s still well polished still well written but just on the edges all a sudden I was like man Kurt is really pissed off about some of this stuff which as we talk about it these are like and I don’t want to derail because eventually like he’s got some great points Mike that you point out with Reaper and devops as far as like how we fix these things but we could definitely wallow for the next you
13:51 could definitely wallow for the next you could definitely wallow for the next 30 minutes on the frustrations that know 30 minutes on the frustrations that we have around different aspects of where where this concept an push towards give me something quick is is where a lot of businesses live all the time because you need the answer you need the answer you need the answer so you can see how this is driving a culture of people are good enough right it’s good enough metrics to get out the door and that’s not good enough for us it shouldn’t be and I
14:21 enough for us it shouldn’t be and I think the point of this article is we who have access to the tool sets that can teach people that can build these foundations have a responsibility to lean into quality and that’s where I I love the full scope of this article and everybody listening should go read it in detail because we’re only going to touch the periphery and the edges of this but it is so imper it’s imperative for us to focus on quality as we go and he outlines a bunch of
14:53 we go and he outlines a bunch of different ways why driving for quickness and ignoring quality causes issues and just the two that resonate off the top of head or for me we like that it it automatically in some way shape or form is going to drive dissatisfaction whether that’s in how you use the report or the data but it is it’s a death by a Thousand Cuts and and believing that what like developing a report is easy and it should be just fast and and it’s not it’s not easy just because we have
15:23 not it’s not easy just because we have tool sets now that can produce a an insight for you quicker than we were that doesn’t mean that work isn’t behind that that we still need to do right it’s like this either you get it in three weeks when I do the full cycle of all of the work that’s going to live on or I can give you something after a week and a half but I still have a week and a half of work to do so just some initial thoughts around
15:53 do so just some initial thoughts around like the article already got early this morning too we’re not even at 35 your audio just went really awful yeah you you robot all right well we’ll move on let you fix your audio there so also another part of the article so I like the very beginning of the article where Kurt actually did say prioritizing quality is not the same as pursuing Perfection and I do think I’ve seen this a number of times where organizations
16:23 a number of times where organizations get hung up on a couple things that Mis lead them a little bit in a direction particularly around around okay we have 10, 000 records that don’t match we have missing data okay is that 10, 000 records out of 50, 000 records total so like 25 20% or is that 10, 000 records out of a couple million right so sometimes I think people also lose to your point SE sometimes people get hung up on some of the details of things as opposed to okay you’re missing you’re
16:53 opposed to okay you’re missing you’re missing some things sometimes perspective is required yeah that we’re missing some data or some things are not cleaned up 100% is that enough to really throw the needle One Way direction or another and sometimes the answer is no but it really comes down to a matter of perspective sometimes we overemphasize things that are such the the impact is so meaningless and the the reality is it’s it’s just noise in the system and so I think I think it’s a good note here
17:23 so I think I think it’s a good note here is when you’re talking about quality just remember it’s not the same as Perfection and you have to be evaluate how much time you feel like you really need in order to clean provide that high level data quality because I’ve always said it’s like a it’s like a a curve that never gets there right you you can get closer to 100% data quality but in doing that you’re going to spend more money it it corresponds that’s thing that’s that’s yeah no Tommy it’s still Robot Man Tommy’s Tommy’s just going to
17:56 Robot Man Tommy’s Tommy’s just going to be a pretty face if he doesn’t fix his mic here I I think one one of the one of the points he’s got a ton of these cool drop downs that he does that dive into different areas but before we focus on like the purpose of his article there was one point I think in I’m just trying to find it real quick I think it’s a battle plan a battle to make a good plan yeah his last bullet point really resonates right and he says we battle to show an Roi when we focus on outputs instead of outcomes
18:28 focus on outputs instead of outcomes measured the right way steering us to build things that don’t help us achieve our objectives and Advance progress to our goals and this one I think resonates with me because we talk about a lot about okrs right object companies having objectives and something all of us can point to not only in where our work capacity is going towards solving the problem and that’s how the company says these are our big problems all the
19:00 says these are our big problems all the way down the the pipeline but and and how important that is because otherwise everybody’s just like this is the most important thing this is the most important thing and then and then reporting teams or people who can bring forth Data Insights are struggling with like yeah well we gave you all that but didn’t move any needle and I I I don’t know the answer to this question right I agree with the first part of this where I I still have a hard time
19:30 a hard time myself understanding how do you articulate or track the value the actual value of what we’re building because the output being the report report provides the like the meat that everybody feeds off of right to go make decisions right that it’s it’s a it’s a a an a an accelerator for the business and huge things can happen out of out of just this output and if
20:04 out of out of just this output and if there was a way for business intelligence teams and maybe it’s through usage right but like think about think about the the two big needles right either you’re making money or saving money and reports can showcase a lot of those two different things to re like and users that through analysis they they find discoveries of oh my God gosh we can save thousands and thousands of dollars here or we’re going to go make a million dollar deal because I can see that we
20:35 dollar deal because I can see that we can sell this person this and this and this and this and it happens well the value of what we created was a net net like multi-millions of dollars or multi hundreds of thousands in Savings in either direction and man that point just struck me struck me because when when I can do that efficiently that’ll be my longest blog article ever yeah agree on that one all right Tommy let’s do another mic check hello testing
21:06 let’s do another mic check hello testing nope it’s not working it still sounds grey yeah yeah it sounds grainy all right Tommy go restart your computer we we’ll we’ll catch you back see back see you all right we let Tommy go restart his computer figure it Mike it worked it worked it worked we we told him we got rid of him yeah just like that exited on the show mark it down what was the day Tommy got kicked off the podcast it was episode 304 I’m just
21:35 the podcast it was episode 304 I’m just kidding I do want to transition to another another Point here so I really lik Kurt’s diagram so there’s a lot of so one of the things that Kurt does very well in the article that I really enjoy is there’s always like an an an infographic a picture or something that depicts and it’s like multiple levels of depth that going on here so one of the one of the images that he put out here that I thought was very useful and I think is a great way of communicating one of the points here is quality is always important it’s about a little bit more than halfway down the article and
22:06 more than halfway down the article and it’s a picture of a it’s it’s a curve it’s a growing curve like an exponential curve going on here and it’s an x-axis and y- axis on a curve the quality is on the y-axis so higher quality data and then across the xaxis is the importance in your decision- making like for example what color shirt should I wear today probably not as an important of a decision but deciding on how many more employees should we hire or let go much
22:36 employees should we hire or let go much more impactful to the business and long-term vision of the company or what should we report out to our shareholders about revenue and investments in the company right those decision points are extremely important and need to be very highly data should needs to be very high quality to support those decisions or support that analysis so in the image he has like the Prototype is like a angle the POC is like four-sided diamond and then it’s like a pentagon and a hexagon and then he adds so what he’s doing is he’s adding more in
23:08 he’s adding more in in this prototype thing he’s saying look initially your your data quality might not be very high as you’re as you’re starting out the project or whatever the item is but as you increasingly if you add the importance or if you have a higher important decision meaning it’s has a higher importance at the end you need great quality data to make those High important decisions and I think this is just again a really well articulated visual where I saw multiple things happening where I really like the fact
23:40 happening where I really like the fact that he had a triangle going into like a circle by adding more quality to it and the quality of that shape was increasing eventually becoming a wheel that he could use on a cart I I just felt like the the analogy there was very well done I like yeah that is true you’re adding more resolution more validity to the quality of that data so you can get really full picture and your initial designs of a process or project may not be very may not have very much quality in the beginning but be mindful that if that if that project
24:10 be mindful that if that if that project will eventually need to make smart decisions okay yeah then then you need to spend time increasing the quality of the thing and and quality is I don’t think it’s a destination I think it’s more of like it’s I don’t know how you how you would say it’s it’s not a destination it’s more like a direction on the compass right you just you align yourself to the direction you head the direction you may not ever get there but at least you have a well to use Microsoft’s term you have the North Star you’re trying to head towards right you you’re trying to head towards right directionally where you’re trying
24:40 know directionally where you’re trying to get to I’m glad I’m glad you pointed this out because it reminds me of a very similar similar description that a a very good smart friend of mine laid out and I didn’t even notice this at first Mike so thanks for pointing it out is is the shape change right yeah from triangle to you change right yeah from triangle to Square to rhus whatever a triangle know Square to rhus whatever a triangle would not work well as a wheel on a car it just I I would I would actually change this visual to be like
25:12 change this visual to be like a a wave a trough right because be and the reason is is because as it was described this scenario by my friend is we we get value out of prototypes and poc’s and quick winds and the reason is is because we’re actually on the downhill we don’t have anything right so it’s like hey we can push this thing off the hill and actually get a little bit of value out of it but all of
25:43 little bit of value out of it but all of the sudden if it’s still a triangle or a square as as you begin to Plateau right and we’re off that curve of like pushing this object down into the surface area of business value that object stops it either stops or slows down right so if we’re not creating the right type of object to move forward what happens is when you want that object to be of higher quality
26:14 want that object to be of higher quality or like have to start pushing it up the other side of importance of or value to the business you need it to be a circle otherwise it’s going to take longer and longer and longer to actually sh shape that object to the point where you can get it to the top does that make sense so it’s like you can push it off and it and you get a little value but you can’t push it far until it’s in a form that allows you to climb the hill which is the other side of things anyway
26:46 which is the other side of things anyway I don’t know if it’s like directly you I don’t know if it’s like directly aligned with this but it it strikes know aligned with this but it it strikes me as like that object change of like no there’s there is value but you’re not doing a ton with it and then all of a sudden when it accelerates if it’s left in that bad shaped form it’s going to be it’s a huge pain to push it up so if there’s no quality or like it’s fine if it’s like the one person or two people that know about all the inefficiencies or deficiencies in the data because they can they can still sus
27:16 data because they can they can still sus out some particular value from it yeah but if you all of the sudden share it to 100 users they don’t know all that right so now all of a sudden you’re it’s very disruptive what do you have to go do to fix it etc etc etc in in terms of like like that pivot or curve up I think is where the tech debt or the things not built right or all the skipping of things that happen start to become really really visible and he points that out later in the article
27:46 points that out later in the article where the analogy still aligns certainly because the breakdowns the bugs where does all your time go from feature development and Innovation to bug fixing and upset people it goes there really fast yeah I liked your analogy I liked you when you were thinking about the tech debt because this a portion of data quality is a certain amount of tech debt that goes along with it as well all right Tommy is back on let’s give another check here Tommy see if he works
28:16 another check here Tommy see if he works here I think Microsoft knows oh it’s working hey Tommy they they’ve been controlling because they know I’m going to say to say oh nope just went Rob body again and maybe is your internet speed down no wa I have wa I have idea no I can’t hear you connections connections all right anyway so purpose like you we we jumped down I
28:44 purpose like you we we jumped down I think into the quality I just want to reiterate the three points that he calls out as far as the purpose of the overall article he wants to describe the elements of quality Data Solutions with the acronym Reaper Mike you already you already interjected that emphasize that quality is about more than just data it’s about both continuous endtoend analytics and I love this point because it it leans into the point that we’re not just talking about the technical artifact of the report that we’re deploying right we’re talking about the
29:14 deploying right we’re talking about the end to end how does data come in where does it come from are we testing that what is the output of that continuously and that I think is somewhat different than a lot of other applications because it’s like it’s going to behave this way with the things no matter what and with data like you could have the full solution and then all of a sudden one day it like it completely breaks right because there was a data piece there was one value that didn’t conform to something and it broke a relationship we all know that one and then to
29:44 all know that one and then to introduce data Ops and how data Ops can improve the overall quality so I I wanted to dive in a little bit more here on data Ops because I think that data Ops is is a is a great concept to think about implementing it feels to me to be much harder to implement than just you much harder to implement than just I I get the gist of it right you know I I get the gist of it right you know I I get the gist of it right let let me give you some picture know let let me give you some picture here right working with some other MVPs they have been doing some more things around data Ops in general but this there’s this concept of okay every time I every time I deploy a data model right so I
30:15 time I deploy a data model right so I have different workspaces I have a deployment pipeline maybe I’m doing Dev test and production right and so as I go through these different environments I’m actually interested in making sure that any change I make to measures or loading of data there’s two there’s kind of data there’s two there’s two aspects of a model if I change a of two aspects of a model if I change a measure or change the logic on how tables are being built I could influence the data that’s inside a table and so you could also have an issue with the loading of data or where the data comes from in the source system so when I look
30:45 from in the source system so when I look at this data Ops process I really like it because the idea of I make a model I generate some tables that I know is should be consistent and I should be able to deploy it to Dev test the data here’s here’s the same and my analogy is like look I’m looking for monthly total sales right and I’m looking from January or I pick a certain amount of months that I know the numbers are and then the next time I do a deployment I check those same numbers the next time I do deployment I check those same
31:16 I do deployment I check those same numbers so in the article and this is something that I I don’t think many people understand or have heard before there’s this concept of a check sum a check sum is basically aggregating a bunch of St together and getting like a single value that describes a lot of information when you do software development you would you would deploy an MSI file or deploy an an executable for someone’s computer and what you would typically provide is a check sum of that because that then says
31:46 check sum of that because that then says the the binary the bits have not been tampered with and therefore the file you got is the same check sum as the person who produced it so this is the same kind who produced it so this is the same concept in data op of concept in data op where I can say I will produce the same table at the end of every development cycle and I will check the numbers to make sure the numbers are correct every single time so yeah that was that’s another another great and that’s yeah and Greg you Greg you point out a great question here check sum is a feature
32:18 question here check sum is a feature that I found when I was inside the accounting World Finance world does this all the time and especially inside their Excel documents so what they’ll do is they’ll they’ll let’s imagine you’re you’re bringing all the data in for an analysis and you’re trying to account for all the dollars so you’re split the money apart you have a lot of grouping there’s a lot of and so you’re going to have this at the beginning of your process you’re going to count all the numbers and add a single total at the end you’re going to go through all the the calculations the splitting the the dividing whatever you want to do
32:49 the the dividing whatever you want to do and at the end of the process you add up all the numbers and it should be still zero so that way you have no issues with the data and you can verify okay if the number is you have a you have a metered way a single number to look at that says yes we are 100% on track for those numbers yep right on so one of the hi hi
33:23 Tommy Tommy technology to this is not a great start to the day but all right it’s a great start for me but welcome back to the conversation so you let Tommy say something on the podcast like so there might be like another point there maybe said react to that one we’ll give Tommy it’s final note here because we’re actually got to end here a little bit early for people on the podcast no I I agree with the the check some validation and that’s part of the data Ops process right where yeah you can interject data quality checks or the automation around like hey I I’m going
33:54 automation around like hey I I’m going to do a row count on this or I’m going to look he points out I I’m going to do like this sales value should be the same yes all the time for this month and if it deviates oh I got a problem and I gotta go look at something so I 100% agree with you I think what I did want to lean into is his his Reaper concept here is is is great but the the meaning behind it right is the r is reliable related to like the data results e is efficient so good processes behind everything A is for automated P
34:26 behind everything A is for automated P is for polished around like organized reusable objects or processes easy to use Simple e and then R is handle new data changes be be a robust solution that you’re not having to constantly rebuild or recal all the time so all within that there are a lot of dangers and things but Tommy any thoughts from you I have I have one more section I want to point out but you’ve been you I want to point out but you’ve been dealing with your know dealing with your technology problems this morning but
34:56 technology problems this morning but I’ve had so many things I wanted to sa today I’ll be you got you’ve got a little bit of time to say them so think your thoughts and get them together let’s do it yeah let’s go so I’ll be incredibly brief we have the world we’re CH living in right now is I think really change because of fabric because the elephant in the room is powerbi is not great for data quality checks it’s not made for it it’s an analytical solution because just how we actually
35:26 solution because just how we actually look at data data quality does not work great when it comes when you’re dealing with Filter context usually working when it comes to static data really from more in the line of data engineering going through the workflow to iterate just like what is it Epic Journey or Incredible Journey the the tooling out there Great Expectations is thing Great Expectations Great Expectations to yeah and we’ve never had the tool that and the reason why I feel very confident
35:56 the reason why I feel very confident saying that it’s because no one has really wrote written about or provided any samples on data quality when what I’m assuming you guys said is data quality is pretty important and the fact that we don’t have any resources Microsoft has no documentation on that particular issue powerbi wasn’t made for that but guess what we can solve that in fabric because it’s more of a tooling the way that actually the data is coming in powerbi is made for from the
36:27 in powerbi is made for from the Towler point of view which is difficult so I think we’re actually getting to a point now where hopefully we can get Solutions utilizing Microsoft fabric I really wish we had more time to talk because I don’t agree with that at all I don’t agree with it either I I understand your point Tommy but like I understand what you’re going from but like if you look at if you look at powerbi and you look at like any other tooling that we have like what does data bricks give you that does data quality yeah you have some things called assertions on table that adds a little
36:58 assertions on table that adds a little bit of data quality you can kick out some bad data what does SQL Server give you with data quality there are some things in there but like you have to build all this stuff in every tool build it but that’s my point my point is you’re expecting powerbi to do data quality it doesn’t and the tooling is not going to ever give you no tooling is ever going to give you like better improvements on data quality now different tools potentially will supply you with checks and balances and so you you with checks and balances and so we’ll kick out bad data or will
37:28 know we’ll kick out bad data or will refuse bad data because of certain criteria set up in front like I’m thinking like data verse if you try to write data into a dataverse table that has the wrong data type it will say fail and it won’t let you put it in there so that is some very basic level of data quality but to what we’re talking about in this article like being able to like run a test like and again later on the article it talks about you later on the article it talks about it’s data Ops is data quality know it’s data Ops is data quality written as code it’s a code first lens of how you write a equality now I will
37:59 of how you write a equality now I will agree with your point Tommy that fabric does give us capability to now write code based solutions that can check things but to anyone’s Point here like it’s none of this is developed it’s all still whatever you want to do and so it’s really going to be a culture portion this is a people and process thing how do you prioritize quality and what do you do to make it happen all right with that any final thoughts we probably should run through final thoughts here I I have to be brief which pains me
38:31 here I I have to be brief which pains me because I think right at the end of the article there’s a a two four six five different bullets that all fall under a a header of so far these may all seem like obvious topics we all know this right and yet quality is a problem in data and analytics that many teams struggle to address and I want to stress that like every one of those bullets by teams struck me as something that isn’t just data bi teams it’s data in general in organizations so this like alludes
39:02 in organizations so this like alludes and the one example I’ll have is an absence of standard in processes result in redundant effort data and code throughout the solution life cycle that’s very true for us as we develop ETL Solutions and reports but it also happens in the business and with teams all the time people are duplicating work they’re like we have the the thing that everybody is working on but in slightly different ways so there’s a bunch of these different correlations that I had the last point I’ll make is this creating a data Foundation is why like
39:32 creating a data Foundation is why like Kurt is is writing this article everything about it in terms of quality because we’re building the foundations that can last that are trustworthy that businesses can leverage and be confident in what’s terrifying to me is this is still a convers not terrifying this is still a conversation and it’s been a conversation for many many years and the cautionary thing that goes off in my mind is that there is a buzzword called AI right now that every business is investing a lot of dollars into and if
40:05 investing a lot of dollars into and if you don’t have a foundation be ready to have conversations that that you should really grock this article and talk about all of the things that have to be in place before you have anything really working well in an llm or an AI generated model in the future because it all starts with quality Foundation data you can’t skip this one I like Kurt Kurt likes your comment you’re right on target I think I I think saw that come through in the comments so Tommy any
40:36 through in the comments so Tommy any final thoughts on this article honestly I to set point guess what AI runs on his data I think hopefully we start seeing Solutions I I think as fabric really becomes more mainstream and there’s more adoption it’s it’s a perfect tool again to have to have the being able to write the test and be a lot more custom than we could be in a tool just like powerbi for just from a reporting or modeling point of view we
41:07 reporting or modeling point of view we could check more Upstream because the last thing my real final point is data quality is never a single day issue it’s a gradual climb of bad processes bad input and it happens slowly until you realize man my basement’s much more messier than I thought but it happens what quality Quality quality processes standardization I said or your mic doesn’t work or or or your mic doesn’t work so all right with that I
41:39 doesn’t work so all right with that I say thank you very much for listening today this is a great article I think this is really good data quality is definitely a problem we should all be thinking through we really appreciate your listenership on this episode we would love it for you to recommend this to somebody else if you found some value in the data quality conversation it sounds like we need another topic around this one we might have to come back and revisit this article after we get all our technical issues worked out here thank you very much we appreciate your time and Tommy where else can you find the podcast you can find us on Apple Spotify really wherever you get your podcast make sure to subscribe and leave a rating it help helps us out a
42:09 leave a rating it help helps us out a ton do you have a question idea or a topic that you want us to talk about a future episode head over to powerbi tips podcast leave your name in a great question we’ve had a ton of mailbags lately but no names and we’ve been using a lot of them so we we want to mention you join us live every Tuesday and Thursday a. m. or at least two of us and join the conversation live on all powerbi tips social media channels awesome and thank you very much we appreciate it and we’ll see you next
43:05 [Music] a
Thank You
Want to catch us live? Join every Tuesday and Thursday at 7:30 AM Central on YouTube and LinkedIn.
Got a question? Head to powerbi.tips/empodcast and submit your topic ideas.
Listen on Spotify, Apple Podcasts, or wherever you get your podcasts.