The 3-30-300 Rule – Ep. 337
Mike and Tommy cover Microsoft Fabric GitHub integration news and share practical lessons learned from working with deployment pipelines.
News & Announcements
-
Announcing GitHub integration for source control (Preview) | Microsoft Fabric Blog | Microsoft Fabric — GitHub and GitHub Enterprise are now available for source control integration. Connect your workspace and you can start syncing your fabric content into your repository.
-
Git - REST API (Core) | Microsoft Learn — Learn more about [Core Git Operations]. How to [Commit To Git,Connect,Disconnect,Get Connection,Get My Git Credentials,Get Status,Initialize Connection,Update F
-
PowerBI.tips Podcast — Subscribe and listen to the Explicit Measures podcast episodes and related content.
-
Power BI Theme Generator — Create and download Power BI report themes using the PowerBI.tips theme generator.
Main Discussion
The core of the episode is a breakdown of SQLBI’s “3-30-300” rule — a simple way to think about the time windows that matter for report usability and performance. Mike and Tommy talk through how the rule influences report layout decisions, where to spend optimization effort, and how to avoid building reports that look good but feel slow or confusing.
Along the way, they touch on practical delivery lessons (including deployment pipeline realities) and the importance of setting expectations: not every report needs to be perfect, but the important ones should be predictable, readable, and fast enough for the way the business consumes them.
Looking Forward
A good next step is to choose one idea from the discussion and apply it to a current report or model—and make sure you write down what changed (and what didn’t) so the lesson sticks before scaling.
Episode Transcript
0:18 you [Music] good morning and welcome to the explicit MERS podcast with Tommy Seth and Mike good morning everyone good morning gentlemen and happy Tuesday to you happy Tuesday yeah good morning we the week has started in in
0:49 the week has started in in full that it has Tommy’s gotten start yesterday had some crazy weather last night so hence why we’re we’re a little running a little late today and I’m amazed that some of some of us I’m not going to say who don’t adhere to policies around what you should do around okay come on you’ve been in this podcast long enough Tommy who’s the one who’s gonna follow the rules Seth and Tommy who’s the one who’s not GNA follow the rules I’m gonna follow the don’t die rules really the it’s Tommy it’s just
1:20 rules really the it’s Tommy it’s just the difference between the folks that stand right at their front door and videotape the tornado coming towards them and the folks that are in the basement true I don’t really I don’t video it so so give you some context here what we talking about talking about before the call started here before we started doing the explicit meur podcast Tommy was like hey sorry I’m a little tired I was up and down a lot last night the the tornado warnings were happening and so I was up and down and waking up and going to the basement and coming up because the warnings were happening and I was like you go downstairs for the basement for
1:51 you go downstairs for the basement for warnings like I wait till it starts ripping trees out of the ground siren wait until the sirens so I wait till I hear the freight train exactly sound of the I wait till the refrigerator goes right through the window exactly then I know it’s time to go downstairs it’s breaking so I like I don’t really I we don’t usually go downstairs maybe we’ll pay attention like when the when the sirens go on that’s when the phones go on I put my phone on I’ll I’ll look very intently on the phone but I I don’t
2:21 intently on the phone but I I don’t we haven’t we don’t really run to the basement every single time so anyways you’re you’re you’re amazing me with that because I I just think I don’t know it’s a tornado it’s like and then your kids wake up your phone goes off like all the things are happening even if the tornado doesn’t H come that’s what I’m saying if it if it was coming there would be like there’s definitely something on Twitter that’s going to show you people things are going to be flying around so check out that a little bit and Twitter I’ll go to the naal last thing I want to look
2:53 the naal last thing I want to look before I die is not Twitter every other day in here we get a a warning from wallworth county has more tornadoes wallworth County County every County that’s the county not to live in here in our area for whatever reason every storm that comes through they have a tornado it’s like a given so I don’t live in wellworth County so we’re good we’re safe safe [Laughter] okay all that’s all that’s tongue and cheek too as well so jumping into some that’s our our in here our main article today is talking about an article by SE sqlbi which I thought was
3:23 article by SE sqlbi which I thought was very relevant it’s the 33300 rule so it gives you a little bit more a 330 300 rle and Kurt ber who is now I believe is hired by U sqlbi to write some more articles is doing an amazing job building incredible Graphics really good reports and just really articulating some very solid points here that I’d like to walk through and think through how do we utilize this pattern to help us think more deeply about what we’re building on our reports
3:53 about what we’re building on our reports so that that I think is very relevant here and another again talking point around building great visualization things the Articles as always are in the link in the description below so you want to see the full articles and links that’ll be in description below with that let’s jump into the news I’m very excited about some things here and I’m going to throw this out here to the world and we’ll see what people say I’m a very excited about the GitHub integration so one thing that Microsoft has been working on a lot recently
4:23 has been working on a lot recently was hey we want we want to give you a better way of controlling the versions of your reports how does a team work together how can you edit a portion of a report and merge it with other people’s changes there’s really no collaboration on these U multiple artifacts here how do I edit a santic model and make sure that the changes aren’t breaking things so with this Microsoft has been hardening the report side formatting called The pbip Format and with that we’ve been getting a whole bunch of really interesting changes and now when you publish things to the service powerbi. com you now can use GitHub so
4:56 powerbi. com you now can use GitHub so before you could only use Azure devops and GitHub is also included initial thoughts and reactions I love this feature I think this is the way to go if we were a radio show and we had special sound effects this is when you would hear the Applause celebration music the like the horse going down the road and everyone cheering exactly thing whatever whatever that sound effect calls for this is that time for me this is really I think important because I I
5:27 is really I think important because I I think we’ve talked about this before get is hard enough and then if anyone’s usually getting get out of here get out of here yeah that’s people usually say when they see it they’re like what is this get out here but and then you have to now also learn devops and get started with devops which I would I would challenge is also on top of just learning and get something else that’s also very foreign especially because most people are starting with GitHub this is making it this is going to make
5:58 this is making it this is going to make it a lot easier easier and the barrier to entry a lot lower for most people out there and then for a lot of us I’m a gith heavy person I’m a gith heavy person especially with GitHub devops is fine and obvious have we’ve made it work in a lot of situations you’ve used it yep but it’s not my Choice it’s not your first your first choice right kind your first your first choice right thing because of how much I used to of thing because of how much I used to get help with everything else so this is
6:28 get help with everything else so this is a major deal so there’s some really interesting patterns that are starting to evolve and we had some questions come along our radar and this is also probably coming a little bit around the Beat from the street as well I’m going to bleed into that a little bit but there’s a lot of interesting patterns you can use with Azure devops and GitHub and just to be clear it’s not difficult to use them it’s more of like can you set them up initially correctly and then once they’re set up you don’t have to go into the tools again you can basically St you can live your entire life inside
6:58 can live your entire life inside powerbi. com check things in and make changes there so you can if you need a pure simple way of backing up your artifacts or backing up things and going straight to get without having to have SharePoint or other things as well you can just use these things these tools are there they exist you can just work normally like your normal workflow would be and you can check things in so I really like that part but I’m also finding now that when you’re are using a team of people we have this concept of the people who are developing the reports and the models and the other artifacts
7:28 and the models and the other artifacts data engineers data scientist they’re doing things in the workspace potentially there’s someone here that is doing the release management they’re the individual that’s in charge or a Persona that’s in charge of taking things from Dev to test to production and what we’re finding is inside as your devops and inside GitHub you can protect certain things for example you can require that no one can make any changes until they have a minimum of two reviewers on a
7:58 have a minimum of two reviewers on a pull request which means that’s basically a merge of some information back into a main branch this is really interesting because it really has changed a lot of like the best practices that you could use for reviewing and getting reports out the door so it’s it’s quite interesting to see how diverse and how much more control we potentially have as a team that could be impacted by this so I’m really excited about that actually in my
8:28 excited about that actually in my opinion well I think there’s going to be some of the open source Community thing too because you’re right there’s a lot to your point there’s a lot of methods and approaches it’s like process there’s a lot more process you can there’s a lot more processes but because you want you’d want to say like look I don’t want Tommy just checking code in whenever he wants I want someone to look at it so like we want a Seth to review the code before it goes back into a branch well now you can enforce that it can be required well you could have done that with devops too yes I’m not saying but I’m just saying like I’m
8:59 not saying but I’m just saying like I’m exploring the idea of like development pipelines I’m exploring the idea of all these other tools I see and so like sure before it was just hey look I can check in the code now it’s like what does my process look like to check in the code is there more to is there more to this that I didn’t see before and so now I’m getting like deeper questions around companies that are like organizations that say look we don’t want to break things we need people to review things this is going to be part of our process what can devops or GitHub help us to do those things so there’s all these extra
9:29 those things so there’s all these extra things are coming along with this as well well and also now that from the open source point of view I I have this feeling you’re going to see a lot of this sharing where hey Mike I have these few reports I’ve been working on it’s a public git repo go ahead and clone it or Fork it add that to your workspace and all of a sudden it’s done so we have a lot more of the open source part here that I’m also really excited about yeah so that’s a really interesting thing there devop thing which is very interesting say you’re talking about
10:00 interesting say you’re talking about this devops thing here with the pipelines I’m I’m a little intrigued yeah it doesn’t it doesn’t actually believe it or not it doesn’t only exist in devops GitHub also has a series of additional items and elements that you can also use inside GitHub so there’s almost the same features you can use in Azure devops are the same features that can be utilized in GitHub
10:18 features that can be utilized in GitHub you can require there’s more than one reviewer you can you can protect a main branch of a of a code Library so that way people can’t just check things in it has to go through a review a reviewing system there’s a whole bunch of other things you can have automated test running yeah so a lot of this is really interesting because I haven’t seen a lot of the community yet producing a lot of comments or IP around or or code around how do I automatically test these models or reports using these pipelines John kky is one of the ones that I know
10:49 John kky is one of the ones that I know that is doing a ton of this so very excited to see where John’s going to take some of this stuff to your point Tommy I’m much more of a GitHub fan it seems a much more lightweight than the Azure Devon it’s a little simpler for a management of users and permissions and things as well so I’m very excited to really dive deeper into GitHub and feel like that’s the right approach for a lot of organizations because they’re all pretty much GitHub based companies works a lot better with vs code too again not everyone’s a vs code person here we know that however I’m
11:19 person here we know that however I’m with you on that one as well yeah totally makes sense the last thing I’ll point out here from this blog article that I’m very excited about is the very end there is a couple little tags here you there’s a little phrase here that says working with GitHub and fabric beyond the different authentication required working with GitHub will have similar functionality that is available today we’re working in git integration with fabric you’ll be able to prompt user for changes you’ll commit and update using Source control pane you’ll see the branching out you’ll have be
11:49 see the branching out you’ll have be able to switch for branchings you’ll be able to switch branches as well and then finally you’ll be able to use the fabric git apis will become available in the next few weeks for GitHub users as well and this is really interesting to me because this is where we need this is what we needed we need code to help us produce the process that we’re trying to build here commit to get connect get connection get status initialize connection update from get these are standard connections that we need or API
12:20 standard connections that we need or API calls that we need to go talk to par. com so again also excited that there’s now a whole git layer of apis that we’re going to be able to look at and use that’ll help us interact with this service as well so very excited about that as well my last nerdy thing here is you can also now use the git obviously the GitHub API which has its own GitHub co-pilot command line tool where if you’re like hey I don’t know how to do something but I know I need to do it and I’m on the terminal yes you can go you can ask your
12:51 terminal yes you can go you can ask your terminal and say hey clone this repo or Fork this repo of mine done so completed yeah so that that’s the stuff that where I like that stuff yeah all right I don’t have any other really major announcements any other announcements Tommy set that you found that came out on the blog or anything else you want to pick up on nope I think there was something else on something just got released today let me just double check real quick here blog. fabric something else came out I didn’t
13:21 fabric something else came out I didn’t have a chance to look at it fabric data pipelines Advanced scheduling techniques part two like a little bit of a a detail on how to more advanced schedule your items I do think this is very relevant honestly I I have run into some errors or some issues where I want to run a pipeline once a month once a week a specific day of the week those things as well so just check out the blog this is a really interesting article I do think this is there’s a you can use Dynamic
13:52 there’s a you can use Dynamic conditions for an if condition on an activity so they’re they’re giving you some more capabilities now to give you a bit more color or or context around how you want to run your pipelines anyways I found this article interesting super technical just be aware there’s a lot of code in there and if you’re not heavily using pipelines this may not be as relevant for you but I I did find this interesting and this is a challenge that I have seen in the past that it’s nice that they’re solving this now all right with that see what time we’re at here we got a little bit more time so
14:22 here we got a little bit more time so I’m going to give you one of my quick I’ll call this this is our beat from the street standpoint we’ve been doing a little bit of exploration ourselves and to Co on that vein of git and git integration we’ve been doing some experiments around what items or what artifacts are able to move through a deployment pipeline okay so we’re talking about git and GitHub that’s all interesting but if you look at Microsoft documentation they would recommend that everything in the development workspace is attached to
14:54 development workspace is attached to your git test and production are not attached to your git repo they are purely they stand alone and they are copies of artifacts that live in your test workspace and you use the deployment pipelines to promote content between the different areas some of the things I’ve been finding and initially looking at this is I have to do some more investigation on this so it’s not fully fleshed out yet but depending on what artifact you’re using for example data flows gen two do not move through a
15:24 flows gen two do not move through a deployment pipeline you can’t you can’t move them through you can’t check them into G so there’s some challenges there with certain artifacts that are not fully supported in the deployment pipelines and in addition to that you have to think about each of these artifacts every pipeline every notebook every data flow they may be pointing to a single lake house I don’t think all the capability and this is where I’m testing things right now I’m finding that there’s certain artifacts such as
15:55 that there’s certain artifacts such as like a data flow Gen 2 when you move it from Dev to test it’s not immediately being repointed to the lake house that’s inside the test environment so even though I’ve moved the something between environments it still points to the old artifacts this I think needs to be fixed a little bit there needs to be some more things like there needs to be the ability to like manage these connections as well it almost like the connection to these different sources or of information need to be
16:25 sources or of information need to be independently managed from the actual artifact fact itself and that way you could have how do we solve this in in cicd pipelines we solve this by making like an independent file or database or table where we look up the connection string that we need depending on what environment we’re coming from so the connection strings can change and so each artifact you build has to be kind each artifact you build has to be dynamic in the fact that go find the of dynamic in the fact that go find the definition of what I need to connect to go find where my Lakehouse exists and
16:55 go find where my Lakehouse exists and then connect to that then do my job so there’s this whole really interesting connection piece that I think is not quite fleshed out yet and it’s still a little bit clunky in my opinion have you experienced the same thing Tommy yeah I was about to say do you like the and like I we have a few tests right now actually with the best practice the one get in the deployment pipeline I don’t like that like it’s very frustrating to go back to both systems and I want to see like do you like that or is does it feel like what’s your what’s your own
17:26 like what’s your what’s your own experience with utilizing that one workspace with get and then everything else would deployment pipelines let me because my opinion that’s a good question yeah I feel like this is something something that so I’m going to get very technical here for a moment inside a git repo you have this thing called GitHub actions GitHub actions has a folder that is created when you use these it’s called dot GitHub it’s like a it’s like a it’s a very specific folder that contains the
17:58 a very specific folder that contains the actions inside the repo where you Store settings that go along with that repo and tells you things about that that pipeline or what what’s happening in that repo I think we need something very similar I think if you think about this what I’m thinking in my mind is look I would like to control through the git I would like to control all of the settings for each of the indivi individual workspaces and then link okay this workspace is uses these connections the second workspace is uses those connections and the third workspaces
18:29 connections and the third workspaces uses different connections right so if I’m thinking about this I would like the the git repo or however we’re storing our information to capture all this if you what deployment pipelines are kind you what deployment pipelines are doing when you make a deployment of doing when you make a deployment pipeline for a semantic model and you add variables or parameters there you can go create the semantic model move it to the test environment and you can change there’s a gear in the deployment pipeline you can switch the con settings of the configuration for that connection so you can adjust it awesome which is
18:59 so you can adjust it awesome which is what you want but I don’t want that stored inside a deployment pipeline as an arbitrary I have to go click a button and set it I want that to be a file or some config file that lives per environment or something along those lines something I could go pick up and and pre-build or build that and make and manage it with code does that make sense Tommy what I’m trying to say yeah and couldn’t you now do that technically I think I’m not sure yet and that’s where it’s going to a GitHub repo it would follow all the rules of a GitHub repo but that’s just for the development
19:30 but that’s just for the development environment what I want I want the deployment pipeline to consume an artifact a file a settings configuration something there that there’s not it doesn’t exist and so what I find myself doing is I have to go point to something that’s like a third party or there’s a separate Lakehouse that doesn’t exist in my pipeline that I have to go read data from to then determine what environment I’m in and then how to set the connection string so it’s not very janky right now because you feel
20:01 very janky right now because you feel very smooth with your first workspace using utilizing the repo because you’re like okay this is all familiar and then you have to change your rules and change your process once you get the deployment pipeline because now things you have to now deal with the technology once you the pipeline yes and no like I’m not worried about changing the process I’m I’m actually okay for mean I’m I’m actually okay for for smaller organizations I think this makes sense yeah I think you’re going to very quickly find that people are going to not use deployment pipelines at all and instead people will just say I’m
20:31 and instead people will just say I’m going to build a repo and I will have
20:35 going to build a repo and I will have multiple branches there’ll be a single Branch for the development environment there’ll be a sing and there’ll be a single Branch for production so I I think people are going to do this differently they might manage this other ways I’m already in my mind starting to figure out there are many patterns that you could use but they all have their trade-offs well this has been my argument the deployment pipelines were G for people who didn’t have git they correct agree and now that we have it how do we better use it and I don’t know if that I don’t know if the I don’t
21:05 know if that I don’t know if the I don’t know if we’re there yet I think the deployment pipelines needs to go through a bit of a a rebuild a rethink a little bit aish now it needs it needs a little bit more polishing now to what we actually need to have it t yeah TLC yeah tldr Tender Love tender that’s not long didn’t read not the band not the music so so I I actually do have a Beat from the street and it’s question it’s a question as part of your overall reporting Solutions how often are you
21:37 reporting Solutions how often are you generating data dumps and sending them into an into an email oh okay well let me I’m gonna say how often am I getting asked to do that versus how often am I doing that correct and that I’m getting asked all the time to do data dumps anyone who talks to anything power how do I get all this data out in this table for the ask is all the time do I give that to them no I try to educate and show them there’s an overview like we’re and
22:07 them there’s an overview like we’re and I am pushing more clearly towards if you want insights on data that’s a report let’s talk about summarizing the data and helping you figure out the big picture and then when you want data dumps I’m saying it’s definitely page reports and Page reports now comes with parameters you can build it in the service which is way easier than the stupid little desktop app you get to use it’s so hard to build a parameter the desktop so when I when I last worked internally which I think is probably the most pre best way to look at this when I when I first started it’s
22:37 when I when I first started it’s probably 45% of request where we need an email things were already happening that way way so that’s a low number I would say proba higher that because is that because there was no is that because there was no access to the data or the data was there it was in a powerbi report so all the data was already accessible it wasn’t because it was inaccess ible so we went through each of those and those were one of the main priorities on Ed to your point educating those teams going there’s a better way okay they’re like
23:07 there’s a better way okay they’re like well we don’t like clicking on this we could change that so those became our priorities to get them to the service get them somewhere else where it didn’t exist an Excel file by The End by the time I decided to yeah become the yeah become the start my own band cese cut the cheese run that happen all no by the time I decided to start the consulting firm we were probably down to maybe two or three% or two or three actually emails
23:39 three% or two or three actually emails that were going out just because like people found a better experience in a different way and rather than the data dump what what are some reasons why you don’t want to do that so probably the biggest one is where does the data live the source of truth you’re making a copy of the data in a raw file which someone’s going to try to now explain or interpret rather all they they really want a snapshot of the data they want a way to explain the
24:10 the data they want a way to explain the data on that day the Excel file the CSV or the the PDF does not allow someone to actually interact with it doesn’t allow someone to actually interpret it they still have to do their own calculations especially if it’s the data Dum but again we actually when you end up asking people what do you really want they don’t want rows and rows of data that’s not their end goal they really want a snapshot of there something pre-baked for them so let’s get bring them to the source of truth let’s
24:42 them to the source of truth let’s pre-bake that for them with the least amount of clicks possible that’s already connected to the data of the organization because again the data dump simply just becomes their own interpretation of that raw data okay so so that’s one aspect the others I think are education of how to use the tools right because it it i’ agree that you’re you’re you’re losing traction towards like data culture data maturity levels you’re adding resource pressure depending on how much you’re
25:13 pressure depending on how much you’re doing this and how widespread and I think one of the biggest things for me is you lose track of who’s using the report there there’s no visibility into like actual usage so the reason I bring this up is I ran into into a business use case use case recently that I wanted to throw out a caution for did that in power automate you can generate a whole ton a file off of a
25:44 generate a whole ton a file off of a powerbi report and email yeah D query yep not yep not even connect to the powerbi report yeah just like somebody builds a table and then boom dumps so I wasn’t aware of this it was nice that the business user was like had made a request cuz for changes to an existing report and Tommy this aligned with the report existed the filters were there the end users just didn’t know how to go like click on the filters and save their filter
26:16 filters and save their filter set and or his ultimate solution was just to create a bookmark page that had the slices of information for the users which is still much better than where he was going which was apparently the the the logical reasoning went well we don’t know like we’ve had problems with user adoption because they don’t know how to use the reports so we’re going to ensure that they can use them by emailing them and I
26:49 they can use them by emailing them and I and I just like I was scratching my head a little bit and just well if you want to ensure to ensure adoption train them on how to use the link of the show them show them where to go and what to do and you actually have then an understanding of user adoption because if this is a big need of the business the powerbi service lets you business the powerbi service lets who’s using the report so like an know who’s using the report so like an interesting point right like if you have power automate as an accessible feature
27:21 power automate as an accessible feature in your business maybe it’s an area you would want to explore if you’re going down the data culture route and determine how many emails are actually being sent with data dumps I wonder if this comes up on the activities log Seth I’d be honest I’d be curious to see if that’s an activity that’s appearing there yeah from an automated system because I would have to imagine if if it’s hitting anything in the powerbi service that could be an activity that’s appearing here’s a powerbi automate I think activity I think so and I think that might be something that would be
27:51 that might be something that would be like you would probably see a very large Spike on those either turning on or essentially be some building their own pipeline to extract data from your reports which is not where you want to be I know no I I get it from a a data access issue but I would also argue Mike we can do that with pated right exactly I suppose if you have a complete self-service solution maybe you intentionally build in this direction for certain use cases
28:21 in this direction for certain use cases but not in use cases where the data is there the data is accessible yes and what are we trying to do with the reports when we build them which I think is a good segue into the 3300 and I’m I’m glad you brought that up too because to your point with the seg of the report we talk about Fabric and get and all these Advanced tooling but organizations and still people today are still dealing with things around powerbi around data culture that are always going to be there these things are not going away
28:52 there these things are not going away just because the technolog is changing so don’t mean to get a little emotional but but I I think I love the fact that I don’t love the fact these things are still happening but but Tommy I think you make a really good point though the fact that you were able to so here’s what I think the the moral of this story I feel like is one you need to be able to understand is it happening because Seth you heard about it from a ticket right that’s not where we want to be listening and hearing these things come from rather we would rather have some reporting or listening
29:22 reporting or listening to the the activities log and say wait a minute monthly I’m reviewing our our metrics and man there’s an activity that I was not expecting what is that activity and at least triggering enough interest to go okay let’s go figure out what that thing is and then you can say okay well now I can see that this automated power automate thing is regularly hitting stuff let’s go find out where that comes from so and to your point set I think it’s more of a culture shift or behavioral thing and again I really like your example time 40 to 45 to 50% of your people were just
29:52 40 to 45 to 50% of your people were just getting I just need the data to dump out because they’re taking it and putting it somewhere else or doing something else with it when that is happened it’s really an opportunity to come back in and say what do you what show me what you’re doing show me why this is occurring and then from there you can step back and say here’s a better way of doing this let me educate you on probably what you’re doing already exists inside power. com so you don’t have to export it and if I really do need a snapshot of every piece of day that has data that going into it let me know and let’s build a better mouse trap
30:24 know and let’s build a better mouse trap for okay here’s the snapshot of the data as it was today here’s the snapshot of the data as it was last week and honestly I when I see things that are snapshotting data it’s not really valuable the things that people work on on top of that they just want to have record of what was at this older point in time right it doesn’t really matter and and and that falls into like the position Direction thing like oh great you have snapshots what are you doing with it well every once in a
30:52 with it well every once in a while or actually the value is in comparison to a different time range Point let us just build that for you yeah let us build this build that snapshot like the view of how things are changing over time it’s called a line chart and we’re already snapshotting all the data so we can tell you what’s what’s going on yeah we we work a lot with Transportation companies and or or things where there is a set date and time when something needs to leave think of like the
31:23 to leave think of like the train leaving the station or think about the the airplane leaving the airport right some it’s going to fly there are companies out there that want to make sure that Hardware that plane boat train whatever that thing needs to be filled up as much as they can with all the all the people all the boxes all that they can because that maximizes their profit there’s a lot of reporting around okay what was the status in time of how filled up was my item this is this is exactly what you’re
31:53 item this is this is exactly what you’re talking about Seth it’s that it’s that experience of I need to see that trend to how filled how completely you how we are we behind Trend are we ahead of trend do we need to add more discounts do what do we have to do to get this thing filled up so this is a a really good point it’s very relevant for data reporting but it really changes how you model the data and that might just be the business can’t communicate back to the data people or the engineering what do you really need how do you want to build this pattern very good points I love it all right we
32:23 good points I love it all right we burned through a lot of time talking through intro topics this was really good thank you very much it was really good good topics here let’s give homage to our article here today so sqlbi Kurt buer is describing the three the 30 and the 300 roll Tommy you want to give us just a quick little overview of maybe some of the key points you’re seeing at the top of the article here and we’ll jump in from there so Kurt continues to be on fire from an article point of view if he was a basketball player this would be Seth Curry so we’re talking about the 33300 rule and it’s also known as the what
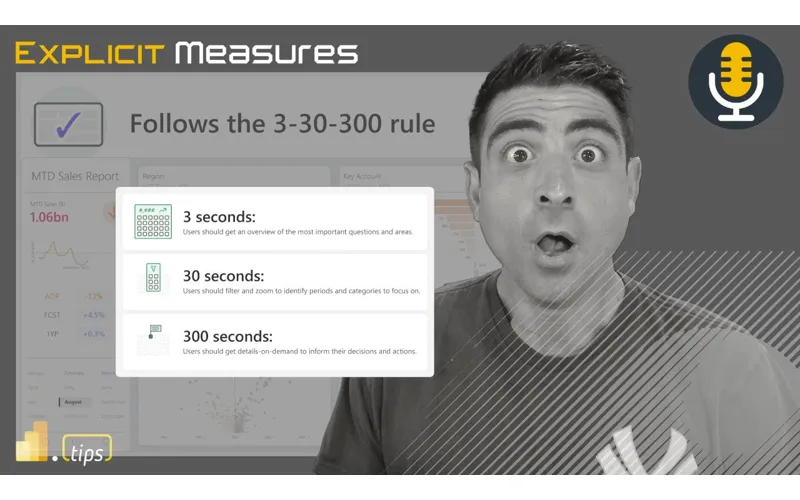
32:53 rule and it’s also known as the what we’ll call the visual information seeking Mantra which is really strategy for organizing reports in a way that allows users to quickly and efficiently find the information they need and the idea is we have 3 seconds 30 seconds and 300 seconds user should be be able to find information around each of those time frames and what they’re finding is different so that’s I think pretty just a way to introduce this and to me I’ve never heard this from
33:24 and to me I’ve never heard this from the books that I read from my my own Knowledge Center so to speak so this is a very interesting way to look at things because usually we look at things around each report is dedicated one thing but if we could put this all in one report this is a little pretty cool so I’m going to point on this article basically hinges on a white paper from Ben Schneiderman is how I’m going to say his name from a department of computer
33:55 his name from a department of computer science out of College Park in Maryland so like so this is this is not like they came up this like willy-nilly like you came up this like willy-nilly like out of the out of thin air like know out of the out of thin air like this is like a very detailed like someone has studied and this is one of my points around data visualization pieces a lot of people ask I’ll ask in interviews where did you get your information from how do you learn how to pick a bar chart versus this versus that there’s actually a lot of studied material of people in universities studying graphics and visual design you should be able to go find other people’s
34:26 should be able to go find other people’s research and just adopt op it and look at it this is I think what we’re looking at here so Ben did a great job on the article Kurt is summarizing this and actually putting it into practice on a report yeah I I think what was interesting to me is I I had to look up is is this 33300 thing like is is that a technology thing if like is this something that just came up so it’s actually like I I guess comes out of urban for Greening like a forestry kind urban for Greening like a forestry thing that was the only reference I of thing that was the only reference I could find in like 2021 there was a
34:57 could find in like 2021 there was a gentleman called [Music] seou I’ll go with it but but the process essentially his his his thing was like at least three trees in sight from every home school and workplace at least 30% tree canopy in every neighborhood and no more than 300 meters between every home and nearest park or Green Space the only reference I could find so I like I like what they did in terms of like finding something that is easy to conceptualize right first
35:28 right first and I think aligns to a lot of what you’re referencing Mike which is a lot of the data and visualization space right which we dabble in as data people that do visualization but yes there are many others that do visualization as a career illustration like especially like infographics for news papers Etc like consolidating down an immense amount of information into a very simple form and
35:59 information into a very simple form and what the 33300 speaks to me is and and what they outline in the article is aligning these like seconds to a lot of the way we digest information right so if if you align this to like the Galt principles that we’ve talked about we’ve had done presentations of many things on it’s it’s all in what are the things that you’re doing from a visual standpoint to elicit a reaction in the way that you
36:30 elicit a reaction in the way that you would want to from the end user and typically right you have a what are they like preattentive attributes right like things that just pop out in the page and one of the things I’ll walk through is like color and positioning and all the things that I think we’ve obviously also done a lot of the research on to build the theme generator and all the things that that help with with these things yes is there’s a process by which the vast majority of like English-speaking you
37:00 majority of like English-speaking you majority of like English-speaking people read from left to right and know people read from left to right and like how you want to design your page and I think they just did a really good job of like reshaping that into a package that is a little bit more more focused on the report build instead of adding in a lot of these other learnings and things from a a different space there’s some very critical points you’re putting here Seth and and again I I’m loving today’s episode because even if Microsoft and
37:30 episode because even if Microsoft and the technology changes the people don’t and we’re talking about fundamental aspects here that have not changed since powerbi has been out and will not change no matter what powerbi becomes users can struggle with what they see and also hopefully we have the skills to design what you’re talking to is that iconic short-term and long-term memory and really that first aspect this is part one of the things I do on training Mike I we might actually have the same slides here on on kind iconic memory and that’s
38:02 here on on kind iconic memory and that’s just the idea of before things you even realize things even get to your brain they’re in your brain and the amount of information flooding in your brain’s always trying to summarize things right like immediately it’s trying to summarize right yes and if you’re trying to say okay how do I know what’s actually sticking my brain look at the wall real quick close your eyes what’s stood out and there are reasons why that red color or the triangle with a maybe that wasn’t perfectly aligned stands out
38:32 that wasn’t perfectly aligned stands out yeah and when we do our visualizations this is the same aspect here so in that 3 second rule don’t expect people to understand the whole report or understand all the data in there or where you want them to look because if you have things aligned or you have something conditionally highlighted in the bottom right they’re that’s where people are going to focus and so talking just about where do we want people to start where do we want them to guide them without necessarily verbally telling them or logically telling them
39:04 telling them or logically telling them that’s going to be happening because of this iconic memory yes and and and to be also very clear here as well like Kurt’s doing a great job this article is very deep it goes into like very detailed like here’s some examples here’s some I like here’s some examples here’s some this pulls on a lot of other areas mean this pulls on a lot of other areas and I don’t see them actually pulling this out very very in the very detailed way in the article but they’re they’re talking about a lot of the good gal principles right go from the top left to the bottom right because that’s how people generally read most of the world reads in that fashion using Color avoid
39:36 reads in that fashion using Color avoid extra ink and other unneeded information simplify the message right keep it simple and so there there’s a lot of gestal principles that here so again a lot of these things that are in this article I think are really good places to guide Yourself by and I really like the examples of talking about the detail this is another area that I thought Kurt does Kurt does a great job of AR architecting really simple ideas with graphics and so he does a really good job of like explaining like at a pyramid level here’s the highest most summarized detail total sales right and it goes
40:07 detail total sales right and it goes down in detail lower lower lower until you get more grain of the data into you so you can explain okay what region what product type all the different things that potentially will be contributing to that sales being up or down so I really like the the infographic pieces that live in this article as well Kurt’s done an amazing job and he also does examples of here’s a report that does not follow the three the 30 the 300 rule because this is where having real examples of this I think really help people understand like
40:37 think really help people understand like yeah this is this is not what we’re trying to do here and then he gives an counter example of here’s another example of the three to 300 rle and one one area that they didn’t point out in the article they didn’t really put in there in maybe they they talked about it but I didn’t see it very clearly called out was aligning objects they have a lot of barart in the in the the acceptable reports they align them from the most negative to the most positive so this is this is a really key point and when I
41:07 this is a really key point and when I learned a lot about visualization it was thinking a lot about position and
41:11 thinking a lot about position and Direction where am I right now and what direction is our business heading is that what we want because just putting in a single number of 1. 6 billion in Revenue that tells you nothing you don’t have anything to refer to it there’s nothing there’s no reference point to say is that better would we expect to be higher or we expect to be lower and I think reporting really starts becoming actionable when you start adding budget and expectations and what you want to be at and when
41:41 and what you want to be at and when those numbers start appearing in your reports that’s when people can really make decisions because we can say we’re 10% behind or 10% ahead that’s where we start changing behavior of people because we need to change what we’re doing so we can sell more or reallocate yeah and I I think the the examp the visual example is a good one because both it uses the same format it uses the same theme the same layout right the only difference is really how you’re
42:11 only difference is really how you’re presenting information on the page and I think it’s a stark example of yes does the top report look good still yeah it does however it’s information overload you’re not guiding the user into the different particular area areas that are are leaned into in a learning path here or what we’re talking about is some of these principles and like how people interact with data and that’s the I think lynchpin behind some of some of the simplification that we need to do
42:43 of the simplification that we need to do in the visualization and I I think I that’s what I like about this article is it drives into those key points without a lot of the the detail that you can talk about but one of those things is like for like I said English speaking right left to right left to right down top to bottom but in in cultures where you’re not reading that way maybe it’s the opposite right so it’s it’s the direction by which people usually digest
43:13 people usually digest information large like different font or colors that pop or the things that like are the most important on the page are typically the ones where your eyes want to go immediately and one of the the things I used to do when I was actively building a lot of reports is Pull It Up full screen on my on my computer and walk a distance away talk to somebody break my attention and then look look back and where does
43:45 and then look look back and where does my where do my eyes go first without like because the information the data so sometimes you cheat yourself and you’re like oh yeah it’s right there but can you see it with like from an abstract perspective and it’s really interesting just from a design element perspective to go oh dang like actually my my eyes are drawn to the middle right or to the lower right first I I might want to change or lighten up my Matrix a little bit and then bold my colors over in this
44:16 then bold my colors over in this direction because that’s where I want to focus people’s attention first and can I I’m just going to emphasize what Seth is saying here that that’s usually the hardest thing for for a lot of people starting out if I were to ask both of you your own journey and data visualization probably that’s the the case where we’re in depth we’re the ones under the microscope looking at our own reports so yeah we know what it means but to try to break away and look at that with fresh eyes is very difficult
44:46 that with fresh eyes is very difficult so I just want to emphasize what Seth is saying for a lot of users if you still feel like you struggle with this if you’re still relatively new this is a great exercise to do is very much either getting someone else or breaking your own attention walking away from it and then trying to look at it again and it’s still hard because again you’re the one intimate with the data you’re the one intimate what the what the visuals look like because you built it you’re the one doing the conditional formatting and all of the aspects of it so where
45:17 of the aspects of it so where all the bells and whistles are getting an outside view or getting your head outside of what it already is can very much change how you’re going to design it or what you actually designed yeah so so as you walk through like their guidelines and I’ll I’ll just read through them quick for the audience here right focus on specific questions right this is that requirement Gathering focusing on the business go from top left to bottom right use color to steer attention limit ink and information keep it simple make it
45:47 it simple make it convenient which one of these for you guys is the most difficult to accomplish o great o great question question I think I find myself trying to overp put information on the page I find so many things intriguing and don’t necessarily narrow down on a single one or two main key questions that we’re we’re trying to to dive into I have to do a lot of work I feel like internally I’m doing a lot of work of what’s most important to me because that sometimes
46:18 important to me because that sometimes changes depending on how I feel for the day and over time that will change like for example let me just give you a real example of how I use this today I have her internal report rep in I have a team of people who are working on projects I need to know how many hours everyone has spent on every project and so when I initially built my report to do my internal reporting it had a lot of things on the main page now after using that report I probably use two or three main visuals that indicate to me like where I need to be in order to say am I on track am I off track do I need to change some behaviors do I need to go
46:48 change some behaviors do I need to go talk to somebody so over time like my initial opinion of what I thought my report was going to look like in the first ver version probably had too much and so there is times where I’m still looking at that summary stuff and then driving down deeper in the page so what I have adopted for what I’m using is the window that I’m using my report is extremely long and I have the summarized the key information I can bring up the report immediately look at my top part of the page and know exactly am I on
47:18 of the page and know exactly am I on track do I have things and then what I can do then still is if I need to scroll down the page I can then scroll deeper to the page and that’s where my detailed t are living you scroll still I still scroll it’s just a really long report because I didn’t I didn’t want to click back and forth between pages I wanted to see the detail but I didn’t want it initially I want I want the summary at the top so it’s almost like a web page more than it is like a report and that’s one again one thing that I like to use in some of my reporting is everyone uses 16 by9 ratio
47:49 reporting is everyone uses 16 by9 ratio on reporting it’s just a very standard thing you can get away from that a little bit you can you can adjust that a little bit not everyone 1, 200 baby not for everyone but you can you can do the 16 by9 ratio but you don’t always have to do that one yeah so that that would be me I have a struggle I struggle limiting the most important information and then appropriately building the detail Pages behind it that’s where I spend most of my time working because I know that’s a weakness okay well first three of my my report
48:19 okay well first three of my my report template has three pages none of them are standard size they’re all slightly larger but I would say Mike it used to be what you talked about in terms of too much information but for right now I would say the where I would most want to improve is going from that top left to bottom right or really the segue from your most important visual that first three seconds to where do you go from here what is the most or next most permanent information that you want to show a user because yeah we might have
48:50 show a user because yeah we might have that highlighted information of good or bad but there are usually so many Avenues you can go and it’s very dependent on how much information you’ve gotten already from your stakeholders or you’ve gotten in that discovery on what’s important because again your initial aspect is always to go to something trending but I really really do hate TR just a normal trending line chart now because usually anything you’re looking at over six months may be helpful once but it’s not going to cause
49:21 helpful once but it’s not going to cause someone to go back to report next next week because it doesn’t change a lot so where do you go from here that can be important for either that three or 30 seconds but is also going to give the user enough information right because you can filter things out of context but again it may not give that all the information that are us looking for yes read that one too I think mine roll into two but it primarily lands on mics it I I
49:54 primarily lands on mics it I I typically can lay things out in such a way that I’m I’m drawing drawing the attention where I I need it or want it to be but the keep it simple it cre creates this challenge of a balance between how many pages versus adding potentially a little complexity on on other pages so maybe I’m intentionally adding a bit more because in simplistic form even in the example you only have so many visualizations on a page right like
50:25 visualizations on a page right like because otherwise you start to over load which I think they do a good example of like there’s a ton of metrics that are just stacked on top of each other in card form right like and it’s really hard to digest all that would I add that many no right but there’s this balance between okay well if I need to produce all of these insights how do I break that apart in the pages and we’ve talked about this a lot I think a standard one that that goes really well is having a summary and Analysis and potentially a detail page right you can do drill
50:55 detail page right you can do drill through you can do different things like that but that’s just like a basic still you’re going to be challenged with like how many things and what insights do you need to provide and where all of the sudden that makes sense in a simple form can easily draw you into well I okay that makes sense in this realm but I would readjust things if I’m going to use it by region and I would like change these things okay so now I’m on another page or I could add in these other two visuals and now it’s a little busy but
51:25 visuals and now it’s a little busy but so there’s always this
51:27 so there’s always this push and pull of like the right amount of information for an user but that and I think as part of that is also challenged this like focus on the specific questions right so you’re trying to solve these problems with the the end user in mind yes and you’re making specific decisions to say I’m answering these questions on these Pages the other thing that I found extremely challenging if you don’t do as a piece of advice
51:57 of advice is track that like even if if you do no other tracking mechanism like add a page into the powerbi report that says this page delivers these insights or answers these questions because inevitably inevitably what’s going to happen is as users begin to use the report EV like someone else is going to say what it i’ I’d really like to see this I want you to add this I want you to modify whatever and that’s not
52:29 to modify whatever and that’s not necessarily a bad thing however if you don’t know what the purpose behind the report build and Page was you’re now going to confuse or muddle the issue like muddle what’s on the page and you like lose the like potential insights that you’re driving for because there was a specific reason yes why you omitted certain information or did not include it and it is a hell of a conversation six to nine months down the road to look
52:59 six to nine months down the road to look at a report when somebody’s like well why’ we build it this way and question we were trying to answer with that so so that’s where I say like those two have always like continue to present challenges as you’re going through and building reports I do love that like as as I just read off these like top level like build processes the rest of the article dives into the details of gathering requirements and and user questions etc etc but those are the two
53:29 questions etc etc but those are the two that really stand out to me even in the continuing build process that I go through speaking of which I I I feel like we should give some love to the the middle child here because I think like like anyone who has three kids the first gets most most of the attention the third take care takes care of itself and that middle child I think sometimes just doesn’t get the attention it needs and that’s that 30 second area the reason I say that is we’ve all probably learned or put our most know knowledge around how to deal with getting grabbing people’s attention into your both your
54:01 people’s attention into your both your points that 300 seconds the extra detail details on demand those are our tables and we probably do that without even thinking but that middle area of what do how do we grab and what information should people get out of 30 seconds I think is think is one maybe not where we struggle with the most but I think where we spend the least amount of our time I I like your Point Seth and also Tommy I think I’m going to reinforce your point here as well there’s always this concept of what you built the
54:32 this concept of what you built the report for initially those questions potentially get answered and are off the table they’re no longer questions and so there’s always this concept of what are the regular repeat repeatable questions versus onetime questions is there a particular issue we’re having right now where I have to address some items or should I be thinking about what is that common question I’m always asking and I think that’s Al potentially those sometimes we build reports for those short one-off questions exploratory type
55:02 short one-off questions exploratory type question answering whereas longer term I need to think about let’s let’s how do how does this what are those longer repeated questions occurring and I think that actually changes how your report design builds and for me that’s where I find I’m building separate pages for those kind building separate pages for those things or I’m giving I’m actually of things or I’m giving I’m actually building more thin reports I think actually so in those short-term questions that I’m trying to answer here’s a data model go answer those short-term questions here’s a standard report this is now answering those
55:33 report this is now answering those long-term repeatable questions and I think in my mind there’s there’s some formulation there around building those two types of patterns on how to use your reports are we’re getting close here on time we’re gonna oh you want to do hot take or we’re gonna I was gonna say let’s skip hot take and then go right to final thoughts all right you want to end on yeah and you guys don’t have too much explanation but I I just go off this 30 seconds one I’m gonna give it a one so I with the idea of the 30 seconds filter and zoom
56:03 idea of the 30 seconds filter and zoom next and what the visual is showing what ctt’s displaying I’m gonna say this I’m going to say the 30 second area of a visual is the most important area out of the 330 and 300 in terms of what’s the most impactful for the user the 30 second area is the most impactful for the user I’m giving that a six so of the three areas 3 seconds user should be able to get an overview of the 30 seconds user should be able to filter and zoom and then 300 seconds the user
56:35 and zoom and then 300 seconds the user should be able to get details right and on their on demand to inform their decisions and actions most impactful not the most important but the most impactful what do you mean impactful what’s the difference between important versus impact important is there’s not impactful is they’re going to get the most information out of that the most actionable information I I would say I I I’ll say I’m going to I’m not going to give you a number on this one PR specifically but I
57:06 number on this one PR specifically but I I think you’re I think 300 seconds being able to sit and really and think about what’s going on I think that is probably the most actionable item item on this one most times you don’t need all the data to be able to make your analysis usually you’re looking for a handful of records that make up the this is where the sales down from this is this is what information I need to understand that’s occurring so I think filtering or being able to apply filters to a page and narrow down the data to what you find is most valuable I think that’s
57:37 find is most valuable I think that’s incredibly important to use here so I’d give it a higher I’d say of these three things I would say I would probably rank them in order of 30 seconds is probably my my most important part of this process okay 300 seconds is probably very my second one and then three seconds right an overview of important questions yes it’s important but I’m not going to emphasize that as much right the whole goal of this report is to drive for actions and decisions so yes
58:09 drive for actions and decisions so yes then I need people to say 300 seconds is still very valuable Seth he’s G he doesn’t know how to answer the question because it’s a weirdly weird question again the most impact is pretty straightforward it depend it depends on the user it depends on the the data and the rep right because I could say the for no for for an everyday if I’m tracking a metric that changes daily and like my my sales go it’s a second it’s a 3 second so to say say one of these is the most
58:41 say say one of these is the most impactful largely depends on the report in the audience and what they’re using it for I hope that like should I should I push for the 3 seconds being the most the most impactful yeah because then somebody can digest and make decisions off three seconds of spending time in my report to your point is there a lot of value where instantly like hey my number went up who are the accounts right or who was the person who did the work is that in my 30- second valuation yes right so do I
59:11 30- second valuation yes right so do I spend the more more more more time there or is it like fine I’ll give you a two okay I’ll put you as a yes then again let’s put the definition if words have meeting this is called this is not Tommy’s take this is a hot take for a reason I’ll put you both I just I love I love how you go one to seven yes no is the outcome of what it is so it’s we’ll change the rules no rating it’s got to be yes or no then either you agree it’s not an
59:42 either you agree it’s not an overreaction do I agree with your overarching cart blanch statements that definitively 30 seconds is where the most value is no I do not okay that’s fine we’ll we’ll maybe modify this to be overreaction Tuesdays or something so there we go with that being said thank you all very much we appreciate your time listening to the podcast we you time listening to the podcast we this is a a valuable hour that know this is a a valuable hour that you’ve spent with us we know you could be doing a lot of other things washing your hair cleaning your house doing some laundry actually spending time with loved ones and family members but in
60:12 loved ones and family members but in instead you choose to spend it with us we we appreciate your time and your ears so with that being said if you like this episode if this found something interesting to resonate with you please go read the article from sqlbi very well written super impactful it’s like a dissertation in visual design 101 it’s it’s very well F out so Kurt nice job on that one very good job summarizing and thinking through those those rules there really like that U with that we only ask that to you the listener is if you like this please share it with somebody else let somebody else know
60:42 somebody else let somebody else know that you found some value from this one and that they they should join us on the community here as well Tommy where else can you find the podcast yeah why you wash your hair because that’s what people do you can find us on Apple Spotify wherever get your podcast make sure to subscribe and leave a rating it helps us out a ton you have a question an idea or topic that you want us to talk about in a future episode head over to power bi. podcast leave your name and a great question finally join us live every Tuesday and Thursday A. M Central and join the conversation on all
61:12 Central and join the conversation on all of power bi. tips social media channels thank you so much for your time and we’ll see you next time thanks
61:42 [Music] out out [Music]
Thank You
Want to catch us live? Join every Tuesday and Thursday at 7:30 AM Central on YouTube and LinkedIn.
Got a question? Head to powerbi.tips/empodcast and submit your topic ideas.
Listen on Spotify, Apple Podcasts, or wherever you get your podcasts.