I had an interesting comment come up in conversation about how to calculate a percent change within a time series data set. For this instance we have data of employee badges that have been scanned into a building by date. Thus, there is a list of Badge IDs and date fields. See Example of data below:
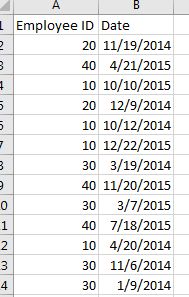
Looking at this data I may want to understand an which employees and when do they scan into a building over time. Breaking this down further I may want to review Q1 of 2014 to Q1 of 2015 to see if the employee’s attendance increased or decreased.
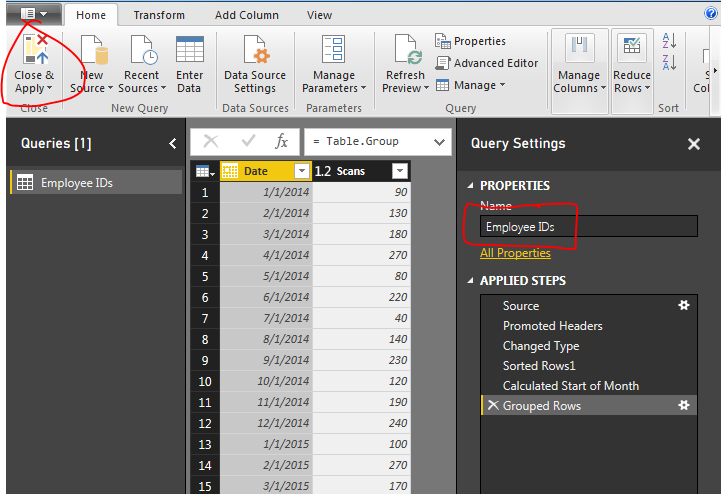
Here is the raw data we will be working with, Employee IDs Raw Data. Our first step is to Load this data into PowerBI. I have already generated the Advanced Editor query to load this file. You can use the following code to load the Employee ID data:
let
Source = Csv.Document(File.Contents("C:\Users\Mike\Desktop\Employee IDs.csv"),[Delimiter=",", Columns=2, Encoding=1252, QuoteStyle=QuoteStyle.None]),
#"Promoted Headers" = Table.PromoteHeaders(Source),
#"Changed Type" = Table.TransformColumnTypes(#"Promoted Headers",{{"Employee ID", Int64.Type}, {"Date", type date}}),
#"Sorted Rows1" = Table.Sort(#"Changed Type",{{"Date", Order.Ascending}}),
#"Calculated Start of Month" = Table.TransformColumns(#"Sorted Rows1",{{"Date", Date.StartOfMonth, type date}}),
#"Grouped Rows" = Table.Group(#"Calculated Start of Month", {"Date"}, {{"Scans", each List.Sum([Employee ID]), type number}})
in
#"Grouped Rows"
Note: I have highlighted Mike in red because this is custom to my computer, thus, when you’re using this code you will want to change the file location for your computer. For this example I extracted the Employee ID.csv file to my desktop. For more help on using the advanced editor reference this tutorial on how to open the advance editor and change the code, located here.
Next name the query Employee IDs, then Close & Apply on the Home ribbon to load the data.
Next we will build a series of measures that will calculate our time ranges which we will use to calculate our Percent Change (% Change) from month to month.
Now build the following measures:
Total Scans, sums up the total numbers of badge scans.
Total Scans = SUM('Employee IDs'[Scans])
Prior Month Scans, calculates the sum of all scans from the prior month. Note we use the PreviousMonth() DAX formula.
Prior Month Scans = CALCULATE([Total Scans], PREVIOUSMONTH('Employee IDs'[Date]))
Finally we calculate the % change between the actual month, and the previous month with the % Change measure.
% Change = DIVIDE([Total Scans], [Prior Month Scans], blank())-1
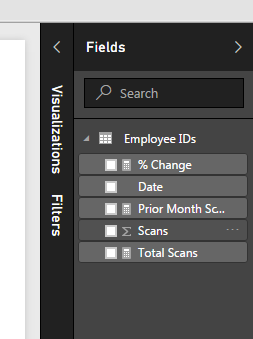
Completing the new measures your Fields list should look like the following:
Now we are ready to build some visuals. First we will build a table like the following to show you how the data is being calculated in our measures.
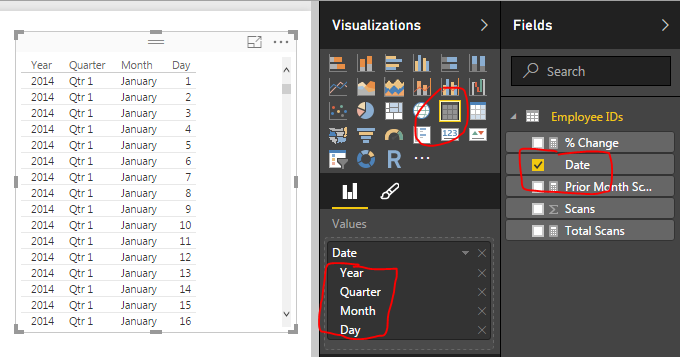
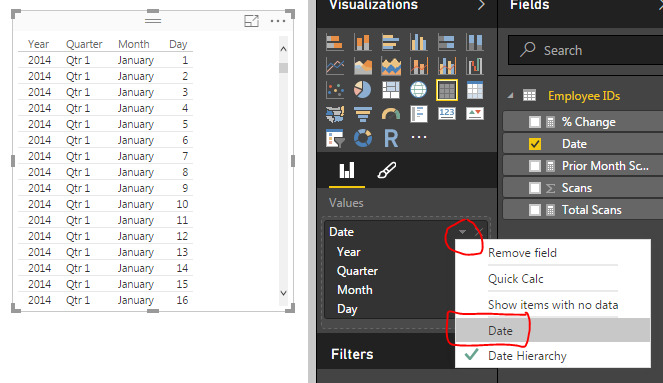
When we first add the Date field to the chart we have a list of dates by Year, Quarter, Month, and Day. This is not what we want. Rather we would like to just see the actual date values. To change this click the down arrow next to the field labeled Date and then select from the drop down the Date field. This will change the date field to be viewed as an actual date and not a date hierarchy.
Now add the Total Scans, Prior Month Scans, and % Change measures. Your table should now look like the following:
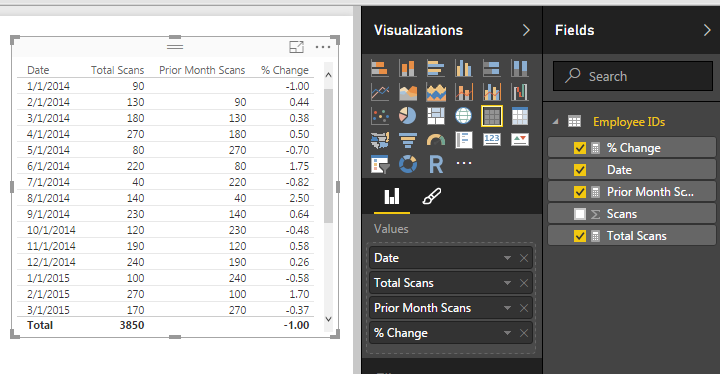
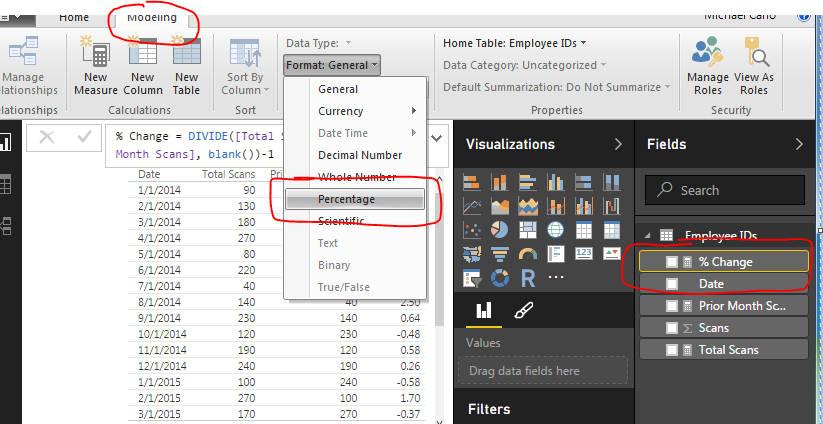
The column that has % Change does not look right, so highlight the measure called % Change and on the Modeling ribbon change the Format to Percentage.
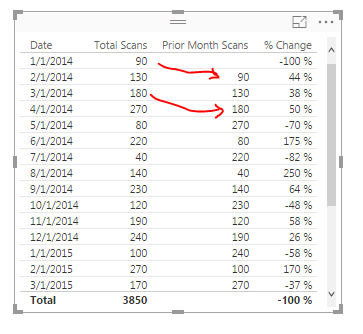
Finally now note what is happening in the table with the counts totaled next to each other.
Now adding a Bar chart will yield the following. Add the proper fields to the visual. When your done your chart should look like the following:
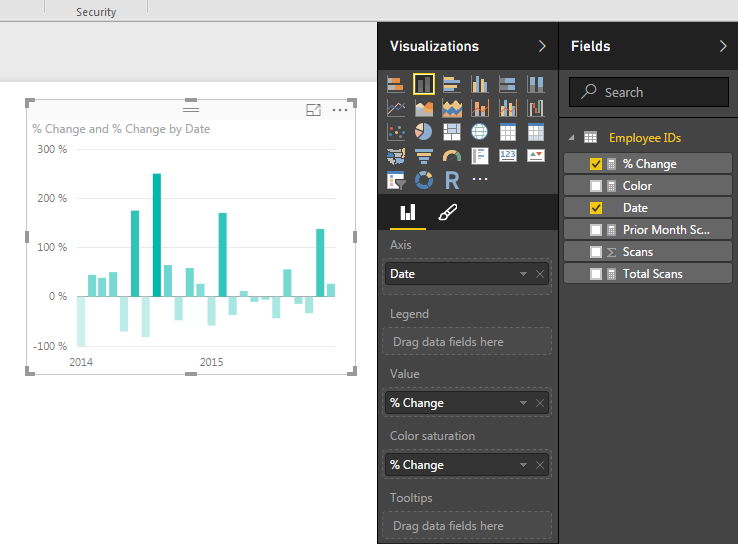
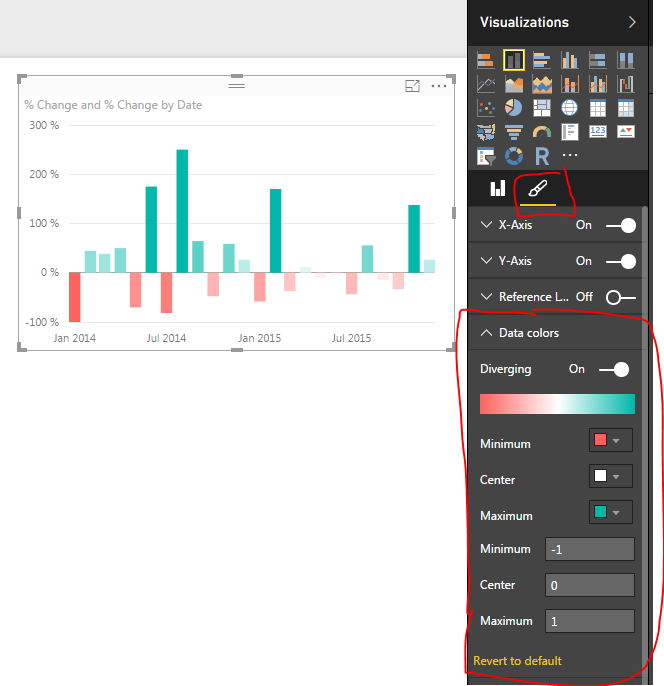
To add a bit of flair to the chart you can select the Properties button on the Visualizations pane. Open the Data Colors section change the minimum color to red, the maximum color to green and then type the numbers in the Min, Center and Max.
Well, that is it, Thanks for stopping by. Make sure to share if you like what you see. Till next week.
Want to learn more about PowerBI and Using DAX. Check out this great book from Rob Collie talking the power of DAX. The book covers topics applicable for both PowerBI and Power Pivot inside excel. I’ve personally read it and Rob has a great way of interjecting some fun humor while teaching you the essentials of DAX.
Hi Mike. Thanks for the post.
I actually am having issues with the previous month DAX function. I followed all of the steps as instructed. But I get a blank row for the Prior month scans measure(not sure why). Also tried the DateAdd function and same results. Do you think it has to do with versions of PBI Desktop? I just downloaded the latest one and have same issues there. let me know if you can think of anything that might cause this.
Divya, Thanks for the comment. I had the same issue when I first created this tutorial. The issue was the date field was in hierarchy mode. Once that is removed the table of data should present it’s self correctly. I double checked this on the latest version of PowerBI Desktop. I’m running 2.38.4491.642 64-bit (August 2016). Hope this fixes it. I will also try to email you the solution. Good luck, and keep on rockin the PowerBI!
I get blank rows as well. how do you get a date field out of hierarchy mode?
When you add the date column to your visual, you will see a little downward pointing triangle next to the X, to remove the column. Click the downward shaped triangle. This will bring up a menu, at the bottom of the menu, you can toggle Data Hierarchy off by selecting the column name. This should produce a list of dates instead of the Year, Month, Day Hierarchy.
I still get blank rows even though the Date Hierachy is disabled.
Any thoughts on how to make it right? I followed every step.
There is a bug. I have experienced this first hand. You have to remove the date hierarchy before adding any other fields to the visual. If you forget this step then and add other columns it will always return blanks. Try deleting the table, add the Dates, then first thing, remove the date hierarchy. Then add the other fields. That should fix it.
This is super helpful! One question I have is whether it is possible to do this with any prior value that is not a date. For example, I work with higher education data, and frequently we want to compare semesters, which do not have clean month by month dates. Fall semester could start in August one year and September the following year, and the labels in the visualization need to show the name of the term. Another question is whether this is the correct calculation for percent change. I always thought it was the absolute difference in values divided by the original value, not the new value divided by the old value. Anyway, great article! Cheers!
Glad you enjoyed this tutorial. I would recommend making a table that would connect your quarters to actual dates. That way you could use the PreviousMonth DAX calculation to determine the month to month percent change.
As far as the percent change calculation. There are two ways to calculate this. I decided to choose the simpler looking calculation to me. You can calculate percent change by Pct Chng = (New / Old) -1 or Pct Chng = (New – Old) / Old, Here is the simplified equation from Wolfram alpha.
Thanks that formula was helpful. The problem I’m having is that I don’t want dates to be displayed on my table/chart like this:
Term date Percent change
1/1/2014 -3.2%
2/1/2015 2.1%
I would like the corresponding term names to be there like this:
Term name Percent change
2014 Spring -3.2%
2015 Spring 2.1%
Is this something that is possible at this point?
Thank you for these articles!
I’m stuck. I’m using GA and my boss needs me to calculate session %change from sept.2015 to sept.2016. I know how to do this in SQL but not in DAX. Can anyone help me?
You should be able to build a couple of measures.
Here is what I used from DAX to build three measures:
ThisYear = CALCULATE(SUM(Data[Sales]),Data[Year] = YEAR(Now()))
LastYear = CALCULATE(SUM(Data[Sales]),Data[Year] = YEAR(Now())-1)
YoY Percent Change = [ThisYear]/[LastYear]-1
In addition to the monthly data I made two new columns, one called Month, and one called Year. These are used to tell the measures to filter down the data before running the sum.
I will also send you a PBIX file with the solution.
Just want to say that this post (and others as I am finding out) was extremely helpful and helped me solve a data request I had. Keep up the good work!
Thanks so much, I really appreciate the feedback! I have really enjoyed learning the Power BI Desktop program. I figured if I was struggling through to learn, why not share it so everyone else can also learn.
Hi there,
Thanks for the detailed explanation. I’ve had a go at this and I get an issue witht he prior month value being assigned to each day when I remove the heirarchy. When I transfer this to a matrix to sum TotalScans by month I get only blank rows for the prior month value and the total for that column is the value for the period prior to the beginning of the date range (e.g Dec 15 was 833, and I dsiplay values from Jan-Nov 16). Any suggestions would be greatfully received.
Cheers,
Chris.
If I understand your question correctly it sounds like your source data contains data for each day. In this particular tutorial the data was pre-aggregated into monthly totals. See sample of raw data used to support this calculation, . If your raw data is coming into your data model at a daily increment you will need an intermediate step to summarize the data into monthly buckets.
You can do this by making a reference query to your original query, adding a reference column that identified the start of the month based on each date you have. Then Group the data by the new start of month field. This aggregates the data down to one number per month increment. Then the measures in the tutorial will work for calculating month over month percent changes. I have worked up a simple demo of this and I’ll send it to you via email. Hope that helps.
I am running into this same problem. Do you happen to still have a demo of your solution?
Thank you for these articles! You can verify it at http://www.percentagechangecalculator.com/ website
Thanks Vedoza! Good and simple website
Hey Mike,
Great stuff! I’m trying to apply your logic to a year’s worth of financial data that’s all in one table, and I can’t get it to work. I’m convinced it’s because I’m missing some piece of data that’s coming from your manipulations you’re doing in the Advanced Query (specifically the Transform, calculation and grouping). Could you provide an explanation of what you’re doing, and how to accomplish it (without hand cranking the query if possible)? You can take this offline and email me directly if you like.
Thanks in advance.
bt
Sure, I’d be happy to help. Please reach out to me at [email protected] and I’ll take a look. It would be nice if you could provide me some screen shots so I can understand what your trying to do.
Hi Mike
Shame there isnt a PREVIOUSWEEK function. Is there a simple workaround to get this? All my data requests are for weekly comparisons.
Yes, there is a PreviousWeek function. At the time I was a little less familar with DAX, thus this is the solution I came up with. You can also get really creative with previous time period calculations and follow the instructions at PowerPivotPro.com, which I highly recommend.
Hi Mike,
I’ve had more time to work through my data and have answered all the questions I’d originally asked. Learning more bit by bit. Like NeilC, I have been able to find a “PreviousWeek” function. I’ve looked online and in “The Definitive Guide to DAX” by Russo and Ferrari. Can’t find any information on PreviousWeek function. Can you provide a link?
Or heck, for that matter, what about previous date function? I’m using a table that reports vacancies every 2 weeks and would like to be able to show a percentage change of vacancies from time-period to time-period.
That is also another good solution. This will create some issues when you start selecting different items on the actual visuals. If you use previous date, and select an item on one of the visuals then the data from the “previous date” function will be filtered out. This can be fixed with variables and using the All() as a calculate filter parameter. Check out this tutorial that talks about variables within DAX. https://powerbi.tips/2017/05/using-variables-within-dax/
I am looking for assistance on how to do something similiar but instead of % change quarter to quarter I need to know status changes.
We have open cases dating back from 2012 to current. Each case is assigned different case status. Trying to figure out a way to show how many/which cases changed to a particular status from quarter to quarter. i.e. changing from open to closed
I would recommend making a column that gives a 1 or a 0 back if the case is open 1, or closed 0. Then you can use a sum function to count how many items were closed in a given month. A slightly more complex method would be to use the DAX function COUNTA, this counts every item in a column. The formula would look something like the following:
OPEN = CALCULATE( COUNTA( Table1[Column1] ), FILTER(Table1,Table1[Column1] = “OPEN”) )
CLOSED = CALCULATE( COUNTA( Table1[Column1] ), FILTER(Table1,Table1[Column1] = “CLOSED”) )
These columns would count the items in the column that are “OPEN” or “CLOSED” per month.
Hello,
I am having issue to sort the data on the tables or on the Visuals by Month name.
Month Column on Excel file identified as Text on PowerBI, would you please advise how to fix this?
If you are using the full month name such as July, then you will be able to change it from text. However, if your month field is in the form of a date such as 1/1/2017, then you can change the data type to Date. This option is found in the modeling ribbon in the formatting section. If your month number is simply a number such as 1 or 2, then you can change the type of the column to whole number, also found in the modeling ribbon in the formatting section.
Hi Mike,
I’m looking to make a card that shows GA Sessions data % change month over month. I am indifferent if the equation shows the change of the most recent 30 days to the 30 days prior to that (sessions from 8/15-9/14 vs. the sessions from 7/15-8/14) or if it shows portion of the month (sessions from 9/1-9/15 vs. 8/1-/15) until we get data for the following month. I’m having trouble making the DAX dynamic in order for the % change to stay true when new data is available. Do you have any suggestions?
I think what you’ll want to do is create a master date calendar with a month index. Then use a calculate function to acquire the current month numbers and the prior month numbers to calculate the comparison.
Here is a tutorial on how to create a DAX date calendar as well as some DAX month over month calculations towards the end: https://powerbi.tips/2017/11/creating-a-dax-calendar/
Mike,
First off, let me say Thank You for all that you share here. It is most appreciated!
My question on this involves a moving population. I just cannot get the right coding for this. I need to show a percent change over time (week/month/quarter) but have it based on the total population, not simply counts. My users currently use a “Heat map” in Excel which shows direct counts. What I need to illustrate is that it does not offer a valid insight when just using counts. For example, If I have 10 people leave one month and 5 the next month, I cannot claim a 50% better retention if I started with 20 people!
So, how do I get a percent change over time based on a total population? I know I need another measure in there. How would you do it in your sample data?
(Perhaps a CALCULATE function embedded in your Divide statement???)
If you need an entire aggregate I would recommend using variables within your DAX equation. Here is the tutorial on variables: https://powerbi.tips/2017/05/using-variables-within-dax/
In concept you would create a variable for the “total population” something like the following
VAR totalPop = Calculate(sum( Your variable ), All( Table Name) ) This will remove the filter context and allow you to calculate a total population.
Then you will calculate the specific number for the filter context of month
VAR thisMonth = sum( your variable )
or if you need the total number of people who left
VAR peopleLeave = calculate(sum( People Leaving ), All( table with counts of people leaving) )
then you can return the divided % change
RETURN DIVIDE( peopleLeave, totalPop, BLANK() ) -1
Hope this helps.
Hi thanks a lot for the useful tutorial. Is there any way that i could hide the percentage changes of the first month which will show -100%?
This is easily fixed by changing the % change equation from:
DIVIDE([Total Scans], [Prior Month Scans], blank())
to the following:
% Change = IF( [Prior Month Scans] = BLANK(), BLANK(), DIVIDE([Total Scans], [Prior Month Scans], blank())-1 )
This will remove the -100% in the first month because there is not prior month to compare to.
Hi,
I followed the script, but it does not work. “Prior Month Scans” is blank. I have tried several methods to move the data series, include DATEADD and SAMEPERIODLASTYEAR, as well as the YEAR(Now)), but all of them returns a blank column. Sometimes I get the sum right, but Power BI still refuses to show the monthly numbers. Happy for help,
Br Øystein
I ran into this issue once before. There seems to be a bug with the visual. If you add the prior month scans column before you change the date from hierarchy to just date, then this issue occurs. A work around that I used to fix this was to delete the table visual, add a new one, add the date column, first remove the date hierarchy then, add the prior month sales. This should resolve the issue.
Thanks! It actually worked.
Br
Øystein
I finally solved this problem of using the PREVIOUSMONTH and PARALLELPERIOD with a hierarchy enabled date column. You need to access the raw Date type field with dot notation.
salesPrevMonth =
CALCULATE(
[sales],
PREVIOUSMONTH(‘Dim Date'[Date].[Date])
)
This will work with a date hierarchy.
Great great stuff! Fixed an issue i had for several weeks now.
My 2 cents: be mindful of the date in the example – you have 1 data point from every month. i actually went with the monthly hierarchy because of several data points daily.
Great help, thank you!
Hey Mike,
I’m getting blank values for the Prior Month.
I have a table with differente values for the same date (first day of month) because it’s divided by categories. (ex: 01/01/2017 | Grape | 32
01/01/2017 | Banana | 27
01/01/2017 | Orange | 20)
Think this might be the problem? Repeting date? Not sure if I made myself clear …
If I change PREVIOUSMONTH to LASTMONTH it works fine … I don’t gett it!
How did this work without anywhere calculating the difference between the value of the current month and the previous month ? I manually calculated a few %Change from the results shown. I find that they do use “difference between the current and previous month anywhere ” whereas the following steps provided in the blog don’t.
Total Scans = SUM(‘Employee IDs'[Scans])
Prior Month Scans = CALCULATE([Total Scans], PREVIOUSMONTH(‘Employee IDs'[Date]))
% Change = DIVIDE([Total Scans], [Prior Month Scans], blank())-1
The equation people typically use for percent change is ( New Value – Old Value) / Old Value, In my equation % change I did a little algerba and reduced the equation to ( New / Old ) -1 I chose this method since it only requires two values instead of three. Both should give you the same result, with the exception when the New = Old, this would return -1.
You can substitute the path for the file in your model’s data (this C:\Users\Mike\Desktop\) with %USERPROFILE%\Desktop\. This allows your source to be dynamic and can be used by anyone without any modifications, plus, if your Windows user profile changes (like move to another drive or renamed) then your Power BI report continues to work w/o issues.
Hi Mike,
If I were to use the table to visualize this for a period spanning more than 1 year, it seems that the table will display for all months in those years even if I have setup a year-slicer. Is it possible to only display the data for the months in year(s) as specified in the year-slicer?
Tks: -Nik
This is where we talk about filter context. The basis of each row would be the month name or number. Thus, what you are describing is a table where the calculation would add March of 2018 and March of 2019 into a row with the filter context of March. If you need the month / year context you would have two options.
1. Add a new column called year into the chart. This allows new filter context of each row, Year & Month.
2. Create a Concatenated column of Month-Year, something similar to March-19 or 2019-Mar. This would again define a unique calculation on a given month year. You would need to use that concatenated column in your table.
Dear Mike,
In order to get the previous day value to later show the change on daily basis, I used the DAX you mentioned, however, When its Monday I would like to get the value of friday.
I am new to Power BI and DAX, therefore if possible could you please help me out on this topic.
This is a good use case for making a robust date calendar. See this article to help out with using a day, week, or month index to help shift your calculations around based on date information. https://powerbi.tips/2017/11/creating-a-dax-calendar/
Thank you Mike for the solution. I have been looking for the same from past one week. Kudos to you for the contribution that you are making to make people’s life better.
Thanks a ton !