Category: Building Reports

  • Power BI Direct Query Composite Models = Amazing

    Power BI Direct Query Composite Models = Amazing

    Well Microsoft has done it again. They have added a great feature in the Power BI desktop release for December 2020. Direct Query to Power BI data sources is a thing. As a result, this means we unlock new Architectural patterns.

    Enterprise Modeling

    In the Microsoft Release notes we get a glimpse of our new normal. Previously, Power BI datasets could only direct query certain data sources. Here is a full list of data sources for Power BI Desktop. The Enterprise Sematic model is simply larger view of a data model.

    Sample Direct Query diagram

    Read more about Composite Models on the 2020 Power BI release plan.

    What is a Power BI Composite Model?

    Quick background on Composite Models. A Composite model is a data model. More specifically, a Power BI data model. Typically Power BI models have multiple data sources. Such as, Excel, or SQL server. For certain data sources we load data in one of two ways, Importing, or Direct Query. The Import method loads data into the Power BI file. While, Direct Query leaves the data inside the data source, but sends queries to retrieve data on demand. Learn more about Import and Direct Query in these articles.

    Read more about Composite models from the Microsoft documentation found here.

    Why is this Important?

    When we think of an organization there are likely hundreds of data models. These data models support by many different teams. Each model is solves some sort of problem. As an example, we can think about models developed for Human Resources. The Human Resource model informs the HR team about acquiring new talent, or track an interview process. Other teams such as Engineering track spend or project details.

    Organization Reporting

    Using this method, imagine a user who needs to see data from both human resources and engineering. Thus, a user would need to visit two different reports. Obviously value can given by combining multiple data models. This would enable the creation of a single report using data from both sources.

    Direct Query for Power BI datasets

    Now, lets consider the Enterprise Data model. In the Microsoft documentation this is called the Enterprise Semantic Model. We can think of the Enterprise Semantic Model as storing metadata linking tables of data and storing relationships between tables. Direct Query to PowerBI.com now lets us make models of models.

    From our previous example now consider this architecture.

    Direct Query used on PowerBI.com data models

    Report builders can now create a single model that queries other data models. This provides data from multiple subject matter areas. Thus, enabling a single report to combine data from multiple locations.

    Centrally Managed Models

    Often in larger organizations there will be different teams creating models. This means, you might not have access to modify an Enterprise build model. Again, Direct Query to models to the rescue. As a report author, I want to reuse an existing model. However, I would like to add more data to the model that would enrich my reporting. This may come in the form of a connected excel document. For this architecture consider the following diagram.

    Referencing an Enterprise model and adding supplement data through direct query

    This new architecture is the ultimate success for self service business intelligence. Enterprise governed models can be enhanced by business users. Therefore, providing flexibility while controlling model governance and standards.

    More Architecture thoughts

    Power BI is evolving at a rapid pace. Because of this, Power BI is rapidly becoming one of the key tools. Therefore, more thought to Enterprise Architecture must be considered. Learn more about key architectural decision points in our previous articles, Data Architecture, and The Greater Data Solution.

    Composite Models Conclusion

    These are just some of my initial thoughts on this amazing new world we have. There will likely be many more designs and implementations from the community of Power BI developers. I’m extremely excited to see other patterns emerge from using Direct Query against Power BI datasets.

    Read more from the official blog release and Microsoft documentation:

    If you like the content from PowerBI.Tips please follow us on all the social outlets. Stay up to date on all the latest features and free tutorials.  Subscribe to our YouTube Channel.  Or follow us on the social channels, Twitter and LinkedIn where we will post all the announcements for new tutorials and content.

    Introducing our PowerBI.tips SWAG store. Check out all the fun PowerBI.tips clothing and products:

    Check out the new Merch!

    Hasta La Vista Data
    Go Ahead Make My Data
    PBIX Hat


    Power BI Swag Now Available

    Now you can get your favorite Power BI gear. Visit our PowerBI.tips clothing store to purchase your favorite items.

    Purchase the Power BI mask
    PowerBI.tips Mask
    PowerBI.tips Premium T
  • Building a Power BI Admin View using Power BI APIs

    Building a Power BI Admin View using Power BI APIs

    We just completed an amazing webinar from Parker Stevens over at https://bielite.com/ . In this webinar, Parker walks us through how to connect to the Power BI Admin APIs. The Admin API contains a wealth of knowledge for all activity within your Power BI tenant.

    While there is a good amount of reporting built into the Power BI admin page, you may need more. This is why you would use the Admin APIs to gather all the activity data from within your Power BI. For more information, learn about the Power BI Admin Portal.

    Parker takes us through a deep dive connecting to the Power BI admin apis and shows us how to build a robust dataset ready for Admins to produce the reporting they need.

    Watch the Full Webinar

    If you like the content from PowerBI.Tips please follow us on all the social outlets. Stay up to date on all the latest features and free tutorials.  Subscribe to our YouTube Channel.  Or follow us on the social channels, Twitter and LinkedIn where we will post all the announcements for new tutorials and content.

    Introducing our PowerBI.tips SWAG store. Check out all the fun PowerBI.tips clothing and products:

    Check out the new Merch!

    Hasta La Vista Data
    Go Ahead Make My Data
    PBIX Hat


  • Power BI Field Finder V2

    Power BI Field Finder V2

    The Power BI Field Finder created by Stephanie Bruno was just updated. In this recent update the HTML viewer has been updated since the old custom visual has been deprecated.

    What is Field Finder?

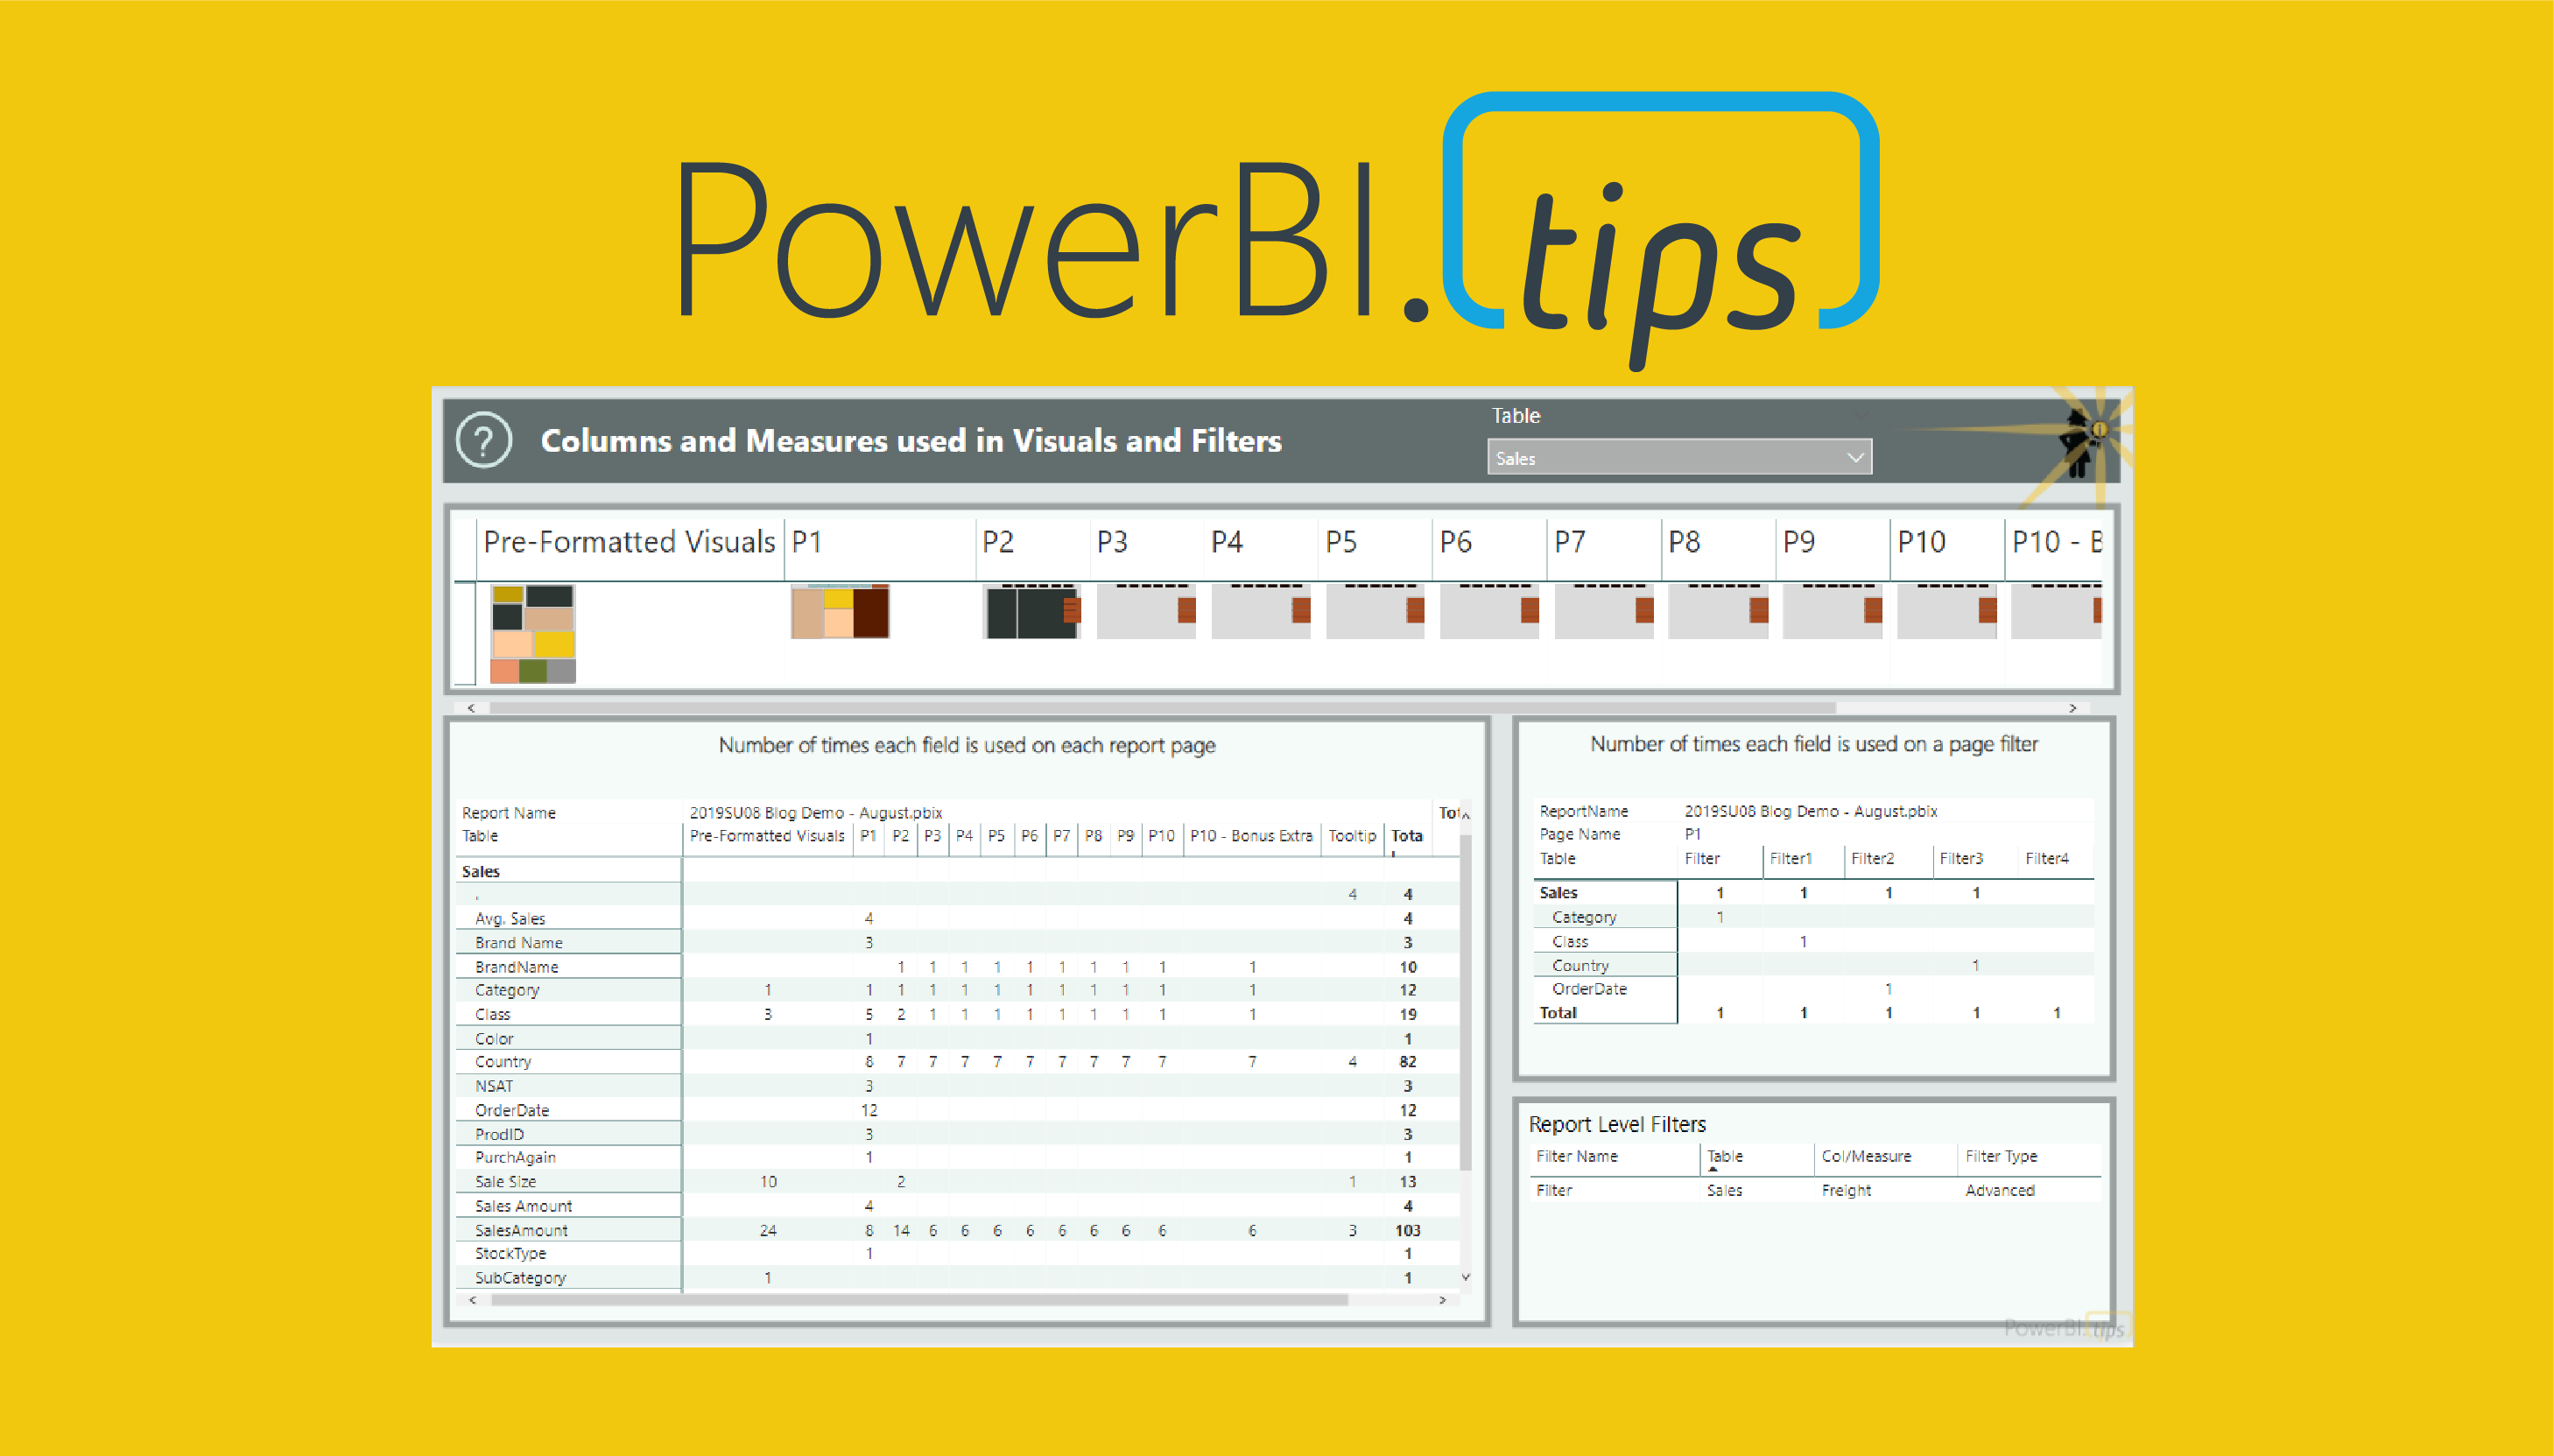
    We are glad you asked. The Power BI Field finder is a tool that can be used to review all the relevant connections between tables, measures and visuals within a report. This solution is easy to use and very informative. Simply point the Field Finder at a PBIX file. Then the Field Finder tool will de-construct all the visual elements of the report and digest them in to one complete data set.

    Why do I need it?

    If you have done any Power BI development over the years, you will notice a pattern.

    • Start building a report
    • Create some measures for a visual
    • Measures don’t work or report needs changes
    • Make more measures
    • Delete and replace visuals
    • Add visual styles and elements requiring additional measures
    • Finally publish report

    After completing this process, which could be over the span of days to months. You will likely have a Power BI report with extra measures or un-needed calculated columns.

    Then you are introduced with a problem, How do I go through and clean up the entire report? Do I need to click on every single visual to see which measures are used?

    Doing this for a page or two you quickly are overwhelmed with tracking all that information. This is where Power BI Field Finder really shines. It handles all of that for you with a couple button clicks.

    Download Power BI Field Finder

    Be sure to download field finder for yourself.

    If you like the content from PowerBI.Tips please follow us on all the social outlets. Stay up to date on all the latest features and free tutorials.  Subscribe to our YouTube Channel.  Or follow us on the social channels, Twitter and LinkedIn where we will post all the announcements for new tutorials and content.

    Introducing our PowerBI.tips SWAG store. Check out all the fun PowerBI.tips clothing and products:

    Check out the new Merch!

    Hasta La Vista Data
    Go Ahead Make My Data
    PBIX Hat


  • Milwaukee Brew City PUG – Oct 2020

    Milwaukee Brew City PUG – Oct 2020

    The Milwaukee Crew is back at it again with the October 2020 Power BI User Group (PUG). This month we have the amazing Gil Raviv talk to us about Power Query and the Enterprise. For those of you who don’t know Gil he is a superb Power Query Expert.

    Gil talks to about Power Query in different enterprise domains. Learn which tools to use and which ones are not quite ready for prime time. You will learn a ton in this great session.

    Watch on YouTube

    Follow Gil

    Be sure to follow Gil Raviv on his website and blog.
    Also I recommend you follow Gil on his LinkedIn page.

    Links Discussed in this Session

    We had many different topics and some links that were shared here are the highlighted links that were discussed in this session.

    If you like the content from PowerBI.Tips please follow us on all the social outlets. Stay up to date on all the latest features and free tutorials.  Subscribe to our YouTube Channel.  Or follow us on the social channels, Twitter and LinkedIn where we will post all the announcements for new tutorials and content.

    Introducing our PowerBI.tips SWAG store. Check out all the fun PowerBI.tips clothing and products:

    Check out the new Merch!

    Hasta La Vista Data
    Go Ahead Make My Data
    PBIX Hat


  • HTML Content Custom Visual

    HTML Content Custom Visual

    Daniel Marsh-Patrick is a custom visual developer who recently released the HTML Content, a custom visual. This month we go over this visual in detail with it’s creator himself.

    While this visual is currently at V1, Daniel shows us a preview of V2 and trust me you will absolutely love it. I’m so looking forward to using this visual in my daily workflow. As well as V2 is going to be amazing.

    Watch the Webinar

    Follow Daniel

    Blog: https://coacervo.co/
    LinkedIn: https://www.linkedin.com/in/daniel-m-p/
    GitHub: https://github.com/dm-p

    If you like Daniel’s work please consider sponsoring him. This way we can continue to get amazing visuals: https://github.com/sponsors/dm-p

    If you like the content from PowerBI.Tips please follow us on all the social outlets. Stay up to date on all the latest features and free tutorials.  Subscribe to our YouTube Channel.  Or follow us on the social channels, Twitter and LinkedIn where we will post all the announcements for new tutorials and content.

    Introducing our PowerBI.tips SWAG store. Check out all the fun PowerBI.tips clothing and products:

    Check out the new Merch!

    Hasta La Vista Data
    Go Ahead Make My Data
    PBIX Hat


  • Customize the Default Dataset

    Customize the Default Dataset

    In the October 2020 release of Power BI desktop you have the ability to load a dataset from the splash page. For this tutorial we dig in on how Microsoft enables a default dataset. Additionally we show you how to customize the default dataset for your needs.

    Quite often I need to prototype a visual, or work on some sample data to design a report. The very first step is always loading some sample data. Now that Power BI desktop comes with a default dataset, we leverage this feature to speed up our development process.

    Watch the YouTube Video

    Additional Thoughts

    In this video I explain that the dataset does not auto load with datatypes enabled. This was due to my default setting within Power BI desktop. If you’d like you can make Power BI Desktop auto detect your datatypes for you.

    This setting can be changed by the following steps:

    • Click on the File button
    • In the drop down menu, Click on the Options and Settings
    • In the menu on the right Click the button labeled Options
    • Under the Global section in the Options menu Select the item labeled Data Load
    • Change the Type Detection for loading data

    If you like the content from PowerBI.Tips please follow us on all the social outlets. Stay up to date on all the latest features and free tutorials.  Subscribe to our YouTube Channel.  Or follow us on the social channels, Twitter and LinkedIn where we will post all the announcements for new tutorials and content.

    Introducing our PowerBI.tips SWAG store. Check out all the fun PowerBI.tips clothing and products:

    Check out the new Merch!

    Hasta La Vista Data
    Go Ahead Make My Data
    PBIX Hat


  • Designing a Great Power BI Report

    Designing a Great Power BI Report

    What does it take to design and create a great looking report in Power BI? Do you have a clear understanding of what tools and techniques you should use every time? Recently the owners of PowerBI.Tips had the pleasure of speaking with Reza Rad’s user group on the fundamentals we use to build great looking reports every day.

    This presentation focuses on the basic concepts and things we do for every report. This one isn’t about all the unique features we love talking about leveraging, but rather the nuts and bolts that you can use to make every report shine.

    Key Concepts

    We’d invite you to join us by watching the video where we cover these fundementals in depth.

    1. Discover insights. Who is your audience and what questions can you ask to drive into those key metrics
    2. Define and outline the process for developing key visuals based on those insights
    3. How can you create and use a background to enhance the look & feel of your report
    4. Creating a consistent theme that you can re-use again and again
    5. Using tools like Themes, Scrims or Layouts to help you make this experience more achievable

    Designing a Great Power BI Report

    If you like the content from PowerBI.Tips please follow us on all the social outlets. Stay up to date on all the latest features and free tutorials.  Subscribe to our YouTube Channel.  Or follow us on the social channels, Twitter and LinkedIn where we will post all the announcements for new tutorials and content.

    Introducing our PowerBI.tips SWAG store. Check out all the fun PowerBI.tips clothing and products:

    Check out the new Merch!

    Hasta La Vista Data
    Go Ahead Make My Data
    PBIX Hat


  • One Tool to Install them ALL

    One Tool to Install them ALL

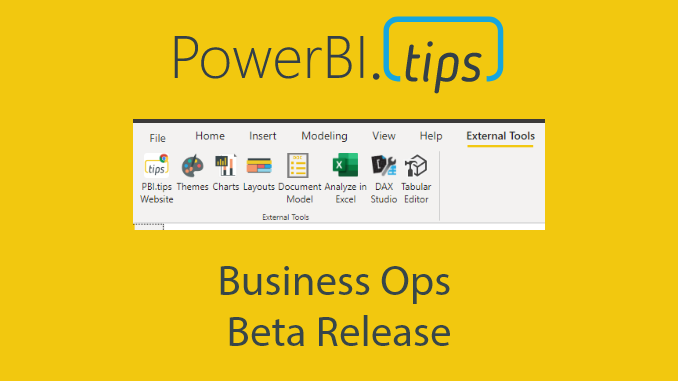
    We are excited to announce a new tool from PowerBI.tips The Business Ops tool. To get this tool Download it here.

    For the Full Story Read on..

    There are many exciting features that we love to see and share when it comes to monthly Power BI releases! The continual improvements still inspire and provide a deeper and richer experience for us all to WOW our report consumers. There are some periodic major changes that come, and we think one of those has arrived with the latest announcement of 3rd party tool integration.

    Add PowerBI.tips Front End tools

    After the great news above, we had our heads down looking at the documentation and were very interested in how we could add our own tools to the External Tools section. After some digging, and reviewing a fantastic blog by Eric Svensen we locked in on how we could our tools even more accessible for you!

    We want to help you get to your favorite PowerBI.tips tools quickly and easily. What follows is what each of these tools offers, and how to easily connect one or all into your Power BI Desktop files for quick connection and use.

    I don’t see “External Tools”

    The first requirement to see the External Tools section is that you must be on July 2020 Desktop. You will NOT see the External Tools section right after you open it. The reason for that is varied, but suffice to say, you need a specific JSON folder created in your Power BI folder structure and an executable to run.
    We’ve made this easy for you, so just read through our choices of tools and we’ll walk you through how to get these buttons created and working for you in no time!

    Tool Choices

    PowerBI.tips – Part of staying engaged is staying current. What better way to do that then start everyday with a link to your favorite site – Power BI.Tips

    Themes – Need to take the general settings you can do in the Desktop to the next level? Adding our Themes capability into your reports gives you full control over the customization of color, font and properties.

    Charts – Utilizing the amazing work from MSFT research in Charticulator, we’ve created a version called Charts. This tool lets you build no code custom visuals that work right alongside the out of the box one’s. Check out our videos if this is new to you!

    Themes Gallery – Sometimes you just need to find a little inspiration. Look no further than our extensive gallery of color themes. Easily pick and download any color theme you find.

    Themes Gallery

    Charts Gallery – Learning how to build the custom visuals in Charts takes a little bit of time, but while you are learning that craft, or are looking for a unique visual check out the gallery of already built custom visuals you can integrate into your reports.

    ChartsGallery

    Layouts – Need to take your report look and feel to the next level? Our Layouts provide some of the best looking backgrounds tailored specifically to Power BI. We use pop up dialogues for contextual explanation, page navigation and hidden slicer functionality to amaze your end users.

    Scrims – Backgrounds for Power BI. We take all the principles we’ve learned in visual design to create amazing visual canvases that don’t distract from the data. Using these single images reduces the need to render all the different shapes and objects on your page making it a faster/better option.

    Model – Are you a data focused individual? Have you played with Power BI dataflows? Use our Model tool to create the metadata objects you want to utilize in your Common Data Model.

    Connections – Streamline your report files for other report authors by pre-configuring the data source connection. Not familiar with how you create PBIDS files? Check out our tutorial.

    Lingo – In 2018 Power Bi introduced the ability to edit the linguistics schema for enhancing your Q&A experience. This tool gives you a clean and simple interface to create and modify your schema.

    Pick Your Browser

    We know our favorites, but you probably have yours as well. Throw in a dash of IT security and you might not have the best experience with a chosen browser. As we know that is the case, you can choose one of our 3 options for kicking off these tools from the Desktop and opening the right browser.

    Install Your Favorites!

    Featured External tool tutorials

    Want to know more about the featured tools in the MSFT blog? We had the chance to welcome the creators of those tools to tell us all about them. Be sure to check out the webinars for all the details on how to get started with them and all the capabilities they offer.

    ALM Toolkit – Schema compare and deployment tool. Fantastic for Application Lifecycle Management (ALM). How to use ALM Toolkit.

    DAX Studio – The only DAX authoring tool you will ever need. 5 part series that explains it all.

    Tabular Editor – An amazing modeling tool that makes working with your model a breeze. 4 part series.

    If you like the content from PowerBI.Tips please follow us on all the social outlets. Stay up to date on all the latest features and free tutorials.  Subscribe to our YouTube Channel.  Or follow us on the social channels, Twitter and LinkedIn where we will post all the announcements for new tutorials and content.

    Introducing our PowerBI.tips SWAG store. Check out all the fun PowerBI.tips clothing and products:

    Check out the new Merch!

    Hasta La Vista Data
    Go Ahead Make My Data
    PBIX Hat


  • Monkey Tools are AWESOME

    Monkey Tools are AWESOME

    The Monkey Tools add-in for excel is really amazing. As a developer for Power BI for many years I’ve learn a ton of tips and tricks while working with Power Query. Watching Ken demo the high level of automation that Monkey Tools really blew my mind. How did I not know about this tool earlier?! My development patterns have now forever changed.

    This presentation for Monkey Tools is presented by it’s developer MVP Ken Puls. Ken is a staple and expert in the Excel community. Not to mention, he is an incredible presenter. You will enjoy this session from Ken.

    What are Monkey Tools?

    Monkey tools in short is a simple way to automate data modeling within Excel. There are some incredibly helpful portions such as making date calendars, changing how data is handled during Power Query loading process and many more.

    Ken gives us a great overview and starts digging into the amazing features of this tool in this two part series about this tool.

    Download Monkey Tools Here

    Intro to Monkey Tools – Part 1

    Intro to Monkey Tools – Part 2

    Follow Ken

    Blog: https://xlguru.ca/blog
    Facebook: https://facebook.com/xlguru
    Twitter: https://twitter.com/kpuls
    Linkedin: https://linkedin.com/in/kenpuls

    Training

    Online Training: https://Skillwave.training

    Book by Ken

    Master Your Data with Excel and Power BI: https://amzn.to/2PyheVm
    M is for (Data) Monkey: https://amzn.to/30BElov
    RibbonX: Customizing the Office 2007 Ribbon: https://amzn.to/3fzPDh1

    Download Monkey Tools

    https://xlguru.ca/monkeytools

    If you like the content from PowerBI.Tips please follow us on all the social outlets. Stay up to date on all the latest features and free tutorials.  Subscribe to our YouTube Channel.  Or follow us on the social channels, Twitter and LinkedIn where we will post all the announcements for new tutorials and content.

    Introducing our PowerBI.tips SWAG store. Check out all the fun PowerBI.tips clothing and products:

    Check out the new Merch!

    Hasta La Vista Data
    Go Ahead Make My Data
    PBIX Hat


  • Analyze in Excel – the Advanced Method

    Analyze in Excel – the Advanced Method

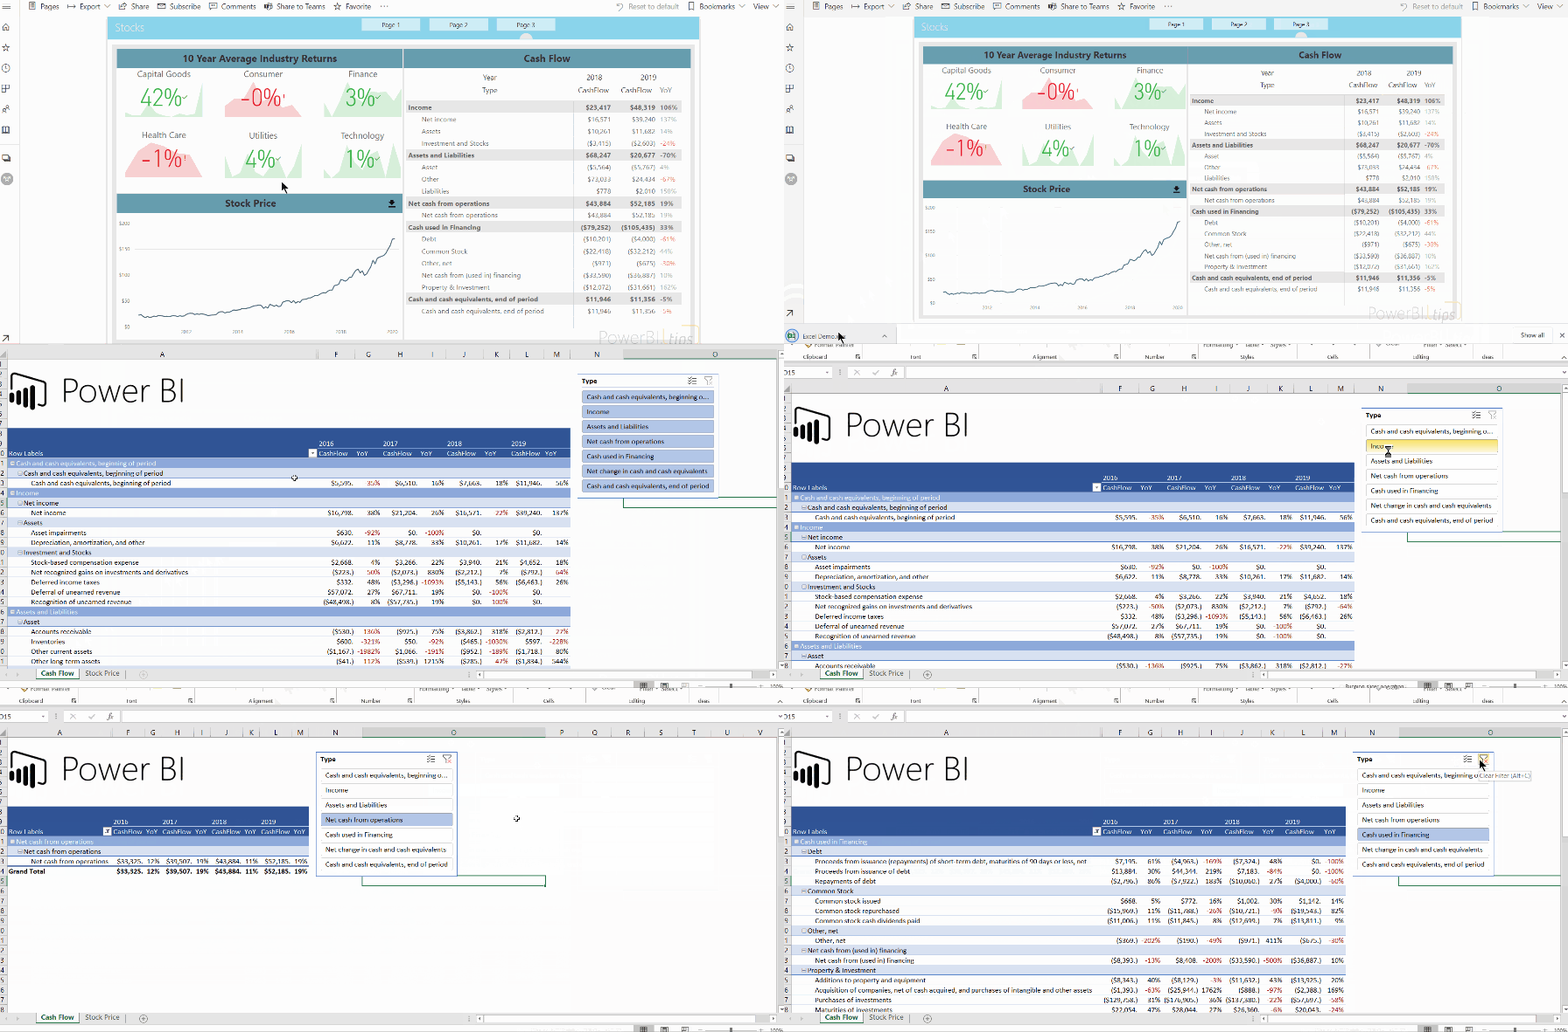
    A common ask from users is the ability to view data related to visuals in excel. While there is an option to export data, the format is often unfriendly and has limitations. What’s more, this data becomes disconnected and is not updated if a user looks at after the data is refreshed.

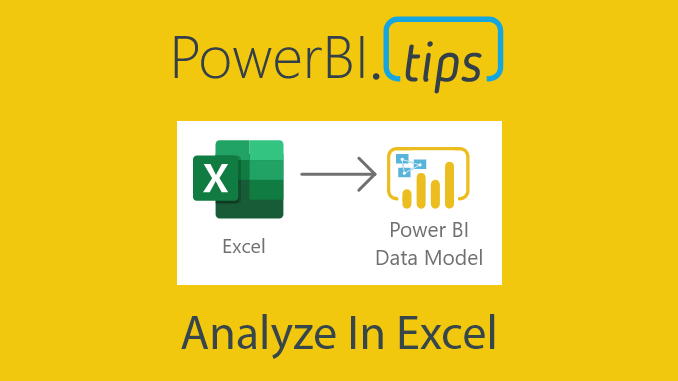
    This post will explore a way to add a pre-built excel report that can be designed in advance with company branding and advanced features or VBA. Additionally, it will be linked to the report’s data model via live connect. This means it will continue updating if reopened, as well as maintaining Row Level Security.

    End Result

    The end result will be a download button that can open a well designed excel report.

    Video

    This content was demonstrated at the Milwaukee Brew City User Group in February 2020. You can watch the video recording and see the steps detailed below.

    Step 1 – Connect to Excel

    There are two ways to connect:

    Option 1:
    This option may not be available to you depending on your office license.

    Open Excel and navigate to the data tab. Click Get Data the select “From Power BI dataset”.
    From the list, select the report that contains the model.

    Option 2:

    The other way is to navigate to the service (app.powerbi.com) and open the report that contains the model. Click the ellipsis and select Analyze in Excel.

    This will download a file which has the extension “ODC”, which stands for Office Data Connection. This file contains information that will tell excel how to connect to the dataset on the service.

    For more information, see:
    https://docs.microsoft.com/en-us/sql/reporting-services/report-data/use-an-office-data-connection-odc-with-reports?view=sql-server-ver15

    Click on the file to open in excel. Once opened, Excel will present you with an empty PivotTable. If you check the PivotTable fields you will notice that you can now see the fields and measures. The same ones which were created in your Power BI model.

    We have now live connected to the model we have published in Power BI service. This works the same as using a live connection in Power BI. Your Excel file has access to all the logic and data is updated as soon as the model is updated. Refreshing the data source in Excel pulls the latest data directly from the Power BI model.

    Step 2 – Develop a report

    The PivotTable in the report is an OLAP (Online Analytical Processing) PivotTable and has a few differences from standard PivotTable made from flat data.

    Just like Power BI, dimensions from multiple tables can be used in the same PivotTable. The relationships set up in the model will be observed.

    Only explicit measures may be used in the VALUES section of the PivotTable. This means that unlike Power BI, you cannot drag a numeric column into VALUES and select a summarization (also known as an implicit measure). All values must have a specific measure written in the model file (or use an extension OLAP pivot table tools).

    The PivotTable sends a new query each time some element in Excel is changed. For example, if you apply a filter, Excel will send a new query to the model. This works similar to the Direct Query mode in Power BI.

    Now we have a connection set up, you can make a pre-defined report that you can give directly to your end users.

    You can add a slicer by clicking on the PivotTable, click on the PivotTable Analyze tab and select Insert Slicer (or use Timeline for dates).

    There are many advantages of using a live connection.

    • The Excel file can be branded with company logos
    • Pre set filters can be added.
    • More advanced features such as Data Solver, VBA and macros can be added.

    In addition, the data can be updated inside the workbook, or set to be refreshed on open. Users will also be prompted to sign in and authenticated through their Office account. Features such as Row Level Security will continue to work.

    Keep it FRESH

    You can set the report to refresh every time it is opened. Navigate to the Data tab and click “Queries and Connections”.

    There will be one query, usually starting with pbiazue://. Right click this query and select properties.

    From here you can enable “Refresh data when opening the file”.

    Step 3 – Upload the excel

    Now, that the excel is created, you can distribute it to end users. A helpful way is to create a download link directly in the report.

    A good place to host this would be SharePoint – you can link a SharePoint site directly to the Power BI workspace. It is secured through Active Directory, plus if users are already logged into Power BI they do not need to sign in again.

    First, navigate to the online SharePoint location where you wish to host and upload your excel file.

    Next, right click the file, and select download. This will download the file back to your local machine.

    Now, navigate to your browser’s Downloads page. You can access through the settings of the browser, or if you are on a Windows machine, most browsers you can use the shortcut Ctrl-J. From here you will see the file you just downloaded. Right click the link and select what resembles “Copy link”. This may vary depending on the browser:

    Chrome:

    Edge:

    Firefox:

    Save the link you have copied to be used later.

    Step 4 – Adding to the Report

    For my download button, I am just using a down arrow image which I downloaded from an open license image site


    In Power BI Desktop, open the Insert tab and select Image. Select the image you wish to insert.

    After it has been added, select the image and open the visualizations pane.
    Turn on Action and change type to web URL.
    Then paste in the URL (the direct download from SharePoint) you saved earlier.

    To tidy it up, I will add it next to the related visual. My visual has a text box above it. I have left some white space for a download button.

    Step 5 – Using the button

    Now, users can navigate to the report and click the download button. This will download the pre-built excel file. Users will be required to sign in and Row Level Security will still apply. In addition, users can use the “Refresh” button in the data tab to refresh data directly from the connected report.

    Due to this being a Live Connection users will be required to enable content. In addition, they will need to sign into excel so that they can authenticate to the data model.

    Tips and Tricks

    • Large tables will still need to send DAX queries for each value, so make sure the DAX is efficient.
    • If using CUBE formulas, these are sent as individual queries to the model. Try to use a single pivot table rather than multiple formulas where possible.
    • Slicers are useful, but can slow down reports, especially if you have many. One way you could speed it up is by right clicking on the slicer and going to slicer settings. Then untick “Visually indicate items with no data”. This will now always show all items in the slicer – even if there is no data associated with it. While this is less helpful, it can often dramatically speed up reports.’
    • Download OLAP PivotTable Extensions (https://olappivottableextensions.github.io). This is an amazing extension that can help see information about OLAP PivotTables. The functions are detailed on the website, but two features which are worth calling out:
      • Ability to see MDX query – this shows the query that is sent to the cube for the PivotTable
      • Ability to add calculations – you can add measures (written in MDX) to the specific PivotTable without having to add it to the cube

    If you like the content from PowerBI.Tips please follow us on all the social outlets. Stay up to date on all the latest features and free tutorials.  Subscribe to our YouTube Channel.  Or follow us on the social channels, Twitter and LinkedIn where we will post all the announcements for new tutorials and content.

    Introducing our PowerBI.tips SWAG store. Check out all the fun PowerBI.tips clothing and products:

    Check out the new Merch!

    Hasta La Vista Data
    Go Ahead Make My Data
    PBIX Hat