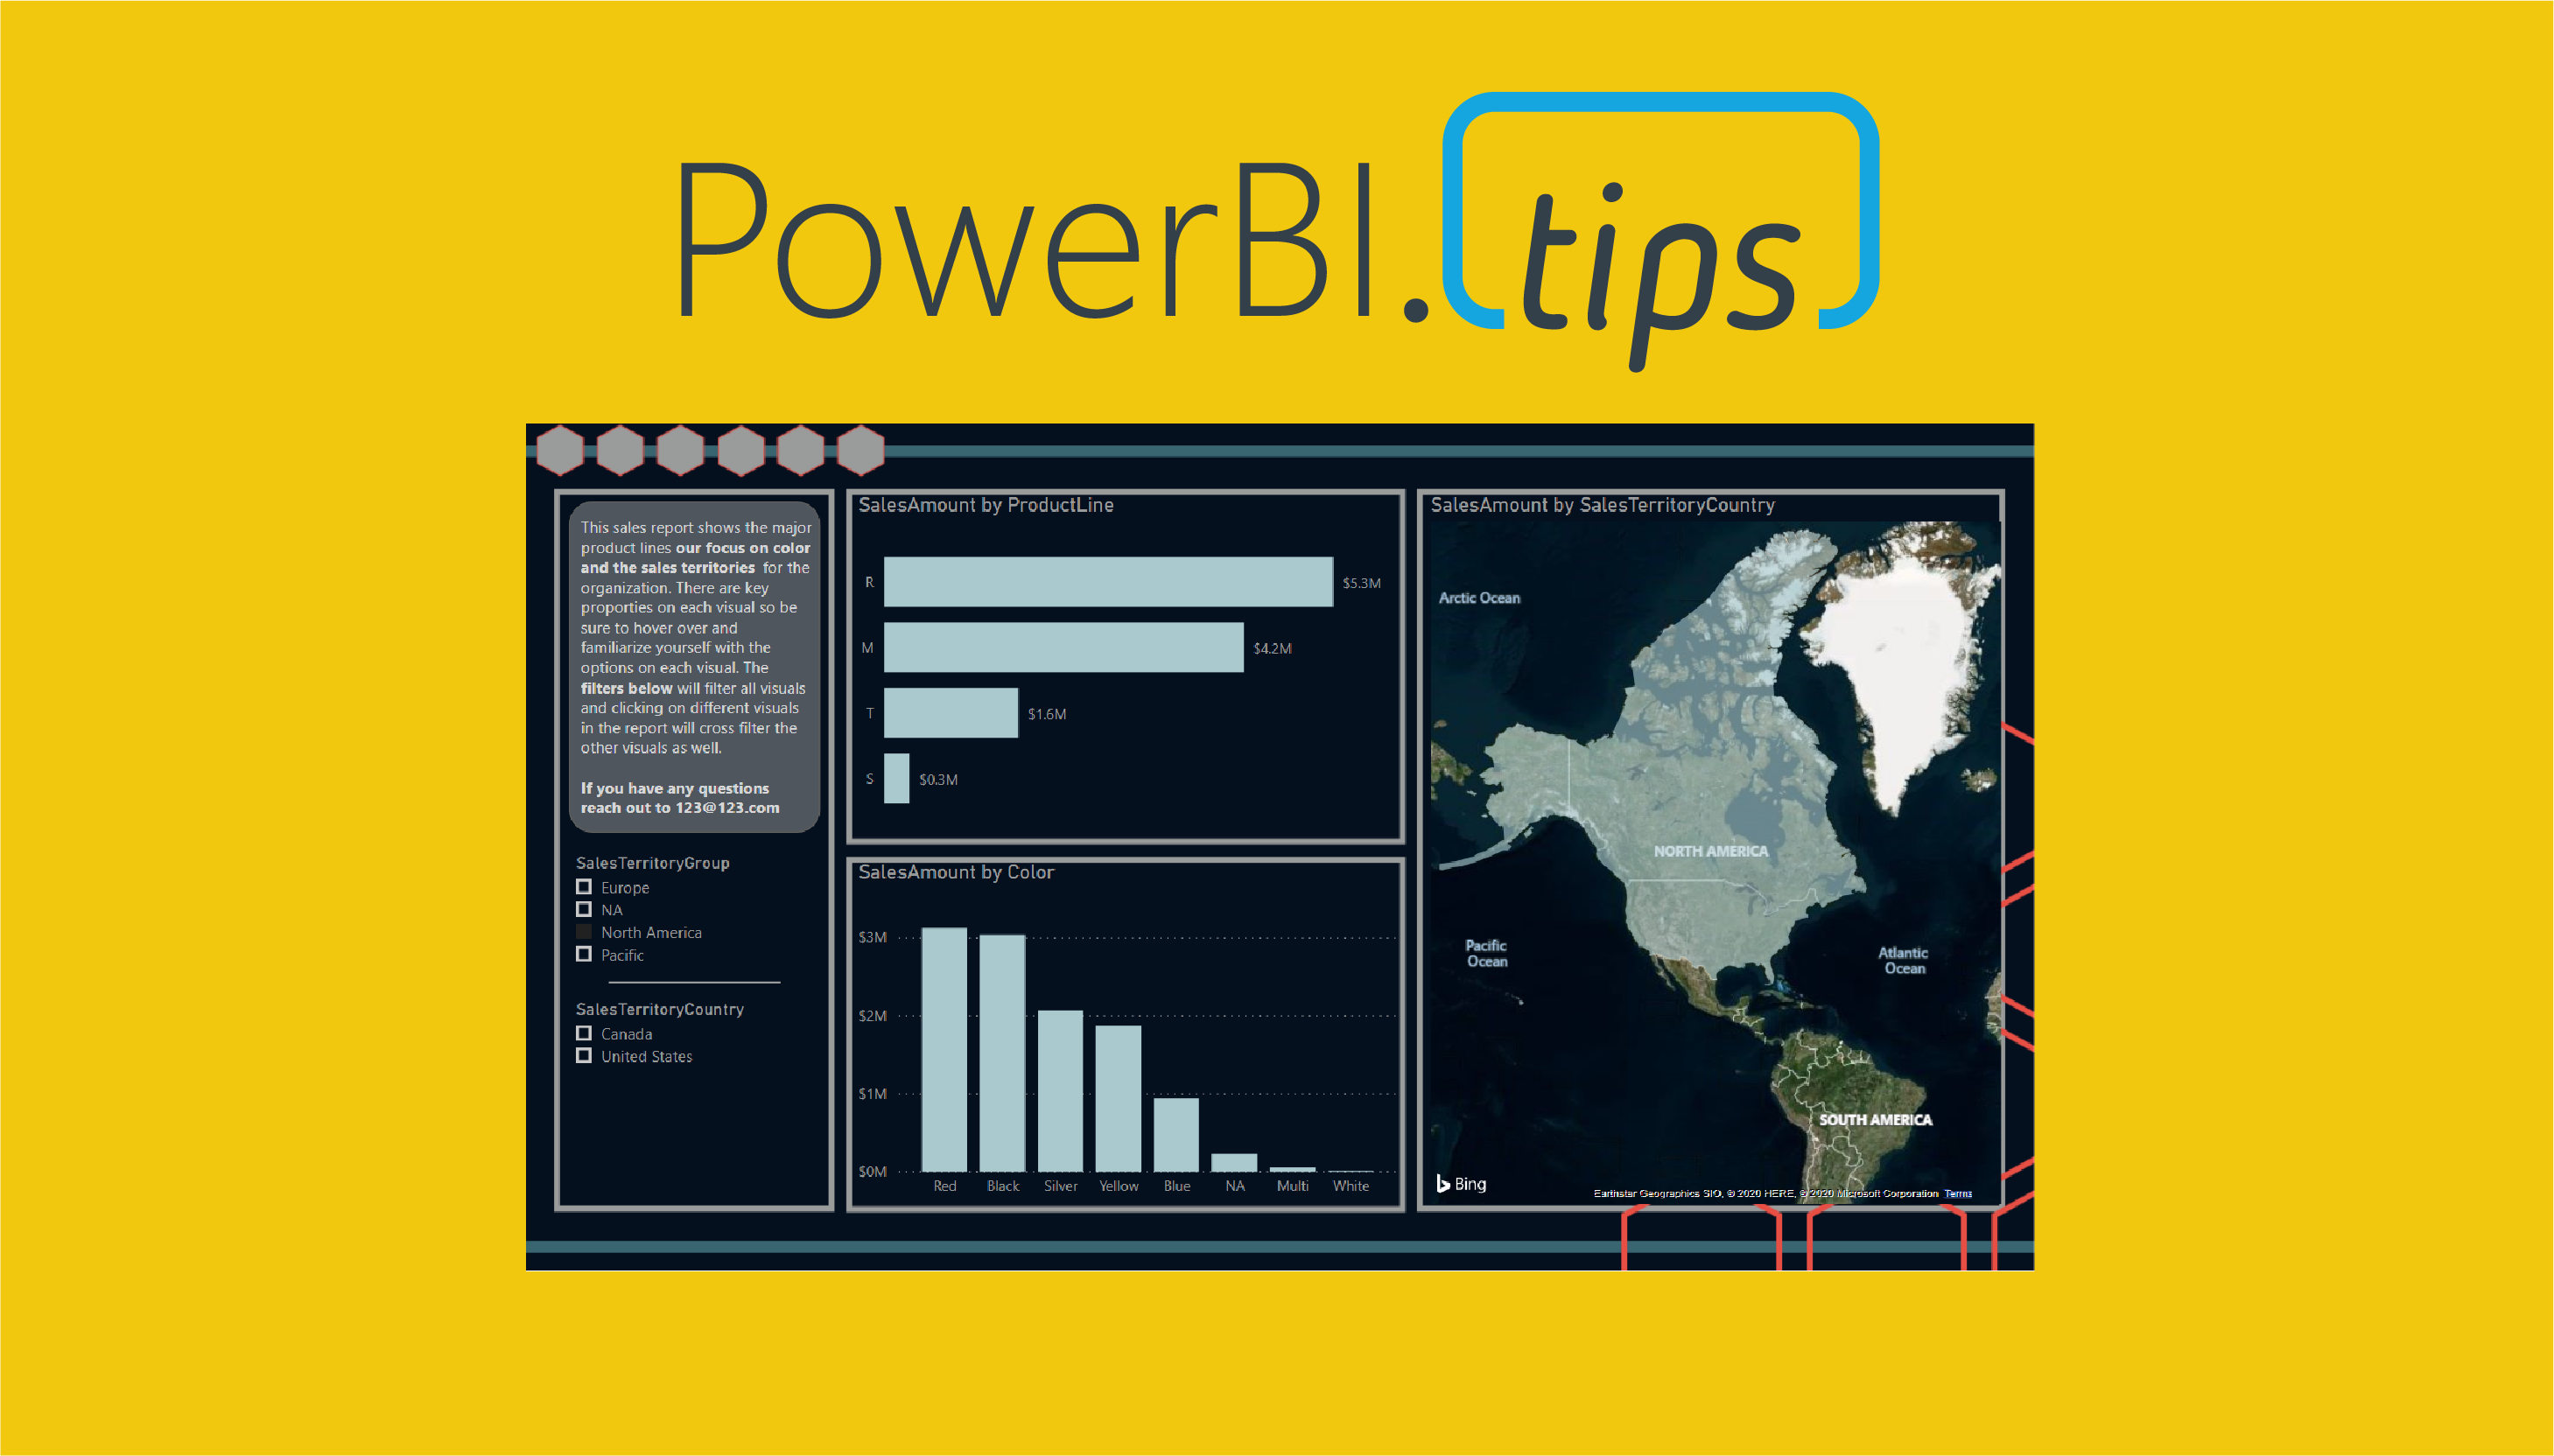
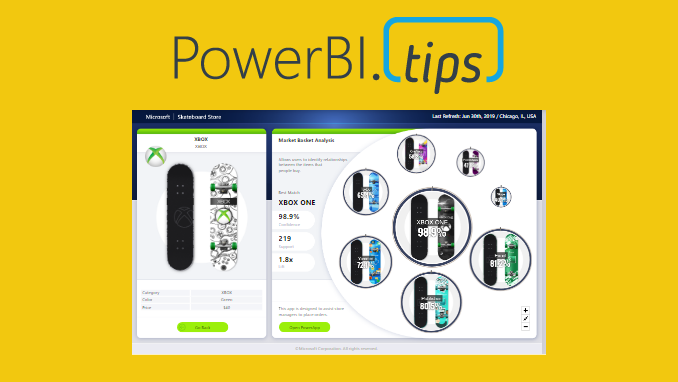
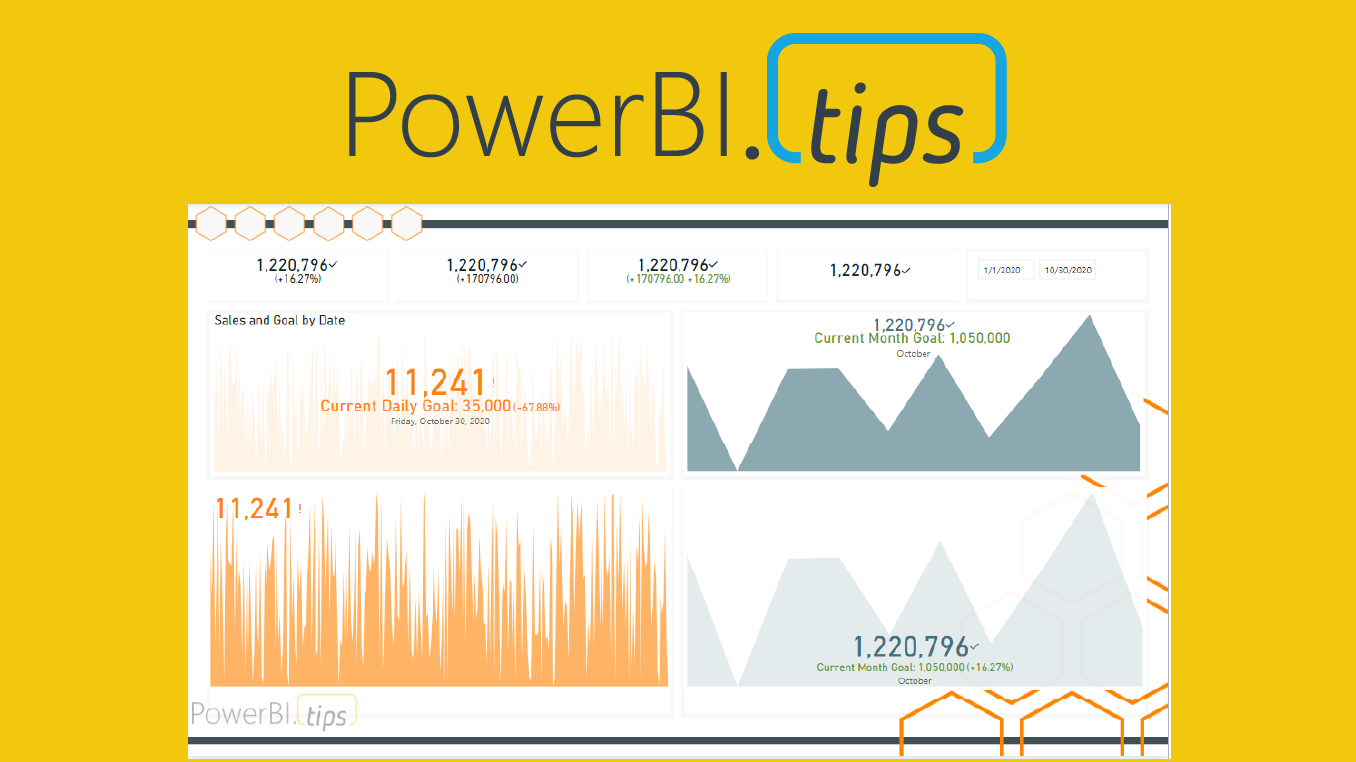
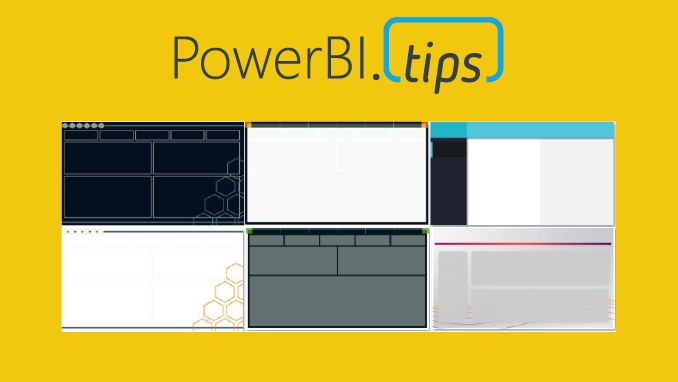
Report Visualization Tips

Keeping it Versatile

I was recently working on some new ideas for a Scrim when I stumbled upon something interesting. A scrim is pretty specific in its layout, and this one is no different. The images are set […]

Report Visualization Tips

Mind Blown

This report is just over the top amazing cool! Check out the work done by the Microsoft team to make this incredible report. It is called the Microsoft Sales & Returns report. We love this […]

Report Visualization Tips

Layouts for Company Templates

Recently I had the privilege of working with Microsoft doing a Webinar on layouts. One thing we are passionate about at PowerBI.Tips is good looking reports that drive action. Often as report authors we spend […]

PowerBI.Tips Tools

No Code Custom Visuals – Webinar

This month we did a webinar with the Microsoft team on how to build different custom visuals in Charts.PowerBI.Tips a version of Charticulator. If you haven’t seen Charts.PowerBI.Tips this video explains the program, all the […]

Report Visualization Tips

KPIs in Power BI

KPIs are a key visualization type used to convey high level metrics to the end users. They provide an at-a-glance metric that allows business users to know whether they are on track or off-track. Over […]

Introducing Scrims
PowerBI.Tips Tools

Introducing Scrims

PowerBI.tips is excited to announce our new tool to help you build the best looking reports, Scrims. We’ve built out a fast and easy solution for snapping visualizations into place while giving your reports the […]