Month: February 2020

  • Adding Contextual Help for End Users

    Adding Contextual Help for End Users

    As a report author it is important that you build the necessary context for your end users. The main areas most often needing context either relate to the data or functionality contained within the report. The battle of space, usability and design all impact the choices we have. Lucky for us, Power BI has many different options and we have plenty of choices. This video will walk through the following options and explain methods on how to use them.

    • Text on Page
    • Visual Header Tooltip
    • Button or Image for
      • The Overlay
      • A Different Page
      • A Different Report

    If you like the content from PowerBI.Tips, please follow us on all the social outlets to stay up to date on all the latest features and free tutorials.  Subscribe to our YouTube Channel, and follow us on Twitter where we will post all the announcements for new tutorials and content. Alternatively, you can catch us on LinkedIn (Seth) LinkedIn (Mike) where we will post all the announcements for new tutorials and content.

    As always, you’ll find the coolest PowerBI.tips SWAG in our store. Check out all the fun PowerBI.tips clothing and products:
    Store Merchandise

  • Mind Blown

    Mind Blown

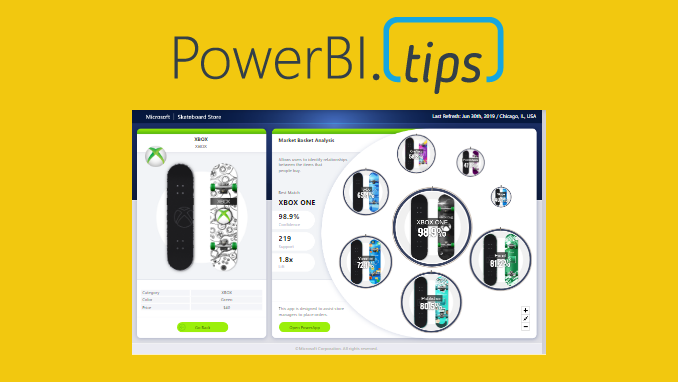
    This report is just over the top amazing cool! Check out the work done by the Microsoft team to make this incredible report. It is called the Microsoft Sales & Returns report. We love this one so much we have produced over 48 HIGH RESOLUTION scrims based on this report design. Download all of them for free.

    Download Scrims

    Here is the link to the Scrims for this report: https://powerbi.tips/product/scrims-msft-skateboard-report-free/

    Download a copy of this report to play with it: https://github.com/MikeCarlo/Msft-Skateboard-Report

    Sample Report

    Scrims

    Not sure what a scrim is. Check out the following page to learn about a scrim and how to use them for your reports.

    Learn about Scrims

    Instructions on how to use a Scrim

    If you like the content from PowerBI.Tips please follow us on all the social outlets. Stay up to date on all the latest features and free tutorials.  Subscribe to our YouTube Channel.  Or follow us on the social channels, Twitter and LinkedIn where we will post all the announcements for new tutorials and content.

    Introducing our PowerBI.tips SWAG store. Check out all the fun PowerBI.tips clothing and products:

    Check out the new Merch!

    Hasta La Vista Data
    Go Ahead Make My Data
    PBIX Hat


  • Power Query API Considerations

    Power Query API Considerations

    This article is the second part in a series on API calls. It will look at some best practices and considerations when using API calls in Power Query. While it does not serve as a definitive list, it is an important start to consider performance when using such queries.

    The articles in the first part of the series can be read here:

    Historical Stock Price Function in Power Query

    Average Household Income Function in Power Query

    Performance Considerations

    Use Batch Queries where possible

    Batch queries refer to sending information in “batches”. Making an API call requires information to be sent to an external source, that information returned, then the information parsed and then loaded. Imagine we are doing this for thousands of different dimensions. Consequently, you will have the exact same process to be repeated this many times. Instead, check in the API documentation if batch queries are available. As a result, you may be able to send many of the dimensions in the same API call. This will drastically reduce the amount of times this process happens.

    Use Data Factory

    Data Factory is an Azure service that offers no/low code solution to Extract, Transform and Load (ETL) or ELT (Extract Load, Transform) processes. These are called “pipelines”. Pipelines are repeatable processes that allow you to copy and move data from one source to another (read the documentation here).

    Let’s say you’re trying to load a high level of stock data for thousands of stocks. By doing this in Power Query may put big stress on your gateway. Your gateway may get overloaded and cannot handle sending so many complex API calls. It may be a better idea to load the data into a separate table (such as Azure Synapse). Then your power BI report can read this file directly. Read this documentation for a good overview of this architecture.

    Shifting this to the Azure cloud can leverage Data Factory’s auto-scalability and ability to handle large volumes of data. This results in a more reliable and robust process.

    Consider the most efficient design

    Always consider the way that will send the least number of queries. For example, if you are using historical data that doesn’t change, think if you need to refresh this data every day. In addition, try and avoid sending the same information multiple times. Do queries off unique lists.

    Only return the correct data

    If you load data into Power Query from a source such as SQL Server and then remove columns, a process called Query Folding will take place. Essentially, the data isn’t even loaded into Power Query – it edits the SQL query to not include these columns.

    This can only be done on certain sources. Custom APIs will not do this. Therefore, make sure you send the correct queries. Don’t return extra bits of data that is not needed and make sure you only return columns you will use.

    Review

    While this is by no way a definitive list, it should serve as a starting point to acknowledge performance considerations. Pay attention to how many queries are sent out and try to limit duplication. Remember, Power Query is a powerful tool, but make sure you are using the right tool for the job. Very large and complex operations can be improved with the help of other tools, such as Data Factory.

  • Milwaukee Brew City PUG – Jan 2020

    Milwaukee Brew City PUG – Jan 2020

    Here we are, jumping in to 2020. This Month PowerBI.Tips is kicking off and sponsoring the next year of Power BI user groups (PUGs) for Milwaukee. If you are not participating in your Local Power BI User Group we highly recommend that you get plugged in. Power BI User groups are intended for like minded Power BI individuals to get together and learn from each other.

    If you don’t have a User Group you can follow along with our group. We record each user group and post the highlights from the 2 hour event. This month we go over the top three most popular blog posts from 2019. Then we demo creating a Paginated report in from a PowerBI.com dataset. Finally we publish the Paginated report into the PowerBI.com service for end users.

    Grab Your Popcorn and Watch

    Highlights from the Milwaukee Brew City PUG:

    Become a Member of the Milwaukee Brew City PUG here.

    Get Connect to your User Group

    To find a Power BI User follow this link.

    Find a 2020 Power Platform World Tour Event near you.

    If you like the content from PowerBI.Tips please follow us on all the social outlets. Stay up to date on all the latest features and free tutorials.  Subscribe to our YouTube Channel.  Or follow us on the social channels, Twitter and LinkedIn where we will post all the announcements for new tutorials and content.

    Introducing our PowerBI.tips SWAG store. Check out all the fun PowerBI.tips clothing and products:

    Check out the new Merch!

    Hasta La Vista Data
    Go Ahead Make My Data
    PBIX Hat


  • Layouts for Company Templates

    Layouts for Company Templates

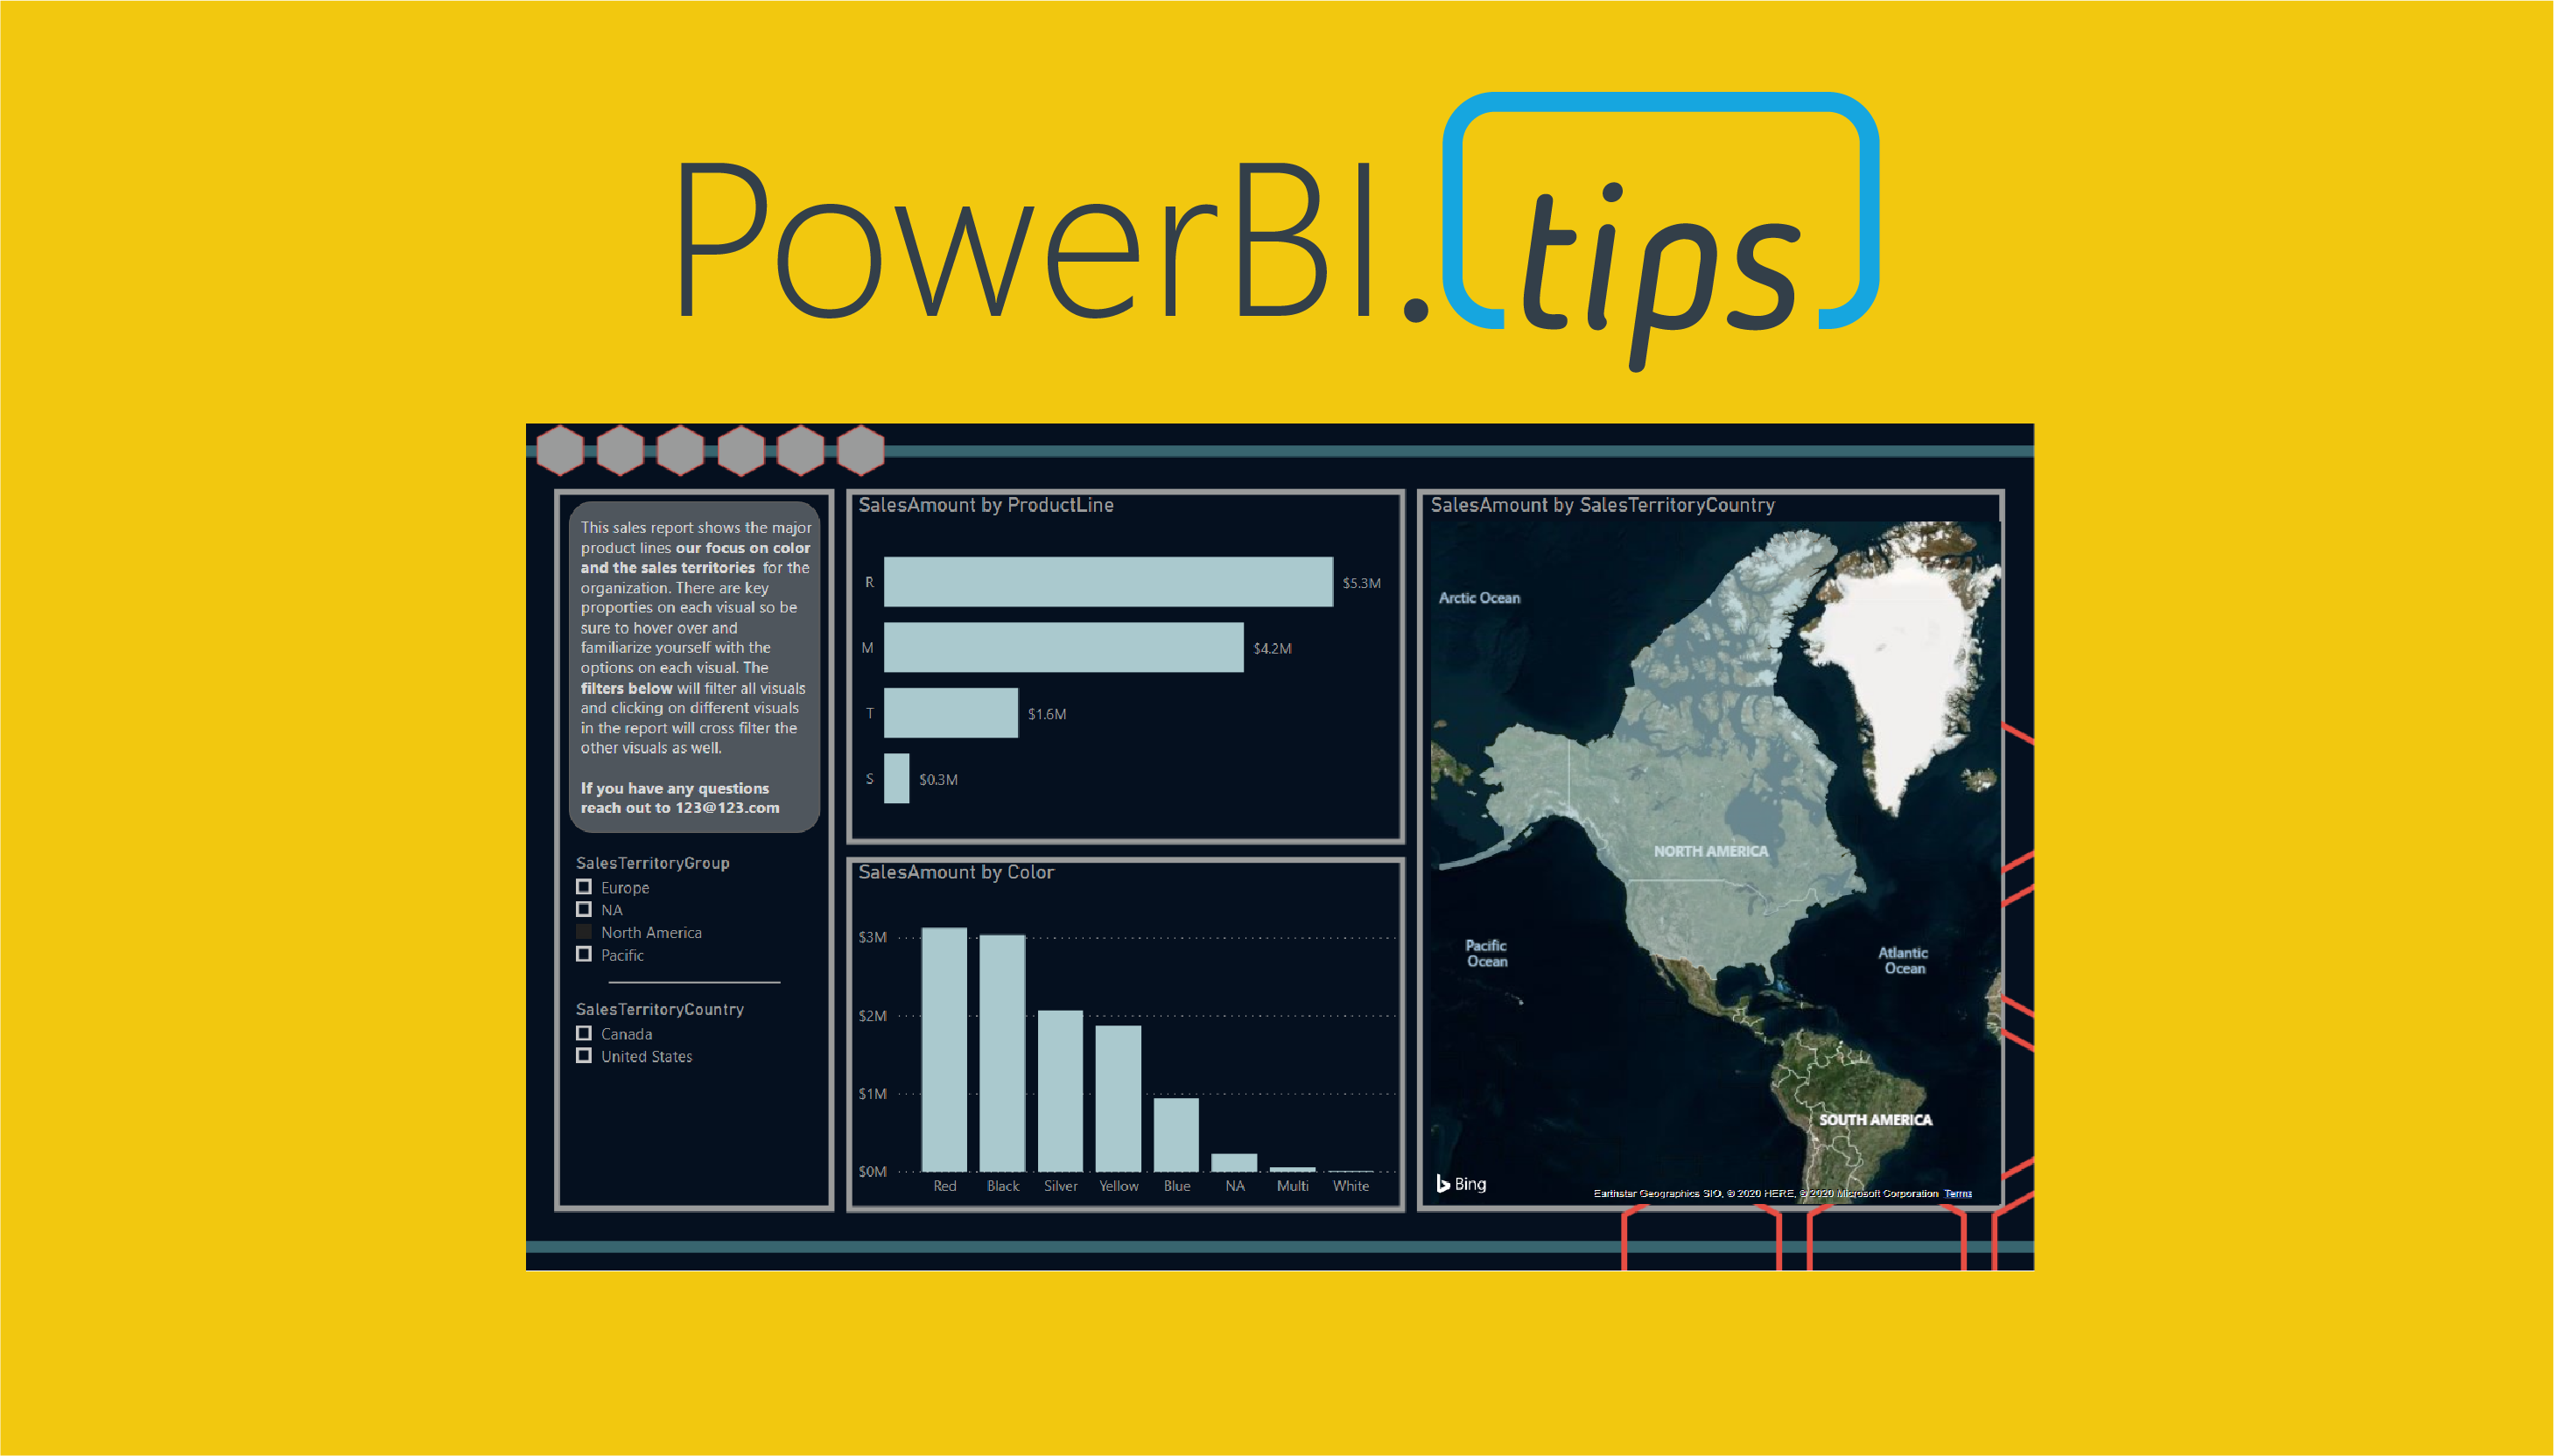
    Recently I had the privilege of working with Microsoft doing a Webinar on layouts. One thing we are passionate about at PowerBI.Tips is good looking reports that drive action. Often as report authors we spend a ton of time working on the data model, and the calculations. While these things are important, we must also consider the user experience.

    You may have the most compelling report but lack some visual appeal. Alternatively we might have a great looking report but the navigation or interactions is un-intuitive. We then are spoiling the impact power of our report.

    Use Layouts

    This is where we feel our layouts make a great fit. It provides a shortcut to provide excellent looking reports on top of your existing data model.

    To learn more about layouts and how to use them, check out this video from the Microsoft Power BI YouTube Channel.

    Download Layouts

    Get your hands on some layouts now and try them out. Check out the downloads below.

    Want a Layout without the PowerBI.Tips Branding. Check out these paid layouts.

    If you like the content from PowerBI.Tips please follow us on all the social outlets. Stay up to date on all the latest features and free tutorials.  Subscribe to our YouTube Channel.  Or follow us on the social channels, Twitter and LinkedIn where we will post all the announcements for new tutorials and content.

    Introducing our PowerBI.tips SWAG store. Check out all the fun PowerBI.tips clothing and products:

    Check out the new Merch!

    Hasta La Vista Data
    Go Ahead Make My Data
    PBIX Hat