The End of Analytics – Ep. 208
Analytics stacks are great at producing dashboards. They’re not always great at producing decisions—and they’re even worse at learning from those decisions.
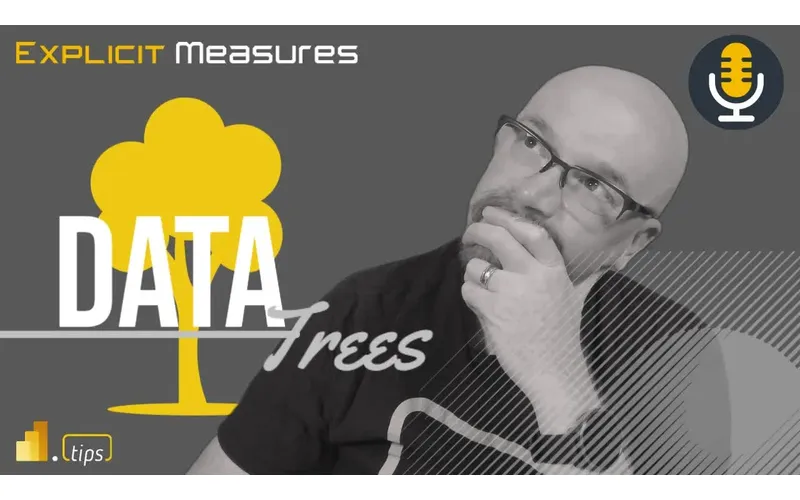
In Ep. 208, Mike, Tommy, and Seth react to Part 2 of the Super Data Blog’s “Future of Business Intelligence” series, which argues that the old one-way “analytics supply chain” is breaking down. The alternative metaphor is a data tree: strong roots and a shared trunk (metrics + platform) with branches and leaves (teams + products) that generate insight at the edge and feed it back into the system.
News & Announcements
-
The Future of Business Intelligence (Part 2) — Super Data Blog — The reading for this episode: the “data tree” metaphor, why feedback loops matter, and what a balanced Wave 3 might require.
-
Suggest a topic for Explicit Measures — Send the crew an idea (or a spicy take) for a future discussion.
-
Subscribe / episode archive — All episodes and links in one place.
-
Argus PBI — A “friend of PowerBI.tips” resource worth checking out if you live in Power BI all day.
Main Discussion
The article’s core argument is that the Wave 2 model of analytics—move data downstream, publish dashboards, call it done—creates a lot of output but not enough learning. A one-way supply chain doesn’t naturally produce the thing most organizations actually need: tight feedback loops that continuously improve definitions, decisions, and behavior.
The proposed Wave 3 metaphor is a living system: roots (source systems), a trunk (platform + shared metrics), branches (domains), and leaves (data products like dashboards, datasets, apps, and models). The key shift is that insight is generated at the edge and then circulated back so the trunk gets stronger over time.
Takeaways to apply right away:
- Build (and publish) a small, trusted metrics layer first. If the trunk is weak, every branch invents its own definition of “revenue.”
- Create a feedback path from self-service to governed assets (PRs, intake, office hours, a patterns repo). When an edge insight becomes common, promote it.
- Treat dashboard count as a vanity metric. Track decision velocity and metric consistency instead (how fast can a team answer a question with the same KPI definition?).
- Design your semantic model to fight sprawl: fewer tables, clearer naming, and reusable measures beat a 1700-table “warehouse mirror.”
- Make outputs composable: expose measures/metrics via APIs, exports, and shared models, so insights can power apps and automation—not just visuals.
- Add observability: freshness checks, lineage, and “what broke?” alerts. Self-healing beats Slack firefighting.
- Use AI as leverage, not magic. It helps builders move faster, but it also makes data quality and governance more important because confidently-wrong answers are worse than slow answers.
Looking Forward
The teams that win the next wave will treat BI as a circulatory system—central metrics plus decentralized discovery plus fast feedback—rather than a one-way reporting factory.
Episode Transcript
0:27 good morning everyone welcome back to the explicit measures podcast with Tommy Seth and Mike and I forgot to do like names of people like I meant to be like Tommy the bike rider extraordinaire Seth oh data magnificent Seth and Mike I don’t know what I don’t know data mic and data mic I guess well we got one one down I guess one relevant to the podcast thank you which has nothing to do with Mike yeah
1:02 one of those guys from the what is a the Tommy Gun run around the old classic cars yeah yeah exactly happy Tuesday gentlemen that it is this one it is another happy Tuesday we are just cruising through here and for Greg supercalifragilisticexpialidocious that’s that’s your super super secret password no it must be Snuffleupagus today or something who knows yeah this is this is not a real episode this has been pre-recorded so sorry Greg oh we we are traveling around exactly
1:35 we we are traveling around exactly catch this one on the recording well sorry to make it get up early so we’re we’re jumping back in again we’re gonna go do another topic around these article that we found Tommy found this article the future of business intelligence or wave one of business intelligence is dead basically and now we’re on to article two of this one from the super data blog which has been a really interesting fun Ryan doley has been doing a great job of just presenting some neat ideas and
2:06 presenting some neat ideas and interesting Concepts around here as the as the generations of bi and data are evolving here so let’s jump in into his next article part two oh sorry Seth and you already teamed this up we already did the part one in last Tuesday’s correct where there were some great ideas I it I think in a lot of our conversations we hadn’t talked about like the leap from paper into reporting and just like how big of a deal that was for yeah performance and Reporting like
2:36 for yeah performance and Reporting like so I thought really some really solid things we we leapt off on on that article article we may may agree a little less here but I think we’ll have more like conversation around as we move into like what is the next generation of things look like look like it’s an interesting read and I like some of his ideas we may have different opinions on it well what was the big idea with 206 and
3:06 well what was the big idea with 206 and I think let’s Tee It Up a little where what did we talk about on Tuesday on episode 206 which was really the end of the second era or the second age of analytics yeah I think it it basically talked through like hey we used to do paper-based reporting we then moved into these Data Systems it got in place centralized yeah big centralized systems SQL servers the like we start hiring analytics developers database managers they manage the database great now we have this Central
3:36 database great now we have this Central thing that’s now centralized now what we’re looking at is in wave two we start seeing like the workarounds occurring right everyone’s in Excel and now we’re starting to use things like power bi that can do its own modeling without the need of it involvement and so Wave 2 starts alluding to this this maybe decentralization of that same whoa sounds a lot like the the to get not too political here but it sounds like a lot of this talk that you’re hearing in the crypto markets
4:07 you’re hearing in the crypto markets like oh don’t centralize everything decentralize your data so what RBI is the Bitcoin probably is the Bitcoin of data I like that better than power bi being the PowerPoint of data that’s for sure but in in in that he was saying Tableau is the front Rudder power bi is obviously taking over that spot and running with that’s true two which is yes analytics by the analyst right and I think his thing was wave two wave two bi tools are the world’s most efficient
4:37 tools are the world’s most efficient Insight delivery truck right like yes it’s in the analysts hands and he points out I think some of the things that we’ve struggled with in challenge which is we are pushed and pulled now because we have systems we have centralized bi in a lot of cases but now businesses also has those capabilities right you’re running roughshod and like what does that mean and this this article I think starts to dive into
5:07 starts to dive into the the next phase of things or or wave three right like how how what is the next set of tools have to do or problems it has to solve and some of those resonate in in others we’ll talk through well what one of the more intriguing things is the metaphor for the second age was supply chain yes and you think about how we dealt with Amazon right on yeah and we think about when we’ve developed power bi in the past it
5:37 we’ve developed power bi in the past it was this like churn and bird where you’re taking and running taking and running basically with because we had all this access to data and in a way we never had before and we could also create reports faster and more efficiently than ever before yes literally created this almost restaurant style like a Chipotle Style crating it comes it becomes a commodity yeah right yeah it’s just it data data has become a commodity to some degree and I think we’re realizing now and that maybe that’s not the best approach to bi
6:13 well it’s a different set of challenges I would agree with that state I wouldn’t say it’s not the maybe yeah I think your statement’s a bit strong for my tastes I think it may be either other challenges we’re now facing [Music] [Music] maybe there’s other challenges that we’re now seeing now in this new world of like okay now we’ve got a proliferation of reporting all this analysis Services someone’s gonna have to start saying we’re gonna start pulling the purse strings back like we’re going to start cap not spending let’s we’re not just going to spin up another P1 let’s go oh
6:43 going to spin up another P1 let’s go oh we’re out of room all right let’s spin up another P1 we need more data like that’s just not gonna someone’s gonna have to be saying like let’s really optimize and like figure out what’s valuable here and what’s not so to tee up this article right I I think we’re in the second article I think we’re on a first name basis so Ryan right yeah Ryan Ryan feel free to reach out and Slaughter like chime in and tell me I’m an idiot essentially the premise of this
7:13 essentially the premise of this article is is he uses a metaphor for the future of business intelligence and he calls it the data tree tree so in your mind because this is what we need we need Lakes trees data Supply chains oh we have lakes we had like houses now now we have like trees we need trees we need a nice lawn like so this also reminds me of Marco Russo’s article that he put out like like a little bit of tongue-in-cheek like we need like a data River and we need like a data Pond we
7:43 River and we need like a data Pond we need like the ocean and the data Beach and the data and the data sand like all the data well we we’ve already talked about the swamp we already talked about data swamps yeah and and Tommy’s data Pond is in there too yeah so so so in your mind’s eye you yeah so so so in your mind’s eye think of a tree The Roots the Roots know think of a tree The Roots the Roots of the tree he’s calling the source systems the the trunk is centralized platform and metrics and then as we look holistically around the tree itself on
8:14 holistically around the tree itself on the left you would have data apps dashboards ml models Department domains Etc so like as it grows out the like the it stretches more towards the insights that are impacting the business which I think he calls like the sun being the insights right and the metaphor here and how he like describes this going forward is your root being the source systems that there’s this flow out from core right core data and
8:45 out from core right core data and systems into the branches but at the same time and this is where the article I think is going to get interesting because we talk about this problem and challenge challenge the nutrients from these insights in the sun has to flow back in through the tree to keep growth and that that tree healthy and I I it like that that is a core problem like hands down to something we talk about fundamentally
9:15 about fundamentally Power bi and the Microsoft ecosystem I think being so close in many aspects but when we’re talking Enterprise a lot and then in the other hand talking with business users and helping them build these new Solutions like this entire time I’m like guys you’re doing the thing right here and if we did if there’s a graduation story right like from the business to Enterprise and I think that’s what he starts to address here which is the same thing that we’ve talked about in
9:46 thing that we’ve talked about in different ways but I digress like there’s a lot more to the article but this was just to describe this is the metaphor we’re talking about phase three or wave three being the data tree so I wanna I wanna I wanna refine something that I also picked up from his analogy here that I would like to add to what your description was I think your description was amazing by the way you could only the only thing we could have added there was a bit more of a silky or smoother voice that went along with the description it’s at the end of the day where I’ve talked all day long
10:16 where I’ve talked all day long I need to refine for those non-milwaukee people yes so who those were thrown off with rut rut did I say rut the rut yeah well we’ll go back we’ll go back to this one so if you think about a tree there’s like those main branches that that Branch off from the main trunk right you have the core trunk that the bottom where the roots grow into the ground right then from there you have like these large branches that eventually
10:46 these large branches that eventually stem out to leaves and I think the distinction I was seeing when I saw his
10:49 distinction I was seeing when I saw his analogy was his his domain areas like a branch of the tree was like hey this is HR this is sales this is finance right each of these large they’re not a trunk but they’re a very thick branch and then that Branch serves a bunch of leaves which eventually serves the leaves would be considered like the dashboards or those data apps or the ml models like these these basically at the end of the of the chain is the the machine learning models or the
11:19 machine learning models or the dashboards or the reports that are providing the insights that was one thing I gleaned from it as well I kind thing I gleaned from it as well I like the idea of this this of like the idea of this this departments and domains area representing like larger branches but not necessarily the leaves that are like the reports or insights that are coming out of the report pages so I like that too as well well the biggest part of this to me is something we’ve talked about more and more is the okrs invaluable metrics and I think we have some more lined up but like the roots here are like someone’s like gronal
11:49 here are like someone’s like gronal grade soil way through requires an Acker Foundation of clearly defined valuable metrics to me this goes with the bloatedness I think with we have a lot of reports but not all of them have been clearly defined in terms of what are we really trying to measure and is this what your department actually needs to measure to me this goes into what Wave 3 is also one of the things in the original article was less wide reports or less we’re going to be Distributing more and more and it’s going to be more narrowly focused and to me there’s a
12:20 narrowly focused and to me there’s a trend to this where we’re going to be doing more narrow Focus reporting rather than showing me all the data show me clearly defined measurable inside space and what this department or team is doing and I would say like the the one part of the analogy that I think falls apart here in a little bit so Tommy you say the root system and like the source systems I initially my initial thought is the roots are extracting data from like this rotten
12:50 extracting data from like this rotten old it’s it’s dirt that has been turned into dirt right I think like the transactional system this is like the system that no one wants to change it’s a system that continues to turn out data but everything has to absorb information from it so it’s not not always the newest flashes because that’s expensive to replace like I don’t know that’s where my mind went when he said you’re like yeah it’s extracting all this dirty data out of the ground that’s what feeds the tube man it feeds the tree exactly right so getting into the next section
13:22 so getting into the next section where I think some of the conversation will be will be properties of the data tree right so if we extend he basically says if we extend this metaphor to the aspects of a bi tool some properties of the ideal platform begins to emerge here we’ll get into balanced there we go I hated a data tree that outgrows its roots simply Falls over in a strong wind yeah in a strong wind right yeah right three of business intelligence about balanced approach to
13:53 intelligence about balanced approach to Insight generation and distribution it is not focused on needless growth and does not derive its value from the sheer amount of charts created but rather it’s a veracity and total value there’s Tommy’s point yeah like I agree with that but you say that it’s like if if we’re in a world of self-service where departments and users have access to all this information how do you control that I’m not saying you control it I’m saying where the value is going to shine I’m not saying you control it at all right how do you compartmentalize the useless crap that
14:24 compartmentalize the useless crap that people are building right yeah yeah how do you highlight what’s good and what’s not good well I think it’s a great point but I think this is what happens in a lot of Technologies not just power bi where it’s like oh look we can do all the things but what eventually happens is either people lose focus on the things that are on need are unnecessary or unimportant where people like we just need something that’s valuable and even if people are creating things it doesn’t mean it’s used right now it’s like oh we have to have all the data all the time and but
14:55 have all the data all the time and but it’s not used and I think there’s going to be a trend where it’s like what we need a we don’t want to waste our resources in our time on things that are just data and not actually driven by the business or kpis that are driven yeah that’s true what’s interesting to me though is and I think we were talking about it recently in one of our other episodes which may or may not have been today depending I don’t know today this is our first one first one we were talking about where Microsoft
15:28 we were talking about where Microsoft invests their time and dollars yeah yep and and Mike I think you made the point which was a valid one which is in Enterprise spaces this is when we were talking about Source control it does it make sense for Microsoft to invest a bunch in Source control if the use cases for Source control are not sales or actual users yeah but but at the same time then like if if you’re saying Tommy that value is driven by
16:01 saying Tommy that value is driven by usage usage we would argue all right I would say I would argue that in order to create a Wave 3 or a balanced balanced system system where we are creating value to the business then we should absolutely have something that would allow us to automatically deprecate or or disable or get rid of the Noise Within that ecosystem of things that aren’t used
16:31 ecosystem of things that aren’t used anymore anymore but that flies in the face of something like usage and and consumption of resources especially in premium capacities because you would want float you would want it as much as possible because it would consume more resources and you would have to scale up or get smarter smarter well I’ll go a step further and think about her your own huge the individual Behavior I think relates to an organization or a larger group of people so when power bi first came out how big were your reports
17:02 first came out how big were your reports like did you ever have scrollable report Pages no no way I I you literally been built like a page or two I was like okay starting out we’re gonna just slap in a couple things like that was probably it your ideas Power your ideas power bi reports not scrollable at all well I have some better but like that was like like this and the scroll just put it on the same page
17:34 I’m not ashamed no and I’m I’m not saying anyone’s ashamed or it’s a bad idea my argument here is when the feature or tool came out the first thing most people did was Implement that or try to do oh 100 right oh yeah now over time the individual this is not just Power Wheel this is just human behavior now our reports are much more refined because we know what’s valuable from a report point of view you don’t need seven pages I’d also argue too we’ve like done a little bit more homework and studying on this topic right sure I think in general we’ve also
18:05 I think in general we’ve also like said okay we when I first built reports I wasn’t really thinking oh man I gotta I can’t wait to use some Gestalt principles on this thing like I wasn’t thinking like oh shape and form that I should be really considering that or colors or colors are important I was just like ooh colors like everything looked like it was puke in a rainbow like it’s probably bar chart seven colors like yeah yes let’s do it belong to the baseball team but I’m also like now that I’m more in tune with like this this line of thinking I’m actually listening to people like Daniel Marsh Patrick and
18:36 people like Daniel Marsh Patrick and Kerry coleslaw like I’m listening to people who are in the space doing really nice designs and I’m thinking wow that looked really good and it didn’t require a lot of extra data points or extra visualization pieces to make it look awesome and I can see I’m I’m connecting more patterns of like okay I want this insight I need to build this chart chart my argument is from bi teams organizations are finally getting more knowledge on what bi is supposed to do at organizations and it’s not build
19:08 at organizations and it’s not build 40 reports at a time it’s probably to build five reports that align perfectly with that department or team on what their objectives and what success actually is I think that’s where the trend is and to me that’s how I read this article is it’s a much more narrow focus and everything we do has to serve a genuine purpose and bi is finally becoming a true department at organizations it’s not I. T not I. T I I would say I would say it has been like us in the last five years they’re
19:39 like us in the last five years they’re not creating some system of like called business intelligence we’re walking into things that have been here for 20 years dude guys guys I got this great idea it’s called business intelligence let’s launch it here the podcast first name It came it came along with power bi I don’t know if you guys noticed it what does bi even stand for actually so like I you had me Tommy and then you lost me okay erase the last part and then keep disagree okay I do like this
20:10 then keep disagree okay I do like this thought though that R is business intelligence thought of holistically across departments when making decisions about what’s valuable and and I would argue no but I also argue this article is not supporting that because there’s a bunch of different branches it all comes back to a sort well maybe trunk trunk offshoots right like if you’re if you’re pushing data back into a system or out to these branches yeah I get I I don’t
20:41 to these branches yeah I get I I don’t know I’m lost anyway I agree and I don’t to some where we’re at balanced good next next topic circular circulatory whoa are you with me now I’m with you this one also goes with what I said you can read this one if sap Flows In Only One Direction the data tree dies okay this one which is if we think about it like a wave one like you only get the data from one area it just goes to the business so he’s
21:11 just goes to the business so he’s arguing wave three cannot sustain that anymore it has to go backwards into Source systems in some way shape or form wave three must support bi-directional interaction with decision makers and downstream systems to create feedback loops to drive growth and change this must be built into the DNA of the tool so so my first thought of listening to this circulatory piece of this is thinking
21:37 circulatory piece of this is thinking about okay we build models we build them reports reports there needs to be some feedback loop to what was created in that thin reporting and I’m thinking maybe very narrow here but there’s probably more use cases around this but like what’s in that thin report and what needs to be moved into a central model so we’re not reduplicating things over and over again another thing that I’m thinking about here as well is thinking about okay if I have this data model how do I know who’s using that data model like I I can physically see that there are five or six reports off
22:07 that there are five or six reports off of that but what we really need to know is who’s using what there’s no there’s nothing today where I can go in and say let’s look at this thin report and Trace all the columns and used pieces of visuals from five or six thin reports all the way back into the model so I’m constantly trying to find tools or systems that are helping me like how do I better look at a model that I’ve built and see the consumption of that model through the queries that are hitting it either MDX through analyzing
22:37 hitting it either MDX through analyzing Excel or the thin reports that are there because I want to funnel back to that model the models have to improve I’ve got to do things to change it I want to delete things that are not needed anymore I don’t know if I can do that anymore like there’s there’s not a good mechanism to do that now that’s probably not what your head was going with circulatory Seth I think you were going somewhere else that’s where my that’s where my mind went that’s a good thought it is a good thought but I don’t think that’s what you were thinking but I still think it I think it starts with this concept of a centralized something
23:07 centralized something right where where art like we’re I see this biggest challenge is we have tools that are open to business units and they’re building their own models and we’ve talked about this in terms of like somebody builds something and it gains popularity and reputation so either it’s it’s strategic in value or the audience is really big and we talk about how do we how do we make how do we fit that model and Report into Enterprise systems that have slas that
23:39 Enterprise systems that have slas that have governance around them that have all the things that we as bi teams know have value how do you graduate that right what is that path okay like getting all of these reports with all of their different models somehow hooked into a greater more valuable balanced ecosystem and I think that’s the largest problem that we we have and we’ve talked about is there is none I think we’re gonna have more of a problem too Mike this made me think
24:09 problem too Mike this made me think of the roadmap feature with data flows where you’re actually going to be able to write don’t get me started data marks and like like we’re building independent siled things of data and how does that fit into like whether it’s your customers or like like Lakes of information large volumes of big data that you can’t just throw in a model right like right more and more companies have large volumes of dial of data that
24:40 have large volumes of dial of data that you have to be strategic with you have to consolidate like you can’t have these one-off things eventually that just sit out here without some feedback with centralized teams like Tommy’s making a point of we need to be more strategic with business intelligence and the value of certain reports within an organization where’s the organization to all of this we’ve had the problem with people creating data models and reports wild west I think we’re about to get
25:10 wild west I think we’re about to get this disruption now with this second system of databases because one of the big roadmap features for Microsoft right now is the ability to write back to data flows because they’re in the Azure data Lake and I think that’s that’s a huge disruption to what we do especially with that plan for data marks we may all of a sudden catch up with the amount of reports or and the amount of models because we’re creating much more streamlined reports but we’re gonna have this whole other issue coming up where people are creating data lakes or
25:42 people are creating data lakes or data flows and data marks that people can write back to that is going to be ill-defined what is the central source of truth because what was the first disruption it was a data model or a tablet model that anyone can create we’re almost getting this next point where anyone can create a database yeah right that that’s a that’s a very strong point because essentially did we just exacerbate the problem exponentially because we’re giving we’re
26:13 exponentially because we’re giving we’re giving business users even more even larger ways to make giant silos of data within an organization and that could be written back to well then there’s right like it’s a complete Silo like I’m gonna create my own thing and it’s gonna live over here well well are you guys talking about the idea of like so another snare that I’m thinking around with this like circulatory piece right as well right as data comes from the central system out to the branches to to where people are consuming it there is
26:45 there is there’s always a data quality problem there’s always Master data that’s not right there’s always things that need to be adjusted and oh I don’t want to report that way or Bob moved this department or this this thing changed it there’s all these things that are at the once the data comes out from the center of the tree to the to the reporting there’s this concept of I see what you’re trying to tell me Mr Data people bi team whatever I don’t understand or agree with it and I need to adjust it by inputting this new round of data and that’s the circle so there’s
27:15 of data and that’s the circle so there’s if there’s like literally a feedback loop from the outflow of the report back into a central system where I can then inject this is however we’re going to redo our regions this is this is how the hierarchy of sales will work this is how we’re going to catalog and capture Master data right it’s a it’s a literally manage it yeah you’re managing data and you’re now feeding that back in this so if you’re if you don’t have a mechanism to feed the data back into the through the root system to then become part of another source to get a feedback through I think you’re in a is that what
27:45 through I think you’re in a is that what you’re also saying too yeah yeah I agree with that yeah yeah all right good let’s move on next one so next one because I don’t want to think about this no but I know I agree with you his argument is the properties of all this yeah like wave three the tooling has to be able to figure this out and I guess 100 branching a data tree takes many branching Pat sorry branching the data tree takes many branching paths towards the sun wave
28:16 branching paths towards the sun wave three supports that can’t even move it supports many uses via the traditional bi experience but also composable oh it’s working proposable embeddable a lot of components so API first integration points and flexible presentation layers to do more than churn out dashboards it enables individual departments to grow at their own pace and direction thoughts well first I need to know why compo why Mike has such a
28:48 compo why Mike has such a composable like like you can take pieces and Stitch them all together like I get the word composable but like that’s what we’re already building like everything we have is composable like to add another language piece they’re uncomposable like I had a I had someone talking to me about like well we need to we need a new architecture I’m building things on databricks I got all this stuff we’re sticking stuff together we need more of a composable architecture what does that even mean guys like you have to build all the stuff from scratch anyways like using a tool like DBT your data bricks or synapse or whatever your tool is the whole thing is being
29:18 tool is the whole thing is being composed as you build it so I I just feel like it’s such like a wasteful term like I get it you’re trying to say we need I don’t know I think I feel like it’s a buzzword that I’m just not resonating with so I don’t really like this whole composable but I do understand the concept of embedded components and I do think there’s some value there where Microsoft is is a little bit of a weakness in this area because they can embed entire reports hygiene reports but they’re weak around
29:48 hygiene reports but they’re weak around embedding individual visuals so if we’re talking about hey I want to embed a single visual easily for like I don’t know whatever you’re building whatever app thing you’re building embedding those things easily I think Microsoft has a lot of the mechanical pieces in place but I think their API layer to make that easy for developers to use is not as simple as you would like it to be maybe for developers but I think this goes exactly in line with the the pros of the circulatory side of things where we are getting data in more
30:19 things where we are getting data in more places than ever before and it’s easier than ever before with ease of embedding of reporting teams embedding it in other systems but more importantly the pros of that date of March and the data flows is that departments can in a sense own it and also be able to do things with it think of Viva goals right now the integration with power bi if you want to create your scorecard with Viva goals it is dead simple and I think there is this other layer not I’m not saying it’s completely perfect yet by no means but I
30:51 completely perfect yet by no means but I think Microsoft’s doing a great job from the business side of being able to have teams and departments not worry about the API and sending it up and being able to easily integrate that and team Source systems or in their Technologies I can’t tell whether this is specific to like like an interesting way too embeddable components of visualization or data yeah like the API first integration points
31:21 like the API first integration points and flexible presentation layers I do agree with that but we already have it like so API first Integrations right I think every business no matter what you are in the future has to have an API layer that’s just going to be you have to be a given but I would also argue poverty already has a lot of that built out because you can already write queries against an API there’s a whole bunch of apis you can do to manipulate move things around copy up and down reports all that stuff like there’s a lot of there’s a lot of surface area that I already get a lot of value from refreshing data sets
31:51 value from refreshing data sets partition replacement like all that stuff stuff right but at the same time like it it’s easy to flip out API first integration but the reality is like it it’s not going to work it’s still not going to work in big data right so it’s like okay I get API but when’s the last time you guys like hit a roadblock in a connection problem like I couldn’t get at the data I in large part I I feel Microsoft’s done a pretty good job of like covering the bases and I haven’t had any problems
32:22 the bases and I haven’t had any problems of connecting or at least somebody having figured out how to go connect to
32:27 having figured out how to go connect to different sources of information and yeah some of those are are API driven so maybe that’s what it’s meant right our accessible system should have API layers that allow us to extract data from them yeah maybe not the visual point of view but think about the now visual code extension Visual Studio code extension for creating a power query custom connector if you’re using powerapps for power automate easily create a custom connector is dead simple all you need is either you can use a
32:57 all you need is either you can use a postman collection or a Swagger file and you have a connector for your company so from easily integrating from the business side of things you really don’t need a lot to start up with no yeah now if we flip this on its head and before in say composable and embedded visual components it’s completed and I agree with Mike yeah there is a lot to be said about it’s a week reducing reducing the barriers for complexity of of allowing applications or other
33:30 of of allowing applications or other tools to embed visualizations from from within or without that framework now what I would say if I’m if I’m reading this one a little bit here too API like so I don’t really feel like API first integration makes each the business unit grow at their own pace I don’t really see how that’s working very well in my mind yet however what I would say is there’s a weakness inside power query M and particularly data flows online there’s this whole thing around I need
34:00 there’s this whole thing around I need to get a token to talk to an API yeah and right now power bi nor Microsoft has figured out how to securely solve this and I think this should be dead simple in my mind the the power query M team should figure that out immediately right get get in get in get a the ability to hit any API make a custom cutter I don’t even care how you do it like make a custom connector that allows me to securely store a secret name and
34:30 securely store a secret name and password first make the token call to get the token that I need with the parameters that I want then use said token to call a subsequent API this is by far probably the most time or effort I see people spending around API calling but you can go build a custom connector but like now you have to have all these custom connectors right if you solve that one problem or you just said let’s just solve this get token hit API problem with one data flow now everything’s open like you don’t
35:01 now everything’s open like you don’t need to build any custom apis you don’t need any custom connectors for that matter it all just works we’re working on a V3 solution for the scanner API using data flows actually the one out right now is the V2 the first one is only there to create the return the token there you go but again like all the time like either you build a custom connector that connects to the apis that you need power bi to talk to or you do this really complex like I’m going to build this other entire data flow just to go get the token that I can then use in a subsequent data flow to do
35:31 in a subsequent data flow to do everything else I want which is or whatever because they have solved this with powerapps Power automate connectors yeah that’s what I’m saying and like what the heck like hey teams talk to you today please talk to each other yeah right like figure this out so I I don’t anyways that’s where I feel like this one’s going I’m like that that would be could be better what before we keep going one thing that I’m not I feel like a large lack right now it’s really focused purely on the technology and this is more of a comment and really we
36:02 this is more of a comment and really we have not talked about people or process at all and I’m thinking of the governance layer here that we’ve breached on and I’m finding this very I don’t want to say concerning but I think this is like a large gap at least in the the only part I’m seeing the Oracle right now is we’re this is all Focus technology yeah that what a box weren’t like I’m sure he wants a three series article not a 30 series yeah true probably true
36:32 a 30 series yeah true probably true next next property all right next property rooted rooted just as a data Tree Grows I didn’t say rutted I know but I’m I’m just having fun now I hope not gonna listen to the first time you said it I’m just let’s just take take let’s continue continue I’m gonna drink some water Tommy’s getting the evil eye for himself when you’re right call me Tommy is right about a lot of things I’ve lost more bets to Tommy than most people most other people I know
37:04 people most other people I know all right all right rooted rooted just as a data tree grows best in great soil Wave 3 requires an accurate Foundation of clearly defined valuable metrics that can feed any Upstream process whether it’s traditional bi AI ml or analytical operational apps these metrics are the foundation of balanced self-service
37:36 what do you feel about this one it frustrates me to some degree because like how like how this implies that I have centralized standard metrics that the business is using and that’s just not a percent dude that’s exactly like we don’t know what we’re looking for we don’t have like this is not always very clearly defined and I feel like these are just a lot of really good words this is right to me this feels very wishful thinking but unless unless this somehow is saying like hey this tool also has to figure out how we manage all this data and then
38:07 out how we manage all this data and then create these things but that like you can’t have Source systems or Source like just this random hodgepodge of source and then say that it’s rooted in clearly defined valuable metrics unless you’re standardizing that across an organization but these business units aren’t doing that so how so okay so hypothetically in wave three right we take Tommy’s 10 episodes of frustration around his previous work
38:37 of frustration around his previous work of like ah Department not being able to communicate to another department and then you can consolidate all com all of the Departments of a company right and all get them in the same room to decide which metrics are valuable and accurate within the organization you’re going to have thousands of kpis like who is spending that time who’s measuring that who’s talking about that stuff you’re not what what does that require it requires centralization and the organization to
39:08 centralization and the organization to say all you teams need to centralize and get in a room and figure this stuff out and nobody is using any other data except for the stuff that we’re going to build through here because there’s such a problem with proliferation of different metrics being called the same thing and yeah like how is a tool gonna own that yeah the only thing you said wrong with it was only 10 episodes that I’ve said this way more no but this is this is a huge part I no but this is this is a huge part one or departments have a problem
39:38 mean one or departments have a problem defining right like what to measure and then I think the other part of that other problem is they don’t know what to measure and more or less how to so they’re even if they have metrics that they’re measuring right one is it actually measurable where they say oh we’re looking at sales in our advertising budget well what what are we measuring here like how can we actually measure this on a normal flexible basis and and there are measuring like things like volume when they’re looking at thousands and thousands of data points
40:08 thousands and thousands of data points like you need to look at a rate you need to look at a ratio because 1500 compared to 1501 does not matter and does not move the needle for you it and I think we’re we’re comp departments do not have someone helping them calibrate what to measure and that’s the biggest issue and now we’re just leading into more key insights where departments already don’t have that in a sense a rule stick of how does that align with the organization to me it’s
40:38 align with the organization to me it’s it’s about they don’t know how to measure more or less what to measure yeah I agree on this one as well like it’s it’s hard to say there’s a lot of effort to centralize things but then everyone’s going to have their own opinion on how they want to spin the metrics or spin the calculations for their Department to make their their place look the best right right I think like yeah you can Define some very basic things but I think the more you try to make it self-service the more you’re going to wind up wind up with a variety of things as well so like I I think of all the
41:13 as well so like I I think of all the properties so far no not not weakest I would say it it definitely raises the ire right away which is probably why he talks about it at length which he is suggesting that there’s an open system like this tool has to solve that fundamental problem that you’re having creators across an organization building all of this stuff and then you’re somehow like pulling that into what he’s calling I think a circulatory system of data where
41:45 think a circulatory system of data where you’d have to like start to have conversations around what you’re seeing being built in these systems and then somehow fix it right because you’re like the only alternative to like what we have right now in Wave 2 is you’re rebuilding things and then you’re putting people onto centralized storage systems and that is a path it is absolutely something that would be like okay well based on our business intelligence know-how and what we did from wave one and where we’re at with wave two our path towards creating
42:17 with wave two our path towards creating same same metrics and and clear insights throughout the organization is known in this this way if the if the push here is to say our existing knowledge of how we deal with this data is just fundamentally wrong wrong and that we need a new system that would allow us to absorb all of these metrics and potentially plug in Ai and say hey you have 500 models and you you have 500 models and 60 of them all have a sales metric
42:48 know 60 of them all have a sales metric that are different you now have to consolidate that and this is not like and point me in the direction of where that data should come from and somehow this system just self-heales right like it would have to be something where you’re like you have this managed data store that you somehow like would be able to introduce the new calculation just update things across the board that’d be wild but that’s essentially what is being recommended
43:15 essentially what is being recommended like how else do you do that without centralizing around a team or a system I think it’s elevating the to me it would be elevating the bi team to have more of a say and help calibrate what they’re measuring rather than yeah yeah but it’s also like it’s not just the bi team business intelligence is like typically the the models and Reporting you’re talking about like data engineering data architecture like depending on how large the organization is no I’m saying add back the
43:45 is no I’m saying add back the intelligence to the business intelligence side of things where we have none right now but I’m saying from what a department thinks like apartment thinks we’re just building reports and we’re the visual side you do models provide me the data not help guide me on what I’m looking at and what should I be looking at I don’t then I don’t know if I agree with that I don’t think we’re defining everything and we’re reporting back what they’re doing wrong but I think this I
44:15 they’re doing wrong but I think this I think we to me I think it should be one of the skill sets or all these growing is where marketing saying we’re looking at x y and z or sales is we’re doing this and we helped just calibrate and we create metrics or we can help Define a few things do how big a bi team would have to be in order to like be integrated into every different business like we’re talking about user a lot of our we’ve a lot of our wave two tools are self-service
44:47 I’m gonna pull into the next part of his his article where he starts talking about like Ai and chat GPT no we haven’t we haven’t hit the other we haven’t hit the other properties components well I I well I’m saying like to your point though like oh we’re in wave two I hope the hope is the Hope is right so to to your point right there so you said like the department would need to be massive to get Outlook to have an entire team as dedicated to all these yes you’re right and self-service is going to outgrow like if you if you give people Central models and say go build your own stuff they will out build a
45:17 your own stuff they will out build a number of reports and some it will be valuable and some of it won’t be but they’re going to out build a central team any day because there’s just more of them just sheer volume and so I think maybe the Hope here is you’re right a central team couldn’t do this but can we build things in a way that people can use chat gbt or train models on top of our data that is actually helping us to some degree yeah I’ll give you the answer right I think he’s making well he started making fun of it to some degree right because like
45:47 of it to some degree right because like where it’s at right now you so far because I think there was like there’s going to be a major trough of disillusionment yes exactly implemented in bi in three percent of its answers are egregiously incorrect yes but sound great it’s fun and funny as a Google replacement but any error rate at all is unacceptable for systems that have major business decision making impact exactly exactly right but to your point like it are you trivializing the amount of like
46:17 are you trivializing the amount of like the capabilities of AI if if you’re pointing it back in the direction that we were just discussing which is around the rooted area area if it’s about if it’s about pointing AI at solving the problems of this decentralized data or like within all these reports and understanding what’s happening and then salt like helping us solve the problem how do you remap things because technically that’s what it like you’d be asking it to do I
46:48 what it like you’d be asking it to do I want you to remap this thing because this is where the data should go for these different parts what if I blows my mind because it’s like well what if what if so so to this point I was in a Andrew sitz was doing a user group session and he was talking about databricks and he was talking about this new thing with unity catalog Unity catalog has this thing called query insights and what happens is databricks listens to the queries that are coming to any table that’s in databricks and it tells you what is that
47:19 databricks and it tells you what is that Insight what is that what are what queries are happening unsightful information on top of what’s coming to that table so yes right there’s questions we’ll be asking everybody yes so probably still have the model data but what if the AI could go through and listen to all of the data queries coming to our Central models and make educated guesses around these columns or these people are hitting the model the most in these kinds of areas and maybe again I’m going real big mind here right
47:49 again I’m going real big mind here right what if AI could start producing to us like a heat map of what data points are most valuable to the organization right these tables these columns are hit most frequently okay maybe we should focus our efforts on designing things around that and asking these people what they are doing with it right so finding what is most valuable and then starting from that position and then okay stand on that hill and look around and see what we can build drawing drawing usage not just on
48:19 build drawing drawing usage not just on a report but the actual company yeah within it that drive back to the lineage of where yeah AI is good at doing that stuff is looking at patterns and finding yeah that development that would to me that would feel way more valuable to throw AI at the retroactive looking back at what is valuable valuable and what columns are being used as opposed to using AI to cite tell me what is in what is insightful this is the misconception with AI where they think it’s going to replace our thinking which things like you do Dev help me with my Dev and take a lot of that time off and
48:50 Dev and take a lot of that time off and allow me to focus on more important things yeah I agree okay we’re ironically enough hitting up on time here so like let’s talk about the last two adaptable in the forest or in a manicured lawn a data tree adapts to and exists in harmony with its surroundings Wave 3 tools are multi-cloud or on-prem they support SQL and python code and UI they adapt to their environment no no no wrong on this one in my opinion no I I don’t I don’t
49:21 one in my opinion no I I don’t I don’t think Wave 3 tools touch on-prem I don’t think they’re on Premiere it’s dead like and if you’re if your organization isn’t full Cloud right now you’re missing out because the the none of the capacity the capacity by which you are able to develop and all of these new systems including Ai and the services that you can Implement like yes cost is something you have to be aware of and you have to hire people that know what they’re doing in those environments however but like no you’re not you’re not you’re
49:53 but like no you’re not you’re not you’re in like to pay for people to manage infrastructure is becoming a way of the past you don’t pay people to manage infrastructure anymore like that used to be my argument but at the same time the pace of innovation that’s greed 100 agree like we’re hitting a new wave again and like even within the last X number of years like just you’re you’re missing out you if you are still sitting on Prem you are not going to be able to compete with organizations that are full cloud you won’t 100 agree
50:24 you won’t 100 agree moving on moving on resilience sorry do you agree with the multi-cloud approach approach the multi-cloud I think to some degree you cannot like there’s there’s capabilities within that already yeah I would agree is it seamless I would say I would say we we haven’t encountered like major problems yet working across Cloud it’s cumbersome
50:55 working across Cloud it’s cumbersome but but it’s going to get better I think but like on the like you don’t move where if you’ve been collecting data in a cloud like let’s call AWS versus Azure right if you look at all three of them the big three those are your main three right they all have almost comparable systems there’s almost there’s almost three tools that are in them correct and like now there’s but now there’s things like databricks that spans all three of them and you can have like the same notebook experience in any Cloud you want so like in that respect that to me feels like it could be
51:26 that to me feels like it could be multi-cloud however the downside I think of this when you think about multi-cloud is if you’re not in each Cloud you will want to aggregate data to a high level and then move the aggregated data between Cloud if you’re doing things because you don’t want to remove all the raw data and store it twice that seems wasteful it is and I don’t like I guess that’s the part about multi-cloud I don’t understand because like these a cloud is going to be owned by an organization and typically if you’re if
51:58 organization and typically if you’re if you’re all in you’re you’re typically all in on one service or another because there’s cost savings there that’s what I’m saying right like if I’m implementing a Wave 3 bi tool it’s it’s not it to me it wouldn’t have to serve the purpose of being capable across multiple different clouds because I technically I agree already extract data from those things exactly every time I see people talking about we need to be multi-cloud or Cloud agnostic type tooling I in my mind I’m thinking I understand what you’re saying I think it’s a good in concept I don’t think
52:29 it’s a good in concept I don’t think it’s an economical solution it’s more if you’re missing out yeah that sounds like that’s the buzz where people are saying oh yeah we can go to any Cloud you can move anytime you want but I’m not going to move 300 terabytes of data on a whim like a Saturday afternoon I’m gonna be like yeah let’s just move to AWS now and we’re going to move all this terabytes of data to a different Cloud only of three three yeah yeah they they support SQL python code and UI I think systems are already starting to do that yeah I agree like I
53:00 starting to do that yeah I agree like I agree agnostics like using of different languages for certain for sure SQL Marathon AI this eventually just goes away right it’s an open source Solution on GitHub yeah for your Enterprise yeah exactly okay good I’m done with that one sorry sorry they were good and the last one is resilient and self-healing a healthy a healthy data tree withstands the storm and heals any damage wave three tools require observability to alert when something is broken and proactively heal
53:30 something is broken and proactively heal when possible I need to know what Ryan meant from this because this is a pipe dream to me no but this is like to me this this goes hand in hand with rooted in my mind but if you’re creating a CIS rooted rooted rooted I got it rooted I’m not saying anything I’m with you now got it I think we’re done with the rooted word there are words that you guys mispronounce and I might just yeah like
54:01 mispronounce and I might just yeah like I’ll give you one said I’ll give you an
54:04 I’ll give you one said I’ll give you an easy one right now it’s water with a d water I’m talking about rooted and resilience and self-health okay to me go hand in hand because you’re talking about like the management of this massive ecosystem of wildly data metrics that there’s nothing that exists to do that and then this is basically a hand in hand with that saying like it needs to self-heal well the systems that I would be saying I’m analyzing or saying go remap yeah you go heal that
54:35 saying go remap yeah you go heal that somehow right like we’re saying I’m gonna pick this metric and it’s gonna be the one that should be used everywhere go heal it I guess is the way I read this like what it well here’s how I would read healing itself right so imagine imagine you’re doing incremental refreshes throughout the day right maybe you miss an incremental refresh or something like that right on weekends you’re able to say blow away all the data for the week and do a clean refresh of a large larger system right so you may miss certain things throughout the
55:05 may miss certain things throughout the week and at the system self heals itself to some degree I I’m also thinking about like you have a system that’s in production that’s tracking insert updates and deletes your your analytical system is Now tracking those deletes as well and you may not be getting it all aligned but you’re now having regular Cadence on things that your the process itself is able to correctly synchronize what’s in transactional systems to what is in the bi and backup system so that’s how one thing I would think about healing the
55:35 thing I would think about healing the other part I would probably point out here would be is thinking about healing in the terms of like an automatic retry right I try to load the data I couldn’t I’ll try again in 30 minutes or I got halfway through my process and I’m going to pick up from where I left off as opposed to having to rerun the 10 or 15 sub processes to get to where the step it failed right so it’s going to be able to pick up where it left off retry again and and finish itself out stuff like that I think is what I’m seeing about healing there’s probably better option examples of that but that’s what I think
56:05 of that but that’s what I think initially initially Tommy doesn’t have any words on healing he’s like I don’t understand it’s not that I don’t understand I think that the applications for what we do is either very incredibly minimal right now or I don’t see a lot of features really growing from that there’s a lot of pipe dreams but there’s not a lot right now I think in terms of what we’re doing orally from everything that else goes in this conversation from the business user and departments that this is going to be a feature maybe in the devops OR in data
56:35 a feature maybe in the devops OR in data so that’s where I was doing data Ops this feels like data asked me but nothing in the data tree nothing that we’ve talked about here well like observability and alerting right if you think about all the data you’re getting from Source system all the way through the report right that data could fail at any one of those steps it’s failing raw it could fail in bronze silver gold it could fill it could fail at the load between power bi and the report like there’s so many points of failure like there’s not an easy way of seeing like where does the lineage come from from the report all the way down to the original source and when a pipeline runs
57:07 original source and when a pipeline runs did it in fact notify you where it broke and where it fell down and fell apart I do think that’s a part that we need to think more about as we think about like what data Ops looks like in this new world of cell service I I would just say at least from everything we’re having the conversation on this is gonna have the least amount of resources and investment on whether or not that’s right I think that’s just going to be the way it’s going to be I think you’re right I think that in testing people don’t expect everyone needs testing but no one wants
57:38 everyone needs testing but no one wants to spend money on it like it’s like you could spend so much time building tests to make sure things are right but I don’t think Microsoft’s going to build out of the box solutions for this no they’re going to look at their they’re going to look at the third party I would 100 agree with you on that one they’re going to look to other people third-party solutions to build and figure out this stuff for you yeah 100 I agree with that statement all day long so one of the things I absolutely love about the article Series so far is especially with this one it strikes a lot of chords right like and I love the I love the
58:09 I love the insights it’s doing a poking at some of the big problems that we’ve talked about in different ways with power bi and the Microsoft ecosystem and and setting a framework by which I’m very interested in article 3 where he’s he’s prompting that he’s saying that people are building parts of this stuff right now and I have High Hopes I hope it’s not like some of my High Hopes around certain features within power bi sometimes
58:39 within power bi sometimes automated attacks or something but he he completes the article saying that there there are certain Enterprises and some players that are close and his third article is going to outline what I would gather would be answers to this wave three outline of different components so it has been a fun ride so far I will say that and if he ever
59:10 far I will say that and if he ever does listen to us chiming in I’m sure he’s calling us idiots all the way through I’m sure I can’t wait to put this article out and show these guys how dumb they are well maybe we should let him know we’re doing it we we absolutely should but we’ll we’ll have to do a podcast on the article 3 when it comes out as well yeah I agree it’s been it’s been definitely very thought-provoking regardless yeah I’ve loved it it’s been a good thought exercise for sure all right so as we as we wrap here it’s time for what does ours let’s go
59:41 for what does ours let’s go let’s talk about our secret sauce so so this is this is chat gpt’s answer so the question of the day is I asked Chachi PT how is business intelligence like a growing tree so we’ll see how okay you guys are gonna be surprised by this right I don’t know all right okay okay let me read the answer and you’ll tell me if it’s the right prompt I could have prompted wrong all right all right business intelligence can be paired to a growing tree in several ways strong roots just like a tree needs
60:12 strong roots just like a tree needs strong roots the growth in front grow and Thrive business intelligence requires a strong Foundation of accurate and relevant data this data forms the basis of all insights and decision making Brian Ryan did you get this out of chat GPC it’s a cute Chachi PT this article all right number two okay you ready number two multiple branches okay A Tree Grows A Tree Grows multiple branches that spread out in different directions each serving different purposes similarly business intelligence
60:44 purposes similarly business intelligence has multiple branches or domains such as data warehousing data analysis reporting data visualization each serving a different aspect of the organization so a little bit different flavor on a little different take I I can’t agree with that that’s okay number three this is interesting growth rings a tree’s Rings growth show its age and indicates periods of growth and dormancy similarly business intelligence tracks the organization’s growth over time indicating areas of success and
61:16 time indicating areas of success and areas that need Improvement that’s something he could add I was a good one something that he could add yeah and and there are times like if you think about a growth tree right when there’s a lot of water the tree grows rapidly the growth rings are further apart when a tree is starved of water when you’re starved of capital or resources or whatever your growth slows and you’re not growing as much year over year year potentially so I thought that was a good analogy I like that one this one I really like pruning and shaping just as a tree needs
61:47 pruning and shaping just as a tree needs pruning and shaping to grow into a strong and healthy structure business intelligence requires constant monitoring and adjustments to ensure that you’re providing actionable and accurate insights I like that one I’m gonna use this one this is good we got ourselves an article we got a winner like when I go into work tomorrow I’m like boss hey I got a new analogy for you what tree do we have here what do we have here let’s talk about that
62:17 do we have here let’s talk about that all right last last one number five and this also this was another good one fruits of Labor a tree produces fruits that are enjoyed by many similarly business intelligence produces insights that are shared throughout the organization and help dry a strategic decision making I’m giving this one like an eight or nine dude this was seven this is a seven or eight or nine or something on the high end there I think they did I think chat gbt did a great job of picking out an analogy of a tree and business intelligence and pulling them together pretty well the creativity I’ll get I’ll
62:49 pretty well the creativity I’ll get I’ll give a high number six out of seven but overall I don’t like the idea I’m gonna give it a three wow wow harsh for for all of our chat DPT interactions thus far I’m gonna give this a solid 7 out of 10. like so in order so Tommy your comments here inspired me so last thing we should probably do a follow-up on this one on a future episode our next question should chat GPT should be how is p how is business intelligent like a pizza
63:21 intelligent like a pizza for Tommy for Tommy I got first as you’re talking I’m like how did I put in how’s Pizza like a growing tree right well we’ll do some more fun chap things at the end there we’ll save how is billions business intelligence like a pizza yes okay done or calzone or
63:53 yes okay done or calzone or whatever you want Tommy’s mind is officially blown and now he’s hungry Tommy’s gonna go eat something all right with that thank you very much for listening we appreciate your time today this has been a fun episode talking about a great article the article is in the description below if you want to follow along and read the article and and think about what we’re thinking or nuing through on this topic thank you all very much we appreciate your listenership and we only ask of you if you let us know what you thought about the article and give us some thoughts around what you liked in
64:23 thoughts around what you liked in addition to our thoughts here maybe we were wrong maybe we were on the point let us know in the social media areas tell us what you thought about the article as well tell me where else can you find the podcast you can find the podcast anywhere it’s available apple and Spotify make sure to subscribe leave a rating helps us out a ton if you want to join the community in the live chat you can do so every Tuesday and Thursday at 7 30 a. m Central follow all of power bi tips social channels and join us all right excellent thank you all very much we’ll talk to you next time
Thank You
Thanks for tuning in! If you enjoyed this episode, please subscribe to the podcast and share it with a colleague.