The Importance of Semantic Link – Ep. 314
The Importance of Semantic Link is the focus of this week’s Explicit Measures episode. Here’s what was covered and a full transcript for reference.
News & Announcements
- Visual Calculations: Introducing a Two-Layer Approach in DAX Calculations – pbidax — The February release of Microsoft Power BI Desktop unveiled the public preview of a transformative DAX feature - visual calculations. This new feature promises to revolutionize the way calculations are written,…
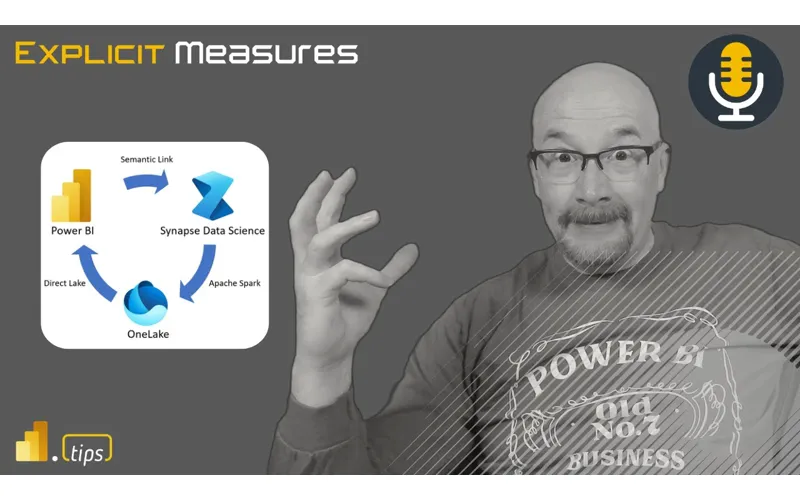
- Semantic link in Microsoft Fabric: Bridging BI and Data Science | Microsoft Fabric Blog | Microsoft Fabric — We are pleased to introduce the Public Preview of semantic link, an innovative feature that seamlessly connects Power BI datasets with Synapse Data Science within Microsoft Fabric. As the gold layer in a medallion…
- Read data from semantic models and write data that semantic models can consume using python - Microsoft Fabric | Microsoft Learn — Learn how to read data, metadata, and evaluate measures from semantic models using Python’s SemPy library in Microsoft Fabric.
- sempy.fabric.FabricDataFrame class | Microsoft Learn — A dataframe for storage and propogation of PowerBI metadata. The elements of column_metadata can contain the following keys: table: table name in originating dataset column: column name dataset: originating dataset…
- sempy.dependencies package | Microsoft Learn — This browser is no longer supported.
- How to use notebooks - Microsoft Fabric | Microsoft Learn — Learn how to create a new notebook, import an existing notebook, connect notebooks to lakehouses, collaborate in notebooks, and comment code cells.
- PowerBI.tips Podcast — Subscribe and listen to the Explicit Measures podcast episodes and related content.
- Power BI Theme Generator — Create and download Power BI report themes using the PowerBI.tips theme generator.
Main Discussion
This episode explores why Semantic Link matters and how it changes the workflow between Power BI semantic models and Python-based analysis. The conversation focuses on using the semantic model as a trusted layer while still enabling deeper exploration in notebooks.
Key points from the conversation:
- Why Semantic Link is useful: it bridges the semantic model with Python workflows so analysis can be repeatable and shareable.
- Model-first mindset: the semantic model remains the source of truth—even when you branch into notebooks for advanced work.
- Better collaboration: analysts can experiment in Python without reinventing business definitions from scratch.
- Governance angle: the more you can keep definitions centralized, the less risk you take on as self-service expands.
- Practical usage: where this fits into a Fabric workflow (exploration, validation, advanced analytics).
Looking Forward
What are you trying in Fabric/Power BI this week? Share your wins (and your war stories).
Episode Transcript
0:30 good morning everyone and welcome back back to the explicit M podcast with Tommy Seth and Mike good morning good morning gentlemen here we go another day another dollar jumping in a couple good announcements here but before we do announcements today we’re going to talk about today a feature of fabric called the synaptic link santic sorry what I say semantic link I meant to say I’m literally looking at the word and saying and adding a why to it so the synap is in your brain
1:02 synap is in your brain are are not firing all yet needs to be more coffee before I do this ohay so semantic link being able to connect to the semantic model linking that to notebooks and and the experiences you can derive from there really a lot of interesting blogs have been coming out about this and I think this is a great feature it’s a it’s a library you can use a notebooks but we’ll talk about that in a moment that’s going to be our main topic for today let’s jump into some news items here so a couple news items that have come across our radar in the last couple days one
1:34 our radar in the last couple days one these are going to be in the description this is a recorded episode for those who are jumping in but the links will be in the description we’re talking about one here from see if I can catch the the name of the the author William kigger I think is the name and William is talking about talking through capacities and doing a comparison I believe is how I read this two workloads the same workload one is done in a pipeline the second is done in spark notebooks so basically comparing how many compute
2:06 basically comparing how many compute units are taken to use or do a simple or a data transformation or some data engineering activity so it’s the same activity but it’s just being done twice which I find very interesting he also goes in the very beginning of the article he talks a lot about the ability to take the capacity units the CU and turn them into dollars so you can use some back of the napkin math to get into this number of cus is
2:37 math to get into this number of cus is available to us in a given month how much does it cost me to run this pipeline in this notebook for this thing it it can literally be turned into a dollar amount so he actually goes through in the very beginning of the article it talks through how many dollars per hour the capacity cost you either Reserve or non-reserved pricing and then he goes through the math of saying look here’s how to calculate a Capac cacity unit and how many capacity units per hour you get so essentially the the thought here is if you every capacity unit you’re
3:08 you every capacity unit you’re getting getting 320, 000 capacity units per hour and then you can use that divide by your cost per hour and then you get a cost per CU per hour and then you can then go multiply that by how many cus in total were being consumed so basically you can go back your you can back your way into a dollar amount on amount on whatever those costs are doing he also makes it a very clear Point using reserved capacity is much cheaper so he he’s doing running the same capacity
3:40 he’s doing running the same capacity you go from like $45 down to $27 depending on what how many cus you’re using but the the reserve capacity definitely drops your pricing so if you can plan out consistent loads on your capacities and go buy some Reserve capacity price and you add that to your solution that will give you a discount on top of those fabric skews you’re purchasing you any most for your money that’s that’s that’s a good thing I’d agree I love this article yeah okay no I think you addressed I I don’t know
4:10 no I think you addressed I I don’t know if you like did it in your your your good summary here Mike but the you you’ve pushed off on the topic earlier where companies we’ve talked about the challenges sometimes of the the new things in fabric the new ways to do stuff there so much more that’s going to be introduced to the business and are are they going to explore it to to the degree that they could and the answer I I think in some of our previous podcast is like no there’s no expectation that one individual is going
4:40 expectation that one individual is going to learn all this stuff however if a business goes like uses articles like these and says I’m sorry you’re telling me we could rebuild our things and have 5x less processing and increase the longevity of the current capacity we’re on well now that’s a net cost saving exercise for resources that I have yep go learn it right now it becomes part of the job because there are new things that are
5:11 because there are new things that are going to open these doors for different patterns that other that folks aren’t aren’t familiar with so in this article which I also really appreciate here to your point Seth there’s a great little visual that he builds here’s a visual here is some information on the visual and he basically has a very consistent report page that goes through the comp comparison of a notebook orchestration versus a pipeline orchestration a copy activity inside a pipeline versus a copy activity in a notebook so he’s going through some other items here and
5:41 through some other items here and yeah the initial results on what he says and again I I like where where we’re going I want a little bit more other Engineers other results I need a third party confirmation of results here but basically the general pattern here is things that are occurring inside the pipeline are about 4X more expensive in compute unit than it is in spark doing the same thing so he has some simple pipelines for example like get a list execute a pipeline now the pipeline sets
6:12 execute a pipeline now the pipeline sets a path does a copy populate the data so like there’s a store procedure running so he’s doing some things inside that like he’s trying to make a bit of load on there and I think a lot of this will be it depends on what activities you’re doing right if you’re running an ssis package inside a pipeline that’s probably going to be a bit different of an expense than just running a copy paste and just moving data around so this idea this idea of or the challenge I guess I would say is how are we going to as Engineers look at these different designed
6:43 at these different designed architectures here’s what I’m doing in a pipeline yes for sure we can do it in a spark notebook but can we guarantee the amount of savings and CU that we need to to make the transformation from one to the other anyways it just I found this very interesting I knew this in the back of my head running a pipeline versus running data flow versus running a spark notebook will not have the same compute unit per job that you’re running so it’s going to be really important that you if you have big projects
7:13 you if you have big projects with long running activities it probably would be worthwhile your time to figure out which compute engine is the most efficient doing that job now it will take you a little bit more design time up front over time I think there’s going to be more articles people will continue to like explain this a bit more in detail and we’ll get to a place where okay we can generally say there’s some more general rule of thumb things oh a pipeline’s like 2x more expensive than a this that and the other thing a data flow will be the most expensive because of XYZ things like there’ll be probably
7:45 of XYZ things like there’ll be probably be some be some General guidelines you can go after but I’m very encouraged that the spark experience is fast and uses few cus because that’s the experience that I like to use right the Assumption though is a four the Delta here is pretty significant so the the wide assumption would be oh we should just move everything or as much as we can to spark notebooks but that’s not always the case and I think yet no I
8:15 always the case and I think yet no I think I’m not I wouldn’t so I wouldn’t be so firm in that statement I would be we don’t know we need more testing that’s what I would say like it’s but it’s looking promising that potentially you could save compute units and do three times four times more work in a spark notebook without paying extra money which is well this job is in this case like it’s not extra money that like I see what you’re saying it’s capacity time correct you’re paying for
8:46 capacity time correct you’re paying for like the different models between cost do change one right one is this would be saving direct cost because time is money because you’re using like pay as you go correct like the fscq is a little bit different take on that where where you’re incurring a cost for the capacity that does many different types of workloads and this is a cost-saving measure in the in the perspective that you’re not utilizing as much capacity so there’s more capacity to do other things
9:17 there’s more capacity to do other things correct which means you’re going to extend the the life of how long you can live on that existing capacity while continuing to develop new patterns new new processing and and things so there is a net net but it’s even more important to understand these nuances like are outlined in this article right because there is that you you’re going to hit that point at which the decision is man things are slowing down do we do we beef up the capacity what’s taking
9:47 we beef up the capacity what’s taking the the most like usage what’s using the most of our capacity During certain time frames and Analysis of that like this does highlights will highlight those areas of potential performance Improvement right so if you’re rolling into an fcq and everything is not using spark capacities there might be a huge opportunity to say wow okay well somebody’s gonna ramp up we’re going to take on this this load but the potential
10:18 take on this this load but the potential longevity of moving all our pipelines is we could extend this same capacity for another year or two that’s a big deal it’s worth the investment and I’ll tell you what even more now thank goodness for folders in workspaces oh my goodness tell me about it amount of more notebooks that you need it’s been so nice having folders and yeah I don’t care if it’s in beta forever or public preview I’m using them I’m using them 100% I agree with you 100% And and there yes agree but to your
10:50 100% And and there yes agree but to your point though Tommy like if you’re doing this testing this is the these are the things and and again I’m also thinking I’m very Pro on hey we’re going to bring a bunch of business users into fabric that’s what’s coming that’s the users that are coming now currently there may be more data engineers and data scientists future stepping into this but right now it’s a lot of business users so we’re going to be comfortable with power we’re going to be comfortable with data flows
11:12 going to be comfortable with data flows that’s what we’re going to be comfortable with I think we’ll have a easy migration path into pipelines because that will help us simplify some things but eventually there will be points where okay I’m comfortable with those two experiences now I’m ready to start learning some some notebooks I’m going to go a bit more technical on that side and I I found a lot of people shockingly I’ve been talking to clients like yeah I used to do python a long time ago but I don’t do it now well great I’ve got a got I’ve got a wonderful experience for you can you write can you write SQL yeah we can write SQL statements great getting to
11:42 write SQL statements great getting to Python and doing things there is not too far it’s definitely different but I say it’s not too far away from writing like lines of code and and understanding how to read the code and interpret it so if you if you can get your gr your head around using SQL I think there’s yes you still need to learn some things but it’s the jump or Gap between that and what you’re doing in Python’s not too far yeah and I think the cost thing is a a big part for me not to segue too much to the article but I I’m one of those people who is from the Pure powerbi Pro
12:12 people who is from the Pure powerbi Pro analyst and few years back started learning python also notebooks got a Raspberry Pi set of Jupiter Hub on it and yeah there’s a learning curve but two other episodes we’ve had guess what there’s also this thing called co-pilot that does lot of things for you a lot yeah granted that’s another cost that’s not on top of this but granted that’s also a see but again yeah to to our to our talking point earlier right there’s going to be a line item for co-pilot on
12:43 going to be a line item for co-pilot on a workspace on how much that’s being utilized right now you can back your way into a cost for that feature to be turned on in your tenant yeah so this article again illuminates more of like what is the implication of those cost to your point Seth if I’m using CU on co-pilot not using that CU to render a report to run a pipeline to do another thing so that is distinctly pulling away from our normal experience so that’s that’s where I it’s interesting to see how this is going to
13:14 interesting to see how this is going to play out I I wish the co-pilot experience was a little bit lower in the FSS I it doesn’t have to be at f2 level especially when you’re using parbi desktop it would be nice to turn on an F2 and have co-pilot work with my desktop cuz all I’m doing in desktop is asking for things to help me build stuff so maybe a couple builders get a smaller skew where they’re allowed to share the capacity to run co-pilot be out in two hours yeah I don’t know we’ll see what
13:44 know we’ll see what anyways I I I I like the article I thought it was good thought it was worth pointing out we have one more article here Seth I think you found this one you want to talk a little bit about the the visual calculations that you found from Jeffrey Wang and maybe explain who he is why is important so man Jeffrey is is a one of the founding people of Dax he’s on the obviously on the the powerbi Team like it it Jeffrey I think and
14:15 like it it Jeffrey I think and Marco probably talk daily so yeah regardless like just a brilliant man and very interesting to always be in the room when he’s talking ironically enough it’s really difficult to find his AR so like you got to catch the link he he’s got a site PBI Dax that he posts out on WordPress but anyway I think the it probably requires a full episode to start diving into visual calculations
14:46 to start diving into visual calculations but this is this is a really big deal that we probably haven’t talked about enough of on on the podcast yet and we probably should so we should probably change that I’m just brain barfing as I Reminisce about like reading through this article really quick highly recommend going and reading this because it’s the first of many that starts to deconstruct and and explain why Microsoft has built in this visual calculations layer into the parbi
15:18 visual calculations layer into the parbi desktop and it’s primarily focused at engaging business users and to get over the hump of learning Dax ultimately right because there’s this you go from Excel right cell byell formulas and it people become very comfortable with it excel’s been around for forever in a day and then you go to this construct in powerbi where it’s like you have this one measure and it’s repeatable and you use it everywhere and we talk about filter context and all these other things and it people are like oh okay I
15:50 things and it people are like oh okay I I get it how do I create a measure and it’s like oh you can do a sum and you can do these things and it’s like this really low barrier entry and the business us is like super excited and they’re like yeah I’m going to this is going to be awesome okay now I need to do time intelligence okay it’s like your learning curve just went through the roof y and if I was GNA pick one area where it’s like like this alone proves like visual calculations are are awesome and get to learn them is it just
16:23 awesome and get to learn them is it just removes the barrier of entry on a visual by visual layer to do these calculations and get the results that you would expect so how they went about doing this because it’s still all integrated into the semantic model and Dex Etc is was phenomenal path to actually be aware of but he this is the first of of the blogs or articles that he’s going to write and just gives a really great summary like here’s here’s the problem we’re trying to solve
16:53 here’s the problem we’re trying to solve here’s why it’s it’s really important and gives gives an example around time intelligence so go check it out get get involved in visual Cals and bring that into your repertoire of learning as I am to start to tell other people about it because I think it’s extremely powerful especially for the new user within powerbi but also and we’ve seen I’m going to foret forget his name right off the top of my head
17:23 his name right off the top of my head there’s some really cool interactions that can start to happen with objects and functionality with within the powerbi report and visual calculations to create some really great new types of experiences that otherwise would just be insanely hard to build with really complex stxs I think that’s the large impact right it really does have a use case and benefit for anyone on the skill scale right for new users or for someone who’s been doing Dax for a while I am very intrigued though on the focus on
17:54 very intrigued though on the focus on the new user right so do a lot of dashboard in a day trainings do a lot of introdu trainings and one of the things I always iterate when we talk when we first introduce Dax is this is not rocket science this is not like learning a new coding language however this is a conceptual change and that’s the hardest part of Dax because it’s a functional language it’s some calculate and you filter by something but it’s because it’s model to model that really affects everything and it always
18:25 really affects everything and it always depends on the model and it’s the evaluation context that’s the hard part the functions themselves not incredibly difficult but now this introduces almost like you said like a bit of circum going past that so I’m intrigued what you guys think because I’ve been pondering this and I’ve been trying to figure this out myself when if you’re going to a new user training or on boarding when do you introduce
18:55 on boarding when do you introduce visual calculations compared to kind our normal traditional learning pathway well let me let me cavey out some things here as well so I’m going to answer your question I do want to talk a little bit more about the article because I thought it was a really good example example here there’s two tables that are produced towards the bottom of the article and what Jeffrey does is he he says look we’re going to go look at the internals of the vertec engine what is it doing to the storage engine queries so what is it doing to go get the data and how’s it returning the data
19:25 the data and how’s it returning the data out and the first example he has the month of the year and he has a sales number and then he’s doing a year-to-date sales across that year period of time so you have a a normal just simple summing of a column whatever the month total was and then next to that he has the cumulative total which is generally when you are talking about expensive queries the ones that are expensive are cumulative ones so if you’re doing stuff with cumulative sums on things those get really expensive back to the query engine so
19:57 expensive back to the query engine so this is a pattern that Microsoft has observed apparently there’s and he talks in the article there are many patterns that that can be solved in unique and visual calculation ways but this is one where the cumulative the year-to-date sales is one that solves that so he shows you the original table with the original Dex and it shows you there are four queries to run the entire table and these are all being run against back to the engine so all those four queries are taking time they’re costing you compute units to render the report so it’s going to slow down things
20:28 report so it’s going to slow down things then does the same thing again and he says here’s the same example but this time my year-to-date sales is now going to be calculated using a sum or using a visual calculation same numbers same result but now everything can be rendered as a single query it’s one query back to the storage engine and we know the storage engine is where the expense comes from when we’re doing queries against the engine model because that’s it’s physically saying I need to go get the data from the stored portion of the model calculate things and bring
20:59 of the model calculate things and bring it back out so if I so I think the example to your point Tommy so answering your question when do we use visual calculations I still think this is an area where we’re going have to figure out where’s the best place to do this it would be nice and this is my opinion here it’d be nice if Microsoft could identify these patterns for me based on the the the formulas that I’m going to be using right there are year-to-date calculations that will need to be run so from my standpoint it would be nice if the visual gave you a little warning symbol and said hey this visual is using
21:31 symbol and said hey this visual is using a a pattern that we could generate inside a visual calculation if you change this from what you are doing to a visual calculation it will go faster so I don’t know if they can automatically do that yet or if there’s just you need to notify the users about this but this is one of is one of these these are one of these nuances Tommy like where it’s going to be like if what you’re doing you can make it faster and more efficient if you don’t you won’t know any different you won’t so or you’re just technical debt
22:01 won’t so or you’re just technical debt well the and the other trick or challenge I’m seeing here I think here is when you’re I love the idea of visual calculations I still have hesitation because those are stored in the visual I can query them through other processes but they’re not part of the main data model which probably is fine but I have to be aware that if I’m going to use a year-to-date sales
22:22 going to use a year-to-date sales calculation I can only use it on that single Visual and if I need to repeat it across multiple visuals think I need to copy paste the visual to other places and that would then keep the the calculation with it but now as a designer as as a as a governance person I’m a little bit more worried because now I could have multiple people doing things to visual calculations that it starts shifting how that definition of that thing looks yeah so it would definitely be one of those things that as when we talk about report report certification or like as an
22:53 report certification or like as an audience grows like you would say Hey I see what we’re doing this thing multiple times across these Pages we’re going to simplify that we’re going to create this one Dax measure that’s what’s going to be showing up or we’re using we have multiple reports on a model and those are all going right like we’re going to certify the data set like that’s where I would say like that would make sense to to do a conversion but you would know that you could do it it’s just one more thing to check on the box there because yeah probably a lot of
23:23 box there because yeah probably a lot of those metrics are probably business metrics that need to live the model because it’s part of the business right but but at the same time like the barrier to entry though right you’re lowering that bar and I think that’s that’s vastly important for expansion of business users to get the most out of powerbi right out of the gate without needing help I agree and I think this is also a pattern like Marco ruso was very Pro like let’s figure out how to do visual calculations cuz I’m also
23:53 to do visual calculations cuz I’m also thinking here too right if you want to do things like spark lines if you want to do things like other fancy visual based things inside the context of the visual there so in my mind there’s this delineation between there are things that belong in the model that are going to service many reports and there are things that are going to service styling featured bit like though single visual right so if there if there are visual aspects that are that are just styled or dacks that I’m writing to stylize that particular visual conditional formatting visual calculations things like that
24:25 visual calculations things like that then those should stay inside the report context because I don’t need to share them across other reports and so how do you identify that what does that look like I would I would air on the side of I like to have my main model simple because then it’s easier for people to understand it’s easier for people to build stuff on it you don’t have to be as organized with lots of folders I’m doing things now in my models where I’m saying here are my quote unquote base calculations and if I’m carrying special other calculations like hey I need to return instead of a
24:56 like hey I need to return instead of a null value I need to return some text it’s like dash dash right that could be very expensive if you put it in a table but not very expensive if you put it in a card so in some cases I’m now building other folders of measures that are like these are visual based calculations or these are the these are ones that are formatting I’m I’m taking the same sum but I’m doing some additional formatting on top of it that’s producing a different result so I’m keeping both measures the one to do the sum and the one that do the formatting contextually as well returning a dash or a number but
25:27 as well returning a dash or a number but I’m making them very specifically different and naming them and putting them in different folders so I know that these calculations are more visual Centric and where they should be used don’t use these calculations inside of inside a table use these on kpi cards like that’s what those are for so sometimes you have these very specific designed right styled measures for style things and I don’t know if these all should exist inside the main model yeah to to answer your question just spitballing I would if if I’m teaching new people I’m teaching the
25:59 teaching new people I’m teaching the foundations of tabular models and Dax first and why they’re important because it’s the same conversation we’re having right now it’s it’s fully extend extensible is it is it complicated some of these measures are complicated yes but they’re fully extensible in any any number of reports that the model touches right that’s the value behind them so but it it also like what I perceive is a great handoff point would be
26:29 great handoff point would be that conversation is here’s the simple stuff now let’s let me show you like one of the most useful things in Dax and you freak them out with like the time intelligence one y and then you’re like but here’s an easy path to get you started visual cels right be so so they now like you’re I I think it’s important to ingrain the value of why you would build it in in a Dax measure in the model itself versus a visual calculation
27:00 model itself versus a visual calculation but then like really highlight like you could you guys can continue right now getting value easily in a in a more easily digestible format on a visual by visual basis go at it right but as you’re learning here’s where you still want to shoot for because it’s more extensible right it’s more about like but that that’s just me I no I you the other way yeah then then people are like oh great you just gave me the easy path I don’t need to worry about the more
27:30 I don’t need to worry about the more complicated Dack stuff right and and you want them to learn that yeah so I I I like that I I do want to make a point of clarification so like I slaughtered the intro of Jeffrey Jeffrey has been with Microsoft for 20 years he’s a partner architect and has been working on dax’s programming language and that team in IM memory days for for that long so that’s why he he he is held in pretty high esteem so I I want to say I so I like
28:00 esteem so I I want to say I so I like this conversation here particularly around this latter part of the visual calculations piece of this in my mind I’m just going to I’m going to take out my mind out here and look at this big picture scenario here right if I think about what’s going on in these reports there’s no tooling that exists today that allows you to scan the model and all the associated reports and one see all the visual calculations that are listed inside those those reports because again if you change a core calculation and that’s using a visual
28:31 calculation and that’s using a visual calc as is the visual calcul using those core calculations it will change things so and this is also the same challenge with visual of measures that are inside the thin reports which also can happen too which is not bad my my thinking here is there is no which measures are most similar like so if I think about my organization and things that I want to govern I want to have the ability to say look here’s 20 models what what’s similar across the models what tables are we using what columns
29:02 tables are we using what columns are named what they are what’s unique what’s not unique I actually in my mind I’m thinking it’d be really nice to have the ven diagram of the common elements across those models at least I so I can see it right because stuff’s going to happen people are going to build things it’s just going to occur in the certified stuff I’m hoping that we have plans and documentation that helps support this already but when there’s a lot of self-service you don’t know so and then add to that now the visual s add to that now visual calculations and now we’ve gone two steps deeper into the
29:32 now we’ve gone two steps deeper into the design process of what things we want to be building and this is where I get a lot of like this is where my mind goes we built Dax do powerbi tips because we were thinking there is there is common Dax things that should be reused over and over again there’s a spark line I’m going to do a star rating one two three or four I’m going to do there’s there’s common patterns that I think that people or or Dax things that people have built that they want to reuse this is the same thing that Marco Russo did in sqlbi where they’re saying Dax
30:02 where they’re saying Dax patterns there’s literally a book of just showing you here are patterns you should be know and know how to do because those patterns will occur over and over again I want a library of all these patterns at the visual calculation level at the thin report level and at the model level and what should be happening is you should be having your smartest people in Dax on your team building the pattern that we’re going to use use producing that pattern to the organization and so when I’m in a report
30:32 organization and so when I’m in a report it should no longer be I need to write the Dax it should be I know I need this Dax here yeah but it’s still they still have to understand the concept they still have to understand the concepts of what it’s doing and whatnot like so I agree I agree with you that would be helpful but like where my mind goes is okay H how much easier is it now for a co-pilot to recommend what the measure should be when somebody actually builds it the visual Cal and says Yep this is what I what I want and I’m not worried not so worried
31:03 want and I’m not worried not so worried about that I don’t know can you do annotations is there a way you can annotate a measure I know you can annotate tables and other things I’m not sure if annotations work there but all the reason why I’m saying these things is because the tooling has gotten much better for us to decompress what’s inside these reports and the models and it’s all code based so semantic link is where I’m going with this is this is a great transition moment because you can run additional decks against the models I don’t think you can the reports yet but you can run Dax against a model to spit out either
31:34 against a model to spit out either tables of data information from there or you can actually go in and get information about the model here are all the measures and their definitions so I very easily could see here in the future where we’re saying throw 15 models at this semantic link and the semantic link will then be able to read all those models and spit out details that we could then do analysis on later are there calculations that are named the same what are those what is the difference in those calculations or not and you can then figure out how to address or govern more things later on
32:05 address or govern more things later on so I think this is a good point to transition from what we were talking about which was visual calculations into now what is semantic link Tommy I think you’ve done some work in semantic link you want to start us off with a an initial definition of semantic link stuff semantic link is a python library or a python package that’s available in fabric notebooks that actually allows you to treat a semantic model as a data set that’s commonly used or data
32:36 set that’s commonly used or data frame we can now evaluate pull data semantic models tables and measures and make that our own data frame and we can choose what we want from semantic links we can do the DMV views Dynamic management views and then we can push that to other places treat it as a common data frame anything you you can do in a data frame now anything you can do in a jupyter notebook now you can use that with the semantic model and there’s a large impact here if you’ve
33:06 there’s a large impact here if you’ve done Jupiter notebooks before or if you’ve used this normally what are we dealing with is raw data going back to our beginning conversation I have to do data engineering and clean up or move this data around usually that’s just raw data that we’re making a data frame but now I can treat that I can actually use a semantic link and for me that further goes on that path of the semantic model is no longer the end path or the final stop in your destination
33:33 or the final stop in your destination with powerbi the extensibility of a semantic model really is impacted in changes here so wh why why would a notebook want to pull data like so I’m just thinking like yeah high level concept here right all right I’ve made a semantic model I’ve published it out there’s data in it we’re we’re spending time loading that data getting it groomed like and there are business users that are using reports that are looking at that model so we have a a similar definition what’s going on there
34:03 similar definition what’s going on there what is the value of semantic link what are the use cases of why I’d want to use it inside a notebook it’s it’s not a visual layer it’s not an interactive layer that I would be going through what does what are the implications of what this means I guess is what I’m trying to get get to where do you want me to start so let’s just list one idea let’s I’m I’m throwing a lob I’m lobbing a softball you because there’s a lot of think there are a lot of use cases for this I’m just looking for what is one use case Tom me that you can think of
34:33 use case Tom me that you can think of let’s start with even taking data science out of it validation right and I think because that’s been the Common Core problem for so many of our conversations around how do we validate our powerbi data right right data quality okay I want to hang on this so don’t go to the next topic I think this is this is the one I was like I was thinking the same thing on this one I yeah I like this one I’m I’m vibing with you in this one down yeah so let me give you a scenario of what things what
35:04 you a scenario of what things what happens and I think this does occur maybe varying May varying degrees in your organization right I build a semantic model we we develop it we put it it into Dev dev has a different data set than other environments but in the dev environment I’m able to push the model and I can see the model bringing in data doing its aggregations and then I know I have a table with a certain Dimension whatever the dimension may be product something and then there’s a measure attached to it the data that is loaded into that model there are there
35:35 loaded into that model there are there the the sums the aggregations of those things come to a certain amount when I go over to test environment I do the same thing but now the data set is different I’m looking at a different database to support that information and then if I go to production there’s yet another different data set or data source that’s supporting that model in each of those scenarios I could verify that the partitions or the things that I’m doing down below have the right amount of data in them to give me the total for 2013 right so my assumption
36:07 total for 2013 right so my assumption would be is if I know 2013 has data in it and I know from past builds it’s you it and I know from past builds it’s 1. 2 million in sales I would expect know 1. 2 million in sales I would expect every time I make a new change to that model moving forward when I take the total of 2013 if that data is expected to exist in there that number would not change in future versions so there is this concept of data Ops or verifying like I made changes to a model and I have to either incrementally refresh load some data into it but as we do this
36:37 load some data into it but as we do this in our process we want to verify that we we captured all the data everything’s there right I didn’t miss a partition in loading something didn’t fail I’m getting the data that I should be so as I change the model I really want like a test that says yep the data is there we loaded it all correctly we’re good to go move forward so I see that as being a valuable effort and the more you can automate those things right the easier it will be for you to verify that the reports are actually doing what they
37:07 reports are actually doing what they should be and you and to from a central again I’m I’m going to be very clear here I’m going to lean on this again if it’s self-service stuff probably not writing tests if it’s Central bi and it’s certified probably thinking about what can I do to write tests so to me I see semantic link being a test writing tool where I can can take a copy of old data save it somewhere as basically take a readout here’s some Dimensions here’s some aggregations I’m going to take that information I’m going
37:37 going to take that information I’m going to save it into the lake house I’m going to rebuild the model or add things to the model or make changes to the model and the next time I create a build the semantic link runs creates the same table with the same dimensions and goes back to verify okay against that other table I saved previously how different are we are we the same are the numbers identical great numbers the same move on we’re good to go and I think this occurs a lot more in financial reporting than it does in other areas just where I’ve seen it people talking about this more
38:09 people talking about this more frequently so I’ll take your say yeah I’ll take your same example and even without from the data Ops of like I said the Common Core problems we’ve had from the from business data of hey we’re expecting 15 sales reps I’m expecting the measure to be X Y and Z and that’s always been the most difficult thing to do from a testing point of view correct and so you’re You’re Building like what we do right now is you build another report that has a table in it that has the and you’re like okay I’m gonna screenshot that and put it over
38:40 gonna screenshot that and put it over here and then I’m gonna I’m gonna run the model I’m gonna push it out and I’m okay okay I’m gonna look at the screenshot and I’m gon to compare like so it’s a it’s a yeah it’s a human based process that’s comparing one to the not wrong it just it if I could do that in a half a second or a couple milliseconds by automating that thing I could run that’s one test but what if I want 60 tests like that’s 60 Pages potentially of things you’re trying to produce to make sure that the data is coming out consistently again for Central bi stuff I think you don’t again to be very clear
39:10 I think you don’t again to be very clear you don’t need to build all tests up front at the beginning but when you find a problem that maybe an opportunity to spend a little extra time to build a test around this and John kky who has a Blog around all the he’s on like blog what 56 yeah 600 now I don’t know what I don’t know what blog number is but he’s been literally running this series of like here’s why data Ops and cicd is so important for your organization it helps with consistency and it helps you build product data products that are consistent every time and I 100% agree
39:41 consistent every time and I 100% agree and buy into this into the thinking Seth I know you’ve been Ming on on some ideas so I’m gonna pick on no I agree with you guys I agree with you guys in terms of verification but I I also like the the highest value I I see out of this relationship is just the time-saving in development because the and it’s ironic to me that well we can get into it I would have flip-flopped the article I would have led with some of the things towards the end and put those front and center
40:11 end and put those front and center because one of the biggest challenges we have with updating or adding something into a model is understanding what the relationships of that model are and and what this is uncovering is that that lineage that you’re talking about is I can look into my model I can use things like list relationships or plot dependencies and all just instantly get that visual representation of like the model relationship from the model yep
40:42 model relationship from the model yep into a data frame where I’m like oh okay yeah I’m going to update this this is the relationship in there this is how that’s going to impact you this is how that’s going to impact the report Etc and it it just saves know the report Etc and it it just saves me from having to have the two screen opening up the powerbi PBX file looking at the relationships Etc so it’s a timesaver in that regard and it also verifies that like yeah this is designed how I wanted to or to your point Mike verify from a environment to environment right like I’m we’re making major
41:12 right like I’m we’re making major changes to the model this is expected here’s how we’re going to do things whatever I’m just doing that that double check right in in the code that I’m in before I do any deployment oh man that even goes back too steth to our previous article on Dat the abnormalities or outliers too there’s a lot of use cases here sure to your point Tommy though as well like there we can only control what we control and I want to hang on that point you made there Tommy I think that’s
41:42 you made there Tommy I think that’s understated what you said there if I’m looking at production data and we’re having some production change or issue or whatever you’re saying the model not necessarily just a database right I’m talking about like the database Source right so let’s let’s say something something changed in the data source right you’re you’re assuming the data for 2023 was not changing but something went wrong something didn’t load maybe something didn’t refresh properly again A lot of times I see inside organizations there’s a lot of trunk reload stuff right things may change we don’t know what will be changing but we’re going to trunk reload tables of information in production
42:14 tables of information in production because we’re going to Stage the data from The Source system we’re going to do some transformations to it we’re going to lift it over so if you’re doing that stuff even so the report can’t tell you the number of times I’ve been in a call like this my report your report wrong the report’s wrong okay let me go in the report well looks like the numbers are showing the right not value let me go back to the source system oh yeah Source systems missing data what’s going on there oh yeah we had a job fail or something didn’t load correctly or we made a change and and no one told anyone it’s going to happen it’s there but if
42:45 it’s going to happen it’s there but if my reports going to sea levels and they’re telling me my reports wrong I’m like look I I’m just reporting on what data you’ve presented to me we’ve had a lot of discussions with hey your data is missing stuff like you’re literally there’s problems in your data and the the model is just exposing those challenges because you’ve never like when you were doing this in Excel you couldn’t find the issue now that we’re in powerbi we can see much more data faster and have better aggregations you’re now seeing the problem of your bad data so so this happens and so I think this will also help us debug
43:15 think this will also help us debug things when there are problems with the data solution where does this really exist is it in the model or potentially could have been in the source system sorry I didn’t mean to hang on that point I I I think like I said for me I the not that some of that wasn’t available before with the database but for me this impact is like I said this elevation or putting the semantic model on the same basically the same plan as a database in terms of what do
43:45 plan as a database in terms of what do you do with a database you query it you pull data and then you you we’re pushing into reports or doing other things with that and models have always been till this point that again End Road there’s no able external tooling to be able to work on that model so this is at really big impact here I don’t know if you have anything else here but I think I would love for you to pull the our listeners and ask because I’m assuming out of our five listeners that we have or 10 listeners that we
44:15 that we have or 10 listeners that we have maybe three are experienced with J notebooks in Python right if if this is a powerbi a powerbi podcast I would probably put at the maybe the 30% and I think that would be if if I assume right not anymore we’ve explored we’ve been pushing these folks so hard from fa out of fabric like they’re all like I would say it’s it’s okay I’m will to put some for that or I
44:42 okay I’m will to put some for that or I I will so I’m not going to be as specific with numbers because I don’t think the numbers are going to be very I I have no way of knowing like I’m not talking to everyone who listens to podcast all five of you I don’t talk to you so I don’t I couldn’t I could do it but I can’t I don’t have enough time so here’s what I would say today what is this what is the size of audience that uses python notebooks and is comfortable in using them today I’m going to say minimal it’s going to be smaller right but if we look six months from now one year from now I think we’re going to see
45:13 year from now I think we’re going to see that experience and that audience continue to increase and and one thing that I’m and here’s here’s a data point that I’m using to proxy this by right look at the number of people now communicating about synaptic link or sorry semantic link and notebooks and experiences notebooks and testing about notebooks so like the article we brought out earlier right testing a spark notebook against a pipeline doing the same activities right in my mind I’m looking at this going hey people are where the blogs are going or where people’s interests are leaning towards so because
45:45 interests are leaning towards so because this whole notebook experience is brand spanking new I feel like right now I’m seeing a a flurry of like notebook experience-based things that are ramping up who’s the other gentleman who oh Ruby mono so ruie was doing a demo at fabric conference his prior demos and most of the stuff that he built ruy has a monitoring solution that you can use in your organization to monitor your tenant all built in Powershell it was 100% Powershell yeah his new demos are not even using Powershell all the new demos are 100% based inside notebooks so even
46:17 are 100% based inside notebooks so even the Microsoft product team is shifting their workloads away from other tools that could get their job done they’re now moving them into notebooks and experience exp is there so that you need the plethora of documentation and experiences first before people feel comfortable reading the blog following along and getting into it and that’s that’s why powerp tips existed right we existed at the beginning to get people building visuals and doing tricks and tips there around the visuals and you tips there around the visuals and when people started at Mass
46:48 know when people started at Mass communicating about this everyone’s like oh this is interesting oh I’m learning this stuff here great so that barrier to learn these things is going to get less and less and less as more people blog about it so all that yeah small now I think it’s going to increase larger over time so this is a good thing to learn because I see a lot of blogs and I think other interest is very it’s high it’s high right now in this area Tommy so Tommy you you led with the semantic model or semantic link making the semantic model model not be the end anymore what do you mean by
47:20 be the end anymore what do you mean by that what use cases are you thinking of that or that’s still not the case well so the I think the major part we just said was data validation we’ve never been able to really do this effectively or scale this because there was really again no tooling to say let me pull the semantic model into another tool and then have create some automation I had a the only way was a report level or thin report I can now treat a semantic model as a data frame I can now pull that in any way I
47:51 frame I can now pull that in any way I would normally do jupyter notebooks which is how much we usually do a data validation that’s I think the core way I think the second core we’re going to see is for all those data scientists out there because what do they the the the the joke is 80% of the time time that data scientist work on or whatever they work 80% of the time on data cleaning I can give you clean data now right off the bat all the outliers the right metrics that you have to use you
48:21 right metrics that you have to use you don’t have to recreate that and further you’re using the business data as already SP specified because we’ve already created the dimensions that have been validated we’ve already created the measures that we use in our reports so what we’re you’re using I’m using and that is integral rather than them having to start with their own raw data but it’s not a replacement replacement for what for their existing data sources I sources well so there there’s a
48:53 mean well so there there’s a couple things one is I would hope that like ideally you’re providing your gold layer level data like it’s curated it’s shaped it’s sourced from the same place that’s going into the semantic model for data sources that they’re pulling into machine learning processes right to enhance okay I I think there is an argument where hey having a connection or an understanding of the
49:24 connection or an understanding of the measures right the additional B business logic of calculations and grouping and how we’re looking at data in a model is very helpful from a the the same way that it’s helpful for us to reach into the model and look at relationships for data for data verification right but I’m I can’t replace I can’t take that data set and replace that as my source for all of my
49:54 replace that as my source for all of my data science you can now for no you can’t because the very fact of that data set includes the measure outputs so if I’m building data science against that and I’m needing to enhance data I’m not using the measures my enhancement has to be the raw data going into the model itself so is it useful for analysis yes but it’s not useful for like this being a cycle of I can pull from the model pull back in and shoot
50:26 from the model pull back in and shoot through enhancements because measure like like the data sets aren’t they don’t exist like that like the aggregation layer is in the semantic layer so I see your point Seth I I agree with you to some degree I will also think I think I think part of the story here is there is business logic buried in that model anyways and I do think there’s some use case where you there depends on what machine learning or AI stuff you want to do right so if you need all the raw data probably not a
50:56 you need all the raw data probably not a good place to go to the model you’re probably looking at a lake to go get the stuff from however if we’re doing some very basic predictive things or some you very basic predictive things or some correlation things across some know correlation things across some pieces of the model I do think there’s actually a very solid use case for picking a handful of Dimensions from the model and to pick a couple of measures produce a large table of data and that be becomes used to show correlations there’s some predictive things about weekly monthly Baby by product so sure but some of that I think is used there if you’re only using the table
51:28 there if you’re only using the table information from the sematic model that should be accessible to you in the back end yes I I would agree I think I think it’s I think I think I’m gonna say I yes I agree with that it should be available to you in the back end but do you want you want to if I’m to if I’m building systems that will consume from the model and potentially go back into the model right I’m what I’m my mind is thinking is look I’m someone’s tasked me
51:59 thinking is look I’m someone’s tasked me with doing some predictive things off of this model we want to do some forecasting or some maybe projections around byproduct by region something like that it’ be really nice to have a model to have all that in it and then be able to do the data science use synaptic link H use synaptic link link semantic semantic data set the semantic I’m getting I must be tired at something I don’t know use sem use semantic link to go get the data produce the table produce the forecast and then
52:29 the table produce the forecast and then basically update a table that the model can then go refresh itself and then use I do think potentially there’s a round robin exercise here of model publish get data out do some things push it back into the model and then there’s a a separate page that’s doing some predictive things with it I’m just saying I think I think it exist I think it’s going to exist people will want to build it not arguing that’s the right way to do everything so I think there’s my my point is this I I think the semantic model is still the
52:59 think the semantic model is still the end I think like if you look at the the beginnings of the article like it what what’s always important to me with a lot of these features is understanding what the use case is because like there’s so many that I could be like what did you who did you build this for and it states by bridging this Gap we aim to empower business analysts to utilize modern data tools with their data enable powerbi developers to streamline automation tasks and facilitate seamless collaboration with data scientists I think there’s the analysis part of this
53:30 think there’s the analysis part of this in understanding what the end state of of things is is hugely important and valuable right I love the fact that you can plug into this thing so that all these groups now have a clear understanding of the last layer of business logic and that’s what the semantic layer is like the data sets that we’re building for the business include that last layer of of filtering measure like calculations
54:00 measure like calculations that’s being presented to them that is otherwise otherwise obfuscated in the whatever layer you’re pulling from and that is extremely valuable so as I’m developing something as a data scientist or whatever I now have that full link and I could say hey I’m plugged into the gold layer we’re doing these things I’m going to Output this confidence level or whatever the case may be this is going to get interjected into the model and even to your your point Mike I can I can push
54:30 your your point Mike I can I can push this into a test model and I can see what that does to the me the the measures and the calculations and everything end to end so I have a full cycle of deployment where there’s no longer this ambiguity or this like trade-off between the teams etc etc but that doesn’t mean that I’m using this this semantic link as a push back through of data and that’s my point and I see what saying because there are there’s the two cases of data science I think you were on one side I’m
55:01 science I think you were on one side I’m on the other there’s the ad hoc analysis but then there’s also data science enhancements like lead quality you’re GNA probably want that in your model of what no that’s exactly the point yeah okay so that’s part of the automation I so I was on the the scale of I can do a lot General forecasting or starting off using some of our already original business data but yeah now the nice thing we already have the notebooks and lake houses to do that but I see exactly like ad hoc analysis analysis that’s my
55:31 like ad hoc analysis analysis that’s my point of this link in my my mind opens the door for like gamechanging analysis where where why I’m drawing that line in the sand at least cognitively in the argument here is because I don’t see this as another data source after into feeding something else I don’t no and that’s what I think the
55:55 I don’t no and that’s what I think the the confusion around some of that wording was when you were pushing that point so I agree with you set there but I I I I get the feeling that Microsoft doesn’t really want to limit you in that space like I I think there’s going to be regardless of I I think there’s going to be a need or at least a request to say I want to pull stuff from the model and I want to do data science on that now should we debatable I I think to your point Seth I think a proper data
56:26 point Seth I think a proper data scientist or proper analysis of things should be going after the raw data or the silver data or even groomed tables in Gold that are doing something that are preparing it for you so to your point set like if you’re doing proper design yeah that stuff should exist but if we’re not doing that if we’re so one of the things that was announced at fabric conference was if you have an import model from random things import models now living in fabric can be queried right through the lake so the lake house will then take those imported tables put them back into the model so
56:57 tables put them back into the model so potentially there’s other things here where I’m doing potentially other data engineering things there’s potential departments that are doing weird stuff with their do you want to own that probably not but as a data scientist I may want to least tap into the data and say hey we’re going to do some experiments around this information does it seem like we could actually get some value out of this and do some predictive things cool now I’ve got a whole plethora of tables in from existing models or other places don’t that don’t technically exist and maybe it maybe that’s it maybe that model is what it owns and they’re not
57:28 model is what it owns and they’re not going to expose the raw tables under the hood to data scientists but the business unit has someone who needs has a need there and there may be a servicing mechanism of that model get service to that data that data scientist to do some things I don’t know how strong that use case is I don’t know how again I I have not done I’ve played with it I can get data out but I have not worked with a data scientist to say does this add value to you I don’t have I can’t speak exactly to that point but I think people are going to ask for it and want to do it well and I’m not close down the conversation I think it’s the right the
57:58 conversation I think it’s the right the right back or writing into a model of of things that you would do that is like fundamentally just not there and would be really complicated to do but I think that opens also another door another door of okay we’re building semantic models to serve reporting for the business does it have all the data required that a data scientist would need to do X thing or enhance it in such way and if not what am I what am I now talking about I’m now talking about introducing more data into a semantic
58:29 introducing more data into a semantic model for the purposes of these Downstream things and bloating my models to to be a source as opposed to the destination for final final business logic I’m gonna be I’m GNA be really devil advocate here for a moment because you just said something that triggered a lot of other thoughts in my mind I’m getting really excited here you just mentioned right back and we’ve never had right back before in any model granted but but now with now with models that live on top like so I’m getting little SP my mind here could you update
59:00 little SP my mind here could you update the the model the The Source data with whatever so let’s think about direct Lake right I’ve got a model sitting on top of a lake a lake house the direct lake is working so that means that data is technically up to dat and refresh within a couple minutes essentially right there’s still refreshing happening but you can turn it on manually all that fun stuff you could use model running pull data from model write data back down to Lakehouse and that’s a table that exists you’re either adding rows or app pending data into it you
59:30 rows or app pending data into it you could build a process that that notebook does some things processes some data down and I’m even thinking here Tommy my mind go table then you and and develop a measure that produces that yeah all all of that is possible so you you potentially could go into the model create some data you could even put a button on the report that says trigger this that would then run the notebook at this time so you could literally say oh my gosh my mind’s blowing up wow we have a model with a button you select some
60:00 a model with a button you select some things on a table you could say go and then it would say produce some calculation it would then be able to use input parameters from the model or whatever you’re trying to do there that all could be sourced as data points you could run the notebook The Notebook could complete rows of data write it back to Lakehouse and then in a short amount of time the Nota could even refresh the individual table that you just changed not the whole model so you you have you have faster round robin of right back that
60:30 faster round robin of right back that could occur with lake houses so this is also something mean I’m I’m thinking this from a notebook and what we’re doing here from semantic a synaptic link semantic semantic semantic link I’m gonna get it right one of these times semantic link but this could also be a new mechanism for us to actually use a proper right back from a report you’re assuming you can write into those tables directly well that’s what direct Lake does direct Lake you’re writing the the tables that
61:00 Lake you’re writing the the tables that are in the model are the tables that are in the lake you’re reading so if I have semantic Mo semantic link I’m reading the model which is again some of the tables already from do those enhancements and then just push back to the I’m familiar that the back end of all this is Delta tables right but where where is a use case bin that I can write directly into the table that is the source forel you don’t need to write into the table for the model because everything is so fast you don’t you just write back to the
61:30 you don’t you just write back to the Lakehouse and The Lakehouse just handles all the downstream everything for you automatically so you’re not you’re not even you don’t even touch the model it’s literally the model servicing the data you’re doing some things you’re writing back to the lake house and then in the semantic link notebook you’re saying hey here’s the table I just wrote data to don’t refresh the whole model just refresh that one table in direct Lake you can do that and then we can then have that one table appear fresh and then the model within call it a minute or two or less can have a you
62:00 minute or two or less can have a you minute or two or less can have a it can be completed and the data know it can be completed and the data can be updated so that’s a very interesting round robin use case that could potentially be utilized here testing needs to ensue like I’m a little worried because this is the second time today you and I had the same thought at the same time yeah we must be drinking thee I’m glad it’s you two because if I was think to Tommy I don’t know what I would do interesting yeah like that would would be it would be it would be interesting
62:30 be it would be it would be interesting yeah let’s let’s let’s I think this is I think this is worthy so you heard it here first on the exposit measures podcast a a round robin loop from semantic link all the way back to model back into reports so Tommy this sounds to me like we need to mock up a demo and do a little learn fabric around how this potentially this pattern this cyclical pattern of like use semantic link get data out do something with it potentially write back to model and then see that data appear in the report would be cool be interesting we need do that demo for us and for some of my clients who were
63:00 us and for some of my clients who were doing data science they’re like listen we love to use powerbi but we’re using our own data because we can’t literally we’ve heard we can’t actually use like whatever models they’re using we can’t use so yeah correct so yeah anyways we’re over time I think this has been a full hour of things so I like this things let’s just do final thoughts here so on so semantic link some final thoughts Seth what’s your final thoughts or wrap up thought around semantic link love the analysis aspect of it there are some significant immediate use cases the fact that we can
63:31 immediate use cases the fact that we can reach into the model and pull out measures and the like lineage views of things I think is going to speed up development tons of different verification data quality things and who knows you guys may prove me wrong and there might be a right back case here and a huge conversation once again around the data science aspects of semantic link I don’t think that yeah go ahead Tommy your your final thoughts I want I want to speak to the SE the other 70% of users who may feel intimidated by python or jupyter notebooks right now
64:01 python or jupyter notebooks right now because for this whole conversation you’re going either oh no or a lot of Googling listen there’s a learning curve not saying that learning curve is not worth it though there are so many sources to get started if you are feel intimidated by jupyter notebooks or python notebooks or whatever it is in fabric just get started if you already have co-pilot just begin that process and I wouldn’t encourag to start it now there actually is I I would say this also too there is some really good
64:31 also too there is some really good documentation from Microsoft there’s some really good tutorials there’s also a lot of partner workshops coming out recently so Microsoft has a lot of Partners of Microsoft going out and doing like Fabric in a day learn how to do fabric I’d highly recommend get do those experiences go find some of those there’s a lot of really good experiences around those items because that’ll really again you need to you need to dedicate yourself some time you need to pull yourself away from your normal workflow go in build the objects that you need and see how easy it is to
65:01 that you need and see how easy it is to get some of this stuff started I think that will then immediately start reducing some of your angst around your agida around all those pieces around using notebooks there you go Tommy that was for you bud there you go my first Italian word right there I’m I’m not I’m not a good Italian I don’t know my words as much as perfect use all right Perfect all right good good use of the word all right my final thought here is I think this opens up a lot of possibilities you will need to find what patterns work for your organization I believe there will be trade-offs with the ability to write back from semantic
65:31 the ability to write back from semantic link into models and things like that as well but there I think again this is what why I love the powerbi community and particularly the now fabric Community I guess I should call it there’s a lot of people trying to figure this stuff out there’s a lot of examples getting shown there’s people doing YouTube videos on this there’s people showing and and giving you patterns here so take this as an education moment and I can’t stress enough how important it is for you you to work with your boss your leaders your people to give you some time to discover and work on new things because I
66:02 and work on new things because I there’s a lot of things coming and it’s it’s it’s going to be an experience where I think people need to continue to invest in it because it’s it’s going to get better this is powerbi has already changed my career I see fabric enforcing my career decision to move towards powerbi and that’s going to be important for a lot of people anyways with that thank you all so much we appreciate your time thank you for listening for over an hour today so we’ve wasted a lot of your time today we appreciate you and our only ask is please share this with
66:32 our only ask is please share this with somebody else if you found this conversation valuable Tommy where else can you find the podcast you can find us in apple Spotify or wherever you get your podcast make sure to subscribe and leave a rating it helps us out a ton do you have a question an idea or a topic that you want us to talk about in a future episode head over to powerbi. com a. m. Central and join the conversation on all powerbi do tips social media channels awesome thank you
67:03 social media channels awesome thank you so much and we’ll see you next time
Thank You
Thanks for listening! If you enjoyed the episode, please subscribe and leave a review—it helps others find the show.