Mailbag! PBI Self Service - Not Catching On? – Ep. 354
In this mailbag episode, Mike and Tommy dig into why Power BI self-service adoption can stall and what leaders can do to make it stick. They cover practical governance, enablement, and culture shifts that turn ‘build-it-yourself’ into a repeatable analytics habit.
News & Announcements
-
Diagramming for DAX with Generative AI – Prompting BI — Prompting BI
-
Getting Started with Prompting – Intro to Context – Prompting BI — Prompting BI
-
Announcing New Data Factory Connectors Released in Q3 2024 | Microsoft Fabric Blog | Microsoft Fabric — We are excited to announce the release of several powerful new connectors in Fabric Data Factory in Q3 2024! These connectors will significantly enhance your data integration and transformation capabilities, enabling…
-
Introducing the New Feature in Lakehouse Connector in Fabric Data Factory: Schema Support for Reading and Writing Data | Microsoft Fabric Blog | Microsoft Fabric — Fabric Lakehouse supports the creation of custom schemas. Schemas allow users to group tables together for better data discovery, access control, and more. This is now a Preview feature in Fabric. Learn more here. We…
Main Discussion
Self-service BI isn’t just “give people Desktop and let them cook.” Mike and Tommy unpack why adoption stalls after the initial excitement and what to do about it.
Why self-service adoption stalls
They talk through common failure modes: unclear ownership, inconsistent definitions, and teams shipping reports without a shared “source of truth.” When people can’t trust the numbers (or can’t find the right report), they revert to exports and spreadsheets.
Governance that enables (instead of blocking)
The conversation hits the idea that governance should create safe lanes for self-service: clear data products, certified datasets, and guardrails that make the right path the easy path. The goal is to reduce rework and “report sprawl,” not create a permission maze.
Enablement, habits, and community
Adoption also needs enablement: training, office hours, templates, and a support loop that helps people succeed quickly. A small internal community—where wins get shared and patterns are repeated—can do more than any policy document.
Looking Forward
If you want self-service to stick, treat it like a product: define what “good” looks like, build a repeatable path (data + model + standards), and create feedback loops so the system improves over time.
Episode Transcript
0:31 good morning and welcome back to the explicit meas podcast with Tommy Seth and Mike good morning everybody good morning gentlemen good morning Seth and your wonderful smile love because it just brightens up my morning does it warm the cockos of your heart warms my soul I don’t know if you could feel it in the audio his smile just beaming through running right now you’re just like I’m getting happy I
1:01 now you’re just like I’m getting happy I don’t know why Tommy it just the rather than being someone that that shares my smile all the time where it’s meaningless it just I like I I reserve it for very special occasions and I think it just it just means more I just want to know what it’s like to be that positive all the time you’ll never know you’ll never know because there’s this Sheen this face that is just plaster most most of the time and most people think I’m very
1:32 time and most people think I’m very upset and inside sometimes I am but it’s not always the case but you don’t know way like you case but you don’t know way like at least I always look angry I know at least I always look angry I guess consistent I’ll say that you’re consistent it took me 50 episodes to go I think what I said he’s okay with and he’s not pissed at so that’s funny always keeps you interested on your keeps you on your toes Tommy keep you on your toes jumping in today we have a a really good topic for today we’re
2:03 a really good topic for today we’re going to have a mailbag today talking about powerbi self-service and thinking about personalization we have a question around this one today so we’ll address that question that’ll set do his mailbag voice and we will read our question today and go through just kind question today and go through just some topics around leveraging of some topics around leveraging har. com using personalization and seeing how that works for selfservice items but that being said we have a couple news items here a lot of things have come out recently Tommy you’ve been quite busy on the blogging front a little
2:33 busy on the blogging front a little bit here prompting bi has put out a diagramming for Dax with generative AI Tommy you want to give us a little bit of a a round out what does this mean yeah so this was actually a conversation we had either this Tuesday or last week and you’re like hey you should write an article about that I said hey I did and the the idea is this everyone knows the chat gpts and open those generative AI skills on chat based and text based queries and back and forth
3:04 text based queries and back and forth but they’ve really improved on the visual ability to evaluate and understand a visual not just the diagram or whatever visual that you have say what is this spit back what it is but also the text in it and really what you’re trying to do so we applied this to generative AI needs context and usually if you’re trying to ever get a Dax formula or Dax answer for chat TPT it’s always a little wanting because you’re dealing with your own evaluation
3:34 you’re dealing with your own evaluation context so what we actually just went through in the article was well let’s feed it the model and we’ve actually fed it just a view of the diagram well and we break it down I don’t want AI to do anything more than that and I basically say hey look at the diagram look at my model here are my measures don’t do anything else except evaluate it I don’t want to go further than this AI wants to do more but really the idea is let’s just do step at a time from there I actually gave it my visuals at data visualizations and I broke it
4:04 at data visualizations and I broke it down in boxes saying hey a user’s going to click on this column chart when that happens I want this to occur and I want this to occur in figure three I want a Dax measure that’s going to achieve this and breaking it down and really maybe I had two chat messages to chat gp2 and two images but it’s the images that really shine through and shows what chat GPT and a lot of these tools can do interesting let me throw out the link to the article as well just to make sure we have that post here as well for
4:35 we have that post here as well for everyone in the chat window so for chat if you want to go read about how Tommy used chat GPT and it was correct that was chat GPT to to render this one so if you want to learn how to use chat GPT in order to produce some Dax and have it produce a Dax measure for you that was giving you a topics counted inside this this model that you’re talking about you can go check out the article here it’s in the chat window what I here coming out of this conversation is now not only is Microsoft going to get feature requests from users actual users
5:08 feature requests from users actual users they’re not going to get feature requests from AI that’s going to be like can you change your diagram view to be a bit clearer about these arrows and relationships so I can understand which tables are linking to which columns in the different diagrams like it’s this is interesting and it’s so much more straightforward to actually send it the image and telling you it’s a semantic because that’s what I told chat GPT I told it’s a semantic model evaluate the relationships tell me what you get out of this and I it told me about the relationships it told me about the one
5:39 relationships it told me about the one to many told me about what you can do with this is to what I wanted is image processing heavier to do in chat GPT than it is text processing yeah it’s Pro it’s more tokens but it’s still really fast especially if you have like in general it would be in general process General now now with with this is intriguing like I I love what you put together here cuz cuz it it it opens the door I think to to a
6:09 it it it opens the door I think to to a lot lot of ways in which you could run into challenges on a report page right and and what you outline here is like hey yeah just throw in the model give it context MH and then the visual with some explanation of what you’re trying to do that that’s cool that it actually worked man that’s yeah that’s a cool use case I like the use case I’m just a little torn on how to get to the answer that It produced it it feels I’m not sure
6:40 produced it it feels I’m not sure Microsoft I’m trying to think of like big pictures a little bit I’m stepping back up a little bit right throwing images at an AI to interpret what relationships are on a Model It Feels Like the Model just needs to give us better information about what the relationships are and I can send it an actual like here’s a tech here’s a here’s a text tried that yeah corresponds all your relationships like why does the why did the image work so much better than in this way you wanted you you wanted different behaviors in the
7:10 wanted different behaviors in the visuals didn’t you yeah exactly I wanted I didn’t just want someone just to click on something to filter but I wanted how the behavior of the visual to say things that were related but I see what you’re saying Mike why can’t I just feed it and sense a computer read of the relationships from like a Bim file yeah here’s my Bim file I don’t know know like it but I this is where I’m struggling a little bit is like I don’t know what AI needs to make the answers that I want and I feel like sometimes we throw it so too much and maybe that’s the right approach exactly so if I if I
7:41 the right approach exactly so if I if I feed it a Bim file or if I feeded extra information is it confused it doesn’t get confused it’s just gonna try to evaluate all of it hard your file is gonna be big it’s not gonna be like the relation the relationships you need right and yeah and it’s important with all these tools that you like one of the things I mentioned in the article is I’m segmenting and I’m explicitly telling AI or the generative AI look at the model evaluate it but don’t do anything else don’t try to do
8:11 don’t do anything else don’t try to do anything else let’s stop here let’s make sure and I have more tables in that in that model but I don’t need to feed it yes because they’re not related to what you’re trying to build relationship wise exactly exactly I would I would guess I would guess that interesting you could articulate the same thing in text it it’s just challenging provide right provide context and visual to do these things and and to this point though yeah it does open it does open the the thoughts to like what other
8:44 open the the thoughts to like what other what other things could you autogenerate right like from the standpoint that I want I want to create like here’s my model here’s what these P Pages need to do right can you answer this question here like and lay L out an auto set of yeah here’s the measures you need here’s the visualization that you want to create or or automatically do that I think there’s definitely opportunity here if it can understand the set of what you’re you’re already showing it and the
9:15 you’re you’re already showing it and the interactions that you want it to have it would it would seem like you could build that experience or build the framework for the a AI to work within that and it it the the image eval a understanding is scary good it’s scary so by way cool stuff Tommy good good article I like it all right moving on Tommy with that just a secondary article that we probably won’t dive in as deeply on U but Tommy’s also putting out some other prompting things around
9:46 other prompting things around prompting bi things as well so just getting started right here’s a getting started page if you are interested in using chat GPT or other I guess would be AIS right right how do you start prompting it what information do you give it and I’m learning it’s not just a oneandone you don’t just give it a single prompt and say you get your answer you want it’s not like a Googled search like I think I used to be experiencing it’s more of a you’ve got to frame up the context and I think to your point Tommy you’re learning like you have to tell it what you want or the expectation output
10:18 you want or the expectation output potentially so you might be putting a couple more words into it but it can do more with the information you’re giving it so yeah and just just a quick touch
10:25 it so yeah and just just a quick touch on that the other article Really T goes into that on what the AI need the context is key and then we actually have a full system message that you could do for if you were doing a transcript cool pretty cool excellent I see other people on the chat here are using co-pilot to script out macros in tabular editor that looks like another opportunity for things there as well so that’s pretty cool anyways oh that’s an excellent idea that’s a great idea so another good solution there you’re not greatest C there I’m not no I can’t know
10:57 greatest C there I’m not no I can’t know everything let’s quickly jump into a couple news articles that came out from Microsoft there’s a couple new Azure data fact or sorry new data Factory connectors released in Q3 20124 we have a couple new connectors for Salesforce Azure SQL aure MySQL right MySQL DB we’ve got a couple other ones any other items here on this article Tommy that you found that were interesting I think the Salesforce one’s going to be pretty big because I I have ton of clients who are using Salesforce that’s a big that’s a
11:27 using Salesforce that’s a big that’s a big catch-up one agree significant one it’s like it’s very pleasing to see that one come out now because that’s a big that’s a big move that’s a big item yeah I agree with that one a lot yeah I I would imagine I would imagine the vast majority of folks using Azure data Factory have some connectors to the existing Salesforce so that that’s that I think is one of the big ones that I’m very very happy to see has moved into or the capability is now in the fabric
11:57 or the capability is now in the fabric it’s going to be it’s going to be used more in lake houses and I think semantic models because everyone I know uses Salesforce it’s not in the best format or there’s a lot of Transformations that need to be done so the fact that you can welcome to every operational system ever it’s made for that system it’s not made for reporting and it’s you got to shape a lot of data to get it to the way you want it to go yeah I totally agree with that I think one of the challenges the larger challenges with systems that we’ve run into with Salesforce is
12:27 we’ve run into with Salesforce is when it’s it’s more business team Leed and without without architect or data architecture understanding and it it fast spirals into oh there’s an object with 300 columns in it how many are still used right like it very it could really quickly and and those systems can and they’re they’re a real challenge or have been in the past to connect and make sense of a lot of the information but the connector if it
12:58 information but the connector if it works the same we’ve actually found that recently that you that you can like pre here hot take previously we were connecting to objects right and within the object you’re you can write a soel query that will connect to Salesforce pull the data back but there what I didn’t know is there’s like schema definition that allows you to drive down into the
13:28 allows you to drive down into the relationships of other tables whereas previously we’d pull in all the objects from like account or right yeah and you rebind just learned recently is like oh if you’re connected to the account table and there’s a relationship that dives into all of these other links and relationships it’s almost like schema driven like account but parent that whatever and then actually pull through instead of having to pull in the object and we I just learned that I was like get out very interesting this for
13:59 like get out very interesting this for forever it’s like I can go grab that related column from a different table through the same account object which is is was very a very timely win for for us awesome well good find I don’t work a ton with Salesforce data I have some customers that use it but we don’t pull in a ton of data for it so I don’t how probably have the same level of experience that you guys do on Salesforce specifically I know how to
14:29 Salesforce specifically I know how to connect to it and get some things out of it but we haven’t done a major project around loading all the datas so when I get one I’ll hit you up and ask for some questions around that we had hacks on data flows on data flows on data flows we were basically trying to yeah because it was all business oh yeah oh all gen one so use all that compute all that compute use all the compute the reporting will be down you cannot render any reports we’re loading things from Salesforce please wait until like a. m.
15:00 wait until like a. m. what what else does data Factory have in they have a new Fe new Lakehouse connector right we do yeah data Factory also came out with a fabric data Factory the schema support for reading and writing data from data Factory is Now supported in the pipelines so this is really interesting Microsoft came out with schemas inside the lake houses for fabric recently I believe it’s in preview I think is what it is right now and what that means is it’s almost like this is not the right way to say yet but I’m going to say it anyways it’s almost
15:30 I’m going to say it anyways it’s almost like a folder structure for a lake house so if you have different domains or areas data by customer data by topic data by bronze silver and gold you can give a schema to The Lakehouse and then under that schema you’ll have tables and so it just adds additional syntax into your queries or your python notebooks where you add not only just the name of the lake house and the table name you now add the name of the schema and the table
16:01 add the name of the schema and the table name so it it’s like another layer deeper inside the schema pieces which has been great that’s actually been around for a while Microsoft is finally catching up to this one so very pleased about the feature and now data Factory can write into the Lakehouse with the schemas that you need which is incredibly helpful so definitely very pleased about this new feature you’ll notice some idiot already asked questions about this but whoa whoa whoa it’s Mike to Carlo that’s it’s it was me I’m already asking questions
16:32 was me I’m already asking questions about it I was so I really like schemas in lake house I it’s a very useful feature very well And Timely so very happy with that feature my gripe here is I can’t yet connect a SQL analytics endpoint to The Lakehouse with a schema in it and I can’t yet get a semantic model to work on top of that lake housee with the schemas it doesn’t read the tables yet which I understand why like you got to build this feature first in the lake house and then every
17:03 first in the lake house and then every other tool has to start talking to it correctly but man I’m really my hands are tied right now I really want to start using the feature across my semantic models that’s really what I do I use a pipeline I make data in the lake housee and I take lakeh house data I shape it and I pull it right into a semantic model that’s what I do every time that’s the pattern so get the semantic model reading the the schema that’s I need that so anyways that’s my only gripe it’s nothing to do with data Factory at all very pleased that that works but I GED about something else I think I’m curious if Microsoft were to
17:33 think I’m curious if Microsoft were to look at their data and look at what the end out with the final output of a lake the most lake houses that are created are do you think that 90% are are for semantic models or do you think there I imagine they’re looking at lak mean I imagine they’re looking at lak housee as a ton of other use cases it’s not just a semantic model I think you and I and the people who’ have been powered by that’s very much the end goal but I’m curious what that distribution is because they’re looking at lak houses as this is a medium point for a ton of
18:04 as this is a medium point for a ton of other applications not just semantic models that’s one of the elements here it’s a good question Tommy what is the main consumption from The Lakehouse like what is the main tool that you’re going from out of the lake house right I feel like my argument is a semantic model because everything I want to give to Consumers is from the semantic model like I’m not building pader ports directly querying the Lakehouse I’m using some form of re lake so connector so easy to tables what was that it’s so
18:34 so easy to tables what was that it’s so easy to do now that I can connect to a Delta table with a paginated report yes you can but that’s but that requires you to use pagein report Builder on your desktop right with the new service I think I don’t know about in the service I’ve done it in the desktop yes yeah okay so in desktop I would I would agree with you if you’re using the desktop page report builder app yes you can do that one I was just more thinking like I’m I’m in the the service trying to say okay what could I build in the service I really like this service like that one
19:05 really like this service like that one is only service experience I’m only yeah I’m thinking service things I’m doing more and more Dev on the service side of things but I haven’t done performance testing on lakeh house in lak house direct connections to the page a report which I go to I got to test that that’s a one I should test out a little bit more but I my my mental model is I’ve done this work to make a star schema why would I go back to the Lakehouse if I could have the related dimensions and facts and then I could have my visual reports and my page
19:35 have my visual reports and my page reports all pointing to the the same stuff like to me that makes the most sense because the semantic model is the definition of how my company runs this is this is the the business logic lives there so I I feel like that’s my main consumption point I do a lot of work right now with companies building data engineering pipelines and so we do a ton of work looking at what’s in those different bronze silver tables we’re consuming data from apis or consuming data from third party tools and I’m doing a lot of engineering work in the Lakehouse that that’s what I feel
20:05 in the Lakehouse that that’s what I feel like I do a lot there and it’s a ton with notebooks so it feels like notebooks is the way to go for working with data Transformations inside the Lakehouse I just showed someone data Wrangler inside a notebook and people’s minds were blowing up I was like yep it’s here and it just writes Auto python for you the same way that Power data flows does writes M for you it’s the same concept I like this is this is brilliant it’s really good anyways good stuff it’s funny
20:35 good anyways good stuff it’s funny earlier when you you started this Tommy and said if if Microsoft would look at their data I thought you were going to go in a completely different direction because because we were talking about the Articles and Mike De Carlo and all of them would they would they see Mike
20:51 of them would they would they see Mike Carlo poking us all the time in our Artic they looked their this guy of data flows gen two how many times these are just these are just helpful suggestions conr and they are exct they are they are I feel like we’re we’re on the edge of a this is yeah I’m so I’m seeing the vision of where they’re going I see where they’re going to land this stuff and I absolutely love it like the things that they’re building are stuff that I really want to use and they’re making really solid improvements on very
21:22 making really solid improvements on very specific parts of the tool all over the place but there’s so many different teams working on all the different parts it feels like we’re not to get everything released at the same time I would feel like okay if we’re going to release schemas in lakehouses let’s make sure our semantic models can consume that like right away that would be like a a coordinated feature release but I get that you can’t do that across you get that you can’t do that across I don’t know how many teams there know I don’t know how many teams there are like 10 15 20 80 teams I don’t know all the teams to make sure that everyone’s releasing the same thing at the same time they’ve all got different priorities someone’s fixing bugs and semantic models and we not ready to
21:53 semantic models and we not ready to release the scheme of stuff yet we’ve got to do more testing on that like I get it yeah it’s just I want to six months this is going to be incredible yeah right now yeah the problem right now is in their technology that they’re producing we would have to change our processes that we’ve already had in place in order to work with what they have rather than we can just include this correct so anyways that’s that’s just my initial thought there on that one I think we are about at time and we should probably stop doing news articles so a lot of good
22:24 doing news articles so a lot of good things coming out we’re very pleased Microsoft fabric conference is coming up here pretty soon so there is a fabric conference in Europe which I believe will be happening here in the next couple weeks the end of September so stay tuned there’s probably going to be a bunch more announcements coming out at the big event there’s going to be new announcements and things that are coming out there so listen and then I believe behind that is ignite ignite is coming out in November I believe and so in November you’ll have probably more announcements about things coming out future so stay tuned keep
22:55 coming out future so stay tuned keep up with all the the additional events that are coming out and we’ll give you reports as we learn about things as well with that let’s let’s go ahead and jump right into our main topic today then mailbag mailbag that’s where we’re at mailbag mailbag mailbag all right today’s mailbag powerbi self-service personalization I think this is a
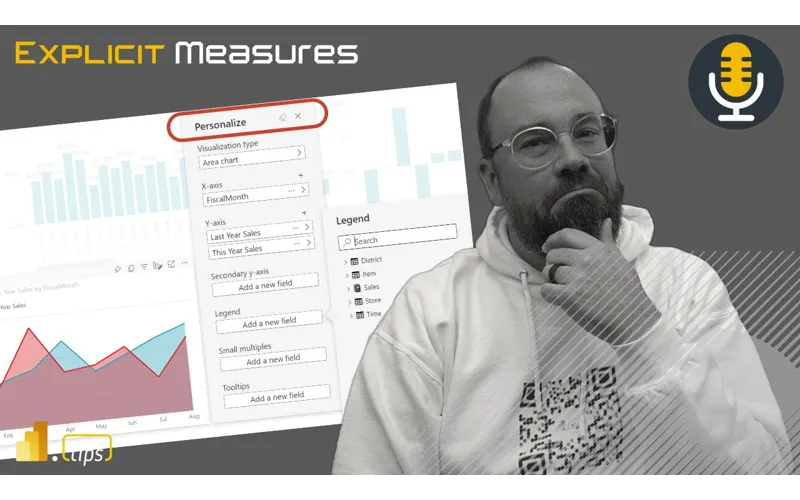
23:26 personalization I think this is a GameChanger but I rarely hear it talk about on podcasts or anywhere else what are your thoughts on rolling out personalization for self-service to the business to help them consume data without having to be a report developer is personalization difficult to implement from an IT perspective I have seen it succeed and would like to implement it at my new company thanks thank you well this podcast talks about about it we’re all up in that personalization
23:57 it we’re all up in that personalization why I did you yeah because I said no one else talks like not yet or not anymore your only episode talking about personalization and power. com new advertisement all right so let’s maybe pick apart some of the questions here I guess there are two parts that are coming coming through here is what are your thoughts on rolling out personalization for self-service and then is is it
24:29 self-service and then is is it difficult is personalization difficult to implement from an IT perspective I think those are the two main questions and we can like maybe react from there first reaction yes and second answer the question no okay good move on yes implement it no it’s not hard to implement so I think I think it’s definitely a training exercise on users in the service to make sure they understand how to additionally adjust the visuals I don’t think the little icons on top of the visual are very self-discover and
25:01 the visual are very self-discover and it’s a little hard to understand what you’re doing there so I think it’s very intentional you have to be clear about what you can do to the visuals and how like you have to train people on this this is something they have to know how to do to change the visuals I’m going to take a pretty different route than your take on this because you’re right the it side of this in the implementation easy especially the personalized visuals and even the training it’s literally isn’t it just a isn’t it just a a setting in the report like allow people to personalize visuals and then it just you can just do
25:31 visuals and then it just you can just do it right so the setup of it is report each report can be turned on or off with personalization or not right and and you’re done after that so the problem is and this is my take on this is I don’t know if people want to I’ve have tried immensely at when I worked internally as a director of bi from being a consultant now on pushing this and we’ve never seen a ton of traction some of
26:01 never seen a ton of traction some of this we can get in the audit log some of this we get from feedback surveys some of this we just get from people people know it’s there but they don’t want to use it or they’re more adverse to using that even with training even with directly talking to from a micro point of view a subset of people not necessarily the whole organization and and I’ll take that a step further you you you mentioned the self personalization on a visual but I think there’s the other element of
26:31 but I think there’s the other element of quickly creating a report in the service off of a semantic model and giving that ability that’s a different question I think and I don’t think that the reader is actually asking that question so we’re just on personalized visuals yeah I per self let me just read it again what are your thoughts on personalizing for self-service so I’m I’m interpreting the question I could be wrong on this one yeah just to be very clear I’m interpreting this as this is the ability to click on a visual in a pre-existing report and then oh I don’t like all these columns I’m going
27:01 I don’t like all these columns I’m going to add a new column I’m going to add no I don’t want this measure I don’t want sum of this I want the sum of that and so you’re you’re basically going into the visual and you’re switching the properties or basically the data fields on the single visual you could even change it from oh this is a this is a bar chart I’d rather see it as a table so yeah let’s keep it in that realm then that’s that’s the concept I’m thinking of I think you’re right Tommy there is an extension of this idea is okay how much Freedom do we give our users to go
27:31 much Freedom do we give our users to go build their own self-service reports or their self-service pagein like do I share the app with pre-built content in it and then you can personalize the visuals or do I share you a model and let you build your own stuff like so yeah I want to focus I think on more on just the report side for now and maybe if we have time at the end we can talk about the other half of self-service would you also intake what if parameters in the field parameters as part of self-service here the ability so when I can choose measures and basically
28:01 I can choose measures and basically change the visual that way as well I I would put that in the same this in the same topic that out about a year and a half it’s more I I would say it’s more of an explicit implementation similar right is it I I think to Mike’s point though right maybe it’s a subset of if we’re talking about personalized visuals the feature that Microsoft has that you can enable yeah yeah like that would be another way
28:31 yeah like that would be another way personalization could be implemented for end users end users yeah so well I want to go back to your question Tommy so would I consider an if statement so or just parameters observationally let me just as an observation let me say where I think most people customize existing reports right I think I observe the most questions questions around I I want I think let me say this way re relating my my statement here many many people when looking a report
29:02 many many people when looking a report are I want I need access to data just give me the information we a lot of times put it in charts and visuals to say look we’re trying to pre-build or or give you an eye to what the data should look like a lot of reports typically that I’ve observed have when you’re starting out beginning in visualizations or reporting with parbi you start with these really large wide tables with lots of columns people love Matrix a pivot table that does a lot of things for them but it’s a lot it’s very difficult to sift
29:33 it’s very difficult to sift through all that information and find the impactful information that you want to go do something with right so what I find is we have to bring a story along with our data a little bit and say look here’s some visuals that are showing key insights and then helping helping you drill into a specific area Okay this category this region this product is not selling as well as we want to the question really is not how I think it’s like I’m looking for the voids in my data where’s the
30:04 for the voids in my data where’s the area that is missing information or where’s the area that’s not doing what I expected how do I highlight that and get you down to a table of data that supports that information so if I’m thinking about that most requests are you have a bunch of visuals I need to see the table form of that data so from a personalization standpoint I think I see people wanting or the need is take that bar chart turn into a table and that’s how I want to see it I just want to see it as a table I don’t need to see the bar chart it’s not helpful enough to really provide
30:35 helpful enough to really provide insights what they’re looking for so I think the personalization works really well when you have a visual based report I want you to start thinking visually initially and then Translating that over to oh I don’t really want all these visuals I want two tables and a couple visuals right then the user can decide on which way they want it and I believe bookmarks will save that state of the way things are so you could switch the vi the personal visualization create a bookmark of that standpoint and that way
31:05 bookmark of that standpoint and that way when you reenact The Bookmark or when you go back to that report page I think the bookmark will keep that customization of that personalized Visual and so my mental model is
31:16 Visual and so my mental model is thinking in that regard is thinking I have visuals I’m trying to switch them to a table that’s where I think the real value comes from the reason I bring this up is to your point Tommy other things that don’t require you to be report Builders you’re adding additional features like a slicer that has multiple measures on it pick these different types of aggregations and that changes how the behavior on the rest of the page works totally understand it I don’t think I hear as many people asking for that t that information it
31:48 for that t that information it feels to me like when we have different data data calculations it for me it’s very jarring to have one visual doing some of sales but all the other visuals doing something different it I I don’t make the context transition very well between the different visuals when I start switching the measures of things unless it’s one entire page where everything switches at once so I feel like I’m building more pages for that stuff saying okay we’re going to focus on visits on web pages this is the visits page and then okay let’s drill into the purchasing page how many
32:18 drill into the purchasing page how many of those visits turned into purchases like things like that I’m trying to craft a bigger story and I’m centering an entire page around a topical piece of information I don’t know just I’m just going to put that there I think that’s perfect like I said the only time reason I mentioned is because field parameters I could also change the fields not just the measures now too which is like that personalized visuals I can say show by date or show by campaign but yeah so I think that this that’s a good scope I think what we have for just
32:49 scope I think what we have for just focusing on this personalized sit which again again I I I don’t know if it’s an adoption problem specific specific to the report page though M what what value do you think this provides end users let’s let’s just assume everybody knows how to use it right that they can like change and modify and and set their bookmarks is is this experience more
33:19 bookmarks is is this experience more valuable than Mike what you were outlining which is where report developers C customizing or catering and building support Pages for specific purposes to answer questions specifically does does this open a broader spectrum of how folks can analyze data on a page I think I think it does yeah goe go ahead Tommy I’m sorry I didn’t mean interrupt so I think there’s the Assumption and the reality the assumption is of course this does
33:49 assumption is of course this does because someone can go in and interactively change like hey I’m looking at our clicks by by month but what if I want look at our our actual number of conversions and I can quickly do that I can do that on the Fly that’s the Assumption that’s not an assumption that’s reality that’s what you can do that that is what you can do but the Assumption what saying is people want to do that or people are going to be intuitively comfortable with doing that yeah yeah and I think that that is part of this conversation but specific
34:19 part of this conversation but specific about the value the feature allows people to do that right interesting 100% 100% but 100% but go go ahead engagement go ahead say I want to add to your point time because I think you made a good point there but I think I think if I take a think a thought up of let’s I’m going to take a step ahead above what we’re talking about right so we’re talking about changing the single visual I think the the concept here is users are trying to extend the list of
34:49 users are trying to extend the list of questions they’re asking against the report page that’s what this is trying to do I feel like I’m looking at this Visual and I see sales over time okay you understand that chart now what do I want to do next there’s another step there’s another Insight there’s another okay I understand sales over time but which category had the highest sales look we have a spike here we have a dip here which category is now producing that dip of what would I expect in the chart and what I’m trying to think of is okay how do I get to that answer so I take that existing visual
35:21 answer so I take that existing visual click on personalization and I add some categories to it around product or category so now I can start diving deeper or asking a separate question so this is where I think we have a challenge as report developers we start building a report with a set list of questions we’re going to build these insights into this report or this page or whatever we’re trying to handle as many of the common questions as possible I think personalization allows the user of the report to expand their question
35:52 of the report to expand their question library to a more a larger amount and ask additional questions that maybe the report author didn’t initially think of and I think that’s what that’s trying to do it’s it’s letting you extend the question Spectrum to ask more data ask more questions against what the data is doing there right I think this gets very tricky because as soon as you start allowing that yes you can allow it not saying you don’t do it but how do I know as a report developer what all the questions will be asked how do I know which visuals are the best visuals to be put in place here do we need an
36:23 to be put in place here do we need an additional Page information I don’t know this this this suggest that you don’t need to because the business user would be able to select the different visual or the different thing I guess that leads into my second question if the value is there in the in the feature what is the challenges that we’re facing or why don’t we see tons of it or why like as the mailbag question is why is nobody talking about it I I I’ll take it from someone who actually
36:54 I’ll take it from someone who actually really tried internally to push this when I was inside yeah and I think it’s there’s two elements here or there’s really two factors one we did one of our early episodes we did I Mike remember like the mental models or the mental misconceptions we did and one of them was like the if you have 15 if you have two cans of jam to choose from or 15 cans of jams to choose from it’s harder when you have unlimited options to make a decision so with a personalized visual not only can you choose all of the field
37:26 not only can you choose all of the field of semantic model and all all of the visuals you have unlimited options for a user which makes it much harder to say where they want to go and I think the other element here which has really is a barrier to adoption is it’s not for everyone I think there’s part needing that analytical mind and also very or to be much more familiar than we assume with the model itself if I’m a user and I’ll say a basic user the average user
37:56 I’ll say a basic user the average user I’m not saying I’m a bi ER I’m not saying I’ve never touched powerbi I’m right in the middle I’m going to click on this button and I’m going to see 18 visuals and I’m going to see hopefully I’ve cleaned my semantic model so it doesn’t show all the fields and all these options available to me I don’t know necessarily what a dims and facts are I don’t necessarily know to look for a calculator icon even if I’ve done the training if I have 20 we where do you start unless that
38:27 20 we where do you start unless that mind and if I have that mind I’m probably in bi so it’s not but it’s not even the mind right and I think there are two two main reasons why there are challenges with rolling this out and and then there’s one prior and I’ll get to that after this but like the first is P I think personalization works very well with wellth thought out robust models that are implemented I was going to go there yep I love that but it but it puts the OWN
38:58 it puts the OWN of crafting the data story on the end user right because we’re not we’re not building pages to answer questions or or lay out the visuals in such a way that the cross filtering works I can search and I can do these different things but it it is designed to answer this set of questions because you’re opening the doors to it could answer many types of questions and and be free flowing in analysis so like I I feel the na bag user is probably one of these folks
39:29 bag user is probably one of these folks that analyzes a ton of data and loves the fact that they have this experience that they can draw upon the other but that leads into the second point that in order for this to work it it definitely speaks to a very robust data culture where people know Tommy like you were saying right what a measure is the fields that they can select the ways in which they want to visualize the information because all they have that as part of their lexicon
40:01 they have that as part of their lexicon of like oh I love this analysis oh I’d love to see this in a bar chart oh man like I I want to see this and what is the trend on the like that is a data mind right that’s someone who understands data and may not be building the report page but certainly understands how they would and this is just that interface or that unique experience where maybe analysts Thrive and that’s what they they’re pushing and saying personalization would be great for analysts analysis right but that
40:33 for analysts analysis right but that goes to the first point which is okay this is a very wellth thought out well constructed model that supports large areas of the business that it makes sense to and I think those are two of the biggest things of why there are challenges with like just throwing this out into the ether because if we’re already talking about like where’s the button or how do I do that functionality wise I I do that functionality wise you you got a ways to go yeah I I mean you you got a ways to go yeah I I definitely agree your both two of your points SE were both of my points I had written down here earlier if the model
41:04 written down here earlier if the model is over complex people are not going to know how to get pieces out of it now you can build perspectives perspectives can help you limit the amount of fields you would want in the visual and I do think if you’re going to build personalization from an IT weight standpoint you for sure should do that the more you can remove additional columns or measures or things that don’t make sense on that visual simplify simplify simplify simplify CU then people will be able to have less learning curve to get into the model I I’m fully aware that every model
41:35 model I I’m fully aware that every model can’t be just a simple star schema and we start doing snowflaking and we do
41:39 we start doing snowflaking and we do special cases and the data is not designed right and so we get these models that are much more challenging to work with because the way we want to construct the data for that single visual to work we may have four or five additional visual based measures that are doing just visual things any kind anytime of like Dynamic formatting you want to have color stuff changing you want to have titles and reports changing those are all measures those are all things that are part of the model that why would I change why would I bring a title measure that’s changing the title of a visual
42:10 of a visual to the visual itself it doesn’t make sense so there there’s literally things in the model that do not make sense to put on that customized visual so I think it’s really important that you pair that down where I think personalization may take a turn here for me is where Carly was talking about a feature for I can’t remember the name of it metric Hub what was it called I can’t remember the name of it so Carly has explained here’s a perspective here’s the things I’m going to pluck out of my model and I’m going to let you have this experience where I
42:42 to let you have this experience where I can go here’s main kpis I’ll give you a subset of that and you can build this perspective on top of the model and then create simple visuals I also think inside power. com the service the Explorer Explorer visual which is not really a visual but it is and it’s like a it’s like a report with a single Visual and a table on it I don’t it’s interesting how it it plays out but I really like the Explorer visual or the Explorer report type I guess that’s what it’s called because
43:12 guess that’s what it’s called because you can literally build the table that you want it’s a matrix and you get a single visual that represents the data I think access to data and just poking around in the data to understand what’s going on there I think that’s a really good use case and honestly I think that should be used more often there should be an Explorer feature the UI is great you can add filters you can do all these extra things but you’re you’re literally making a table and looking at the information coming from a data model I really like those two other options and if we’re talking personalization I think those are going to be more valuable in the future when we start talking here’s
43:43 the future when we start talking here’s a model that I’ve built you go have it go have fun go build stuff on top of it Mike that that just that deserve two explanation points in my notes what you just said so I think the first point I I want to touch on where you talked about the model and I want to take that quickly just quickly a step further it’s not even just the model itself having a core really structured model it’s also having a userfriendly model and I think perspectives are a big point there again who thinks in dims and facts and measure
44:13 who thinks in dims and facts and measure tables and measures you’re not going to get people there so I would everyone not everyone unfortunately as much love much i’ love you to think in that it’s it’s a learning curve right with enough EXP people will get there it’s just does your culture handle that what and I think what you would push more to actually if you want ad option you’re much more likely to get that if you’re only dealing with core models for example if I’m working with a marketing team we’re using the same data over and over and they’re probably familiar with
44:43 over and they’re probably familiar with measures or clicks and open rate and so they know that that they can work with that I’m not going to introduce personalized visuals with a completely new model and new data sets like oh now we’re going to do this with our advertising until they’re familiar with that and we’ve built a ton there already and that’s something that’s withstands time in terms of something that we interact with together with bi and the team your point on Explorer I I got incredibly excited because I think V1 is
45:13 incredibly excited because I think V1 is personalized visuals and I think V2 on where we’re headed is that Explorer feature because it’s a tire window the user interface and let’s let’s talk user interface man because there let’s not understate the importance of for a user a average user the importance of a user interface I have this entire window I don’t think perspectives works with the Explorers it’s the entire model or the model that’s shown but that’s a way I I’m at the point now where I’m
45:45 way I I’m at the point now where I’m pushing people to explore than I am to personalize visuals that’s where I want people to go I don’t want them to go on the report because again for for whatever reasons that’s a harder that’s a much harder a higher barrier to cross for people from a cognitive load which is one of our things just to get people understand the visuals totally agree Explorer feature I don’t have the entire report out there we’re looking at the model and it’s much easier just to add a few columns so if I’m if you were to ask me today where are you pushing
46:17 to ask me today where are you pushing people to from a self a basic self-service I’m pushing people to Explorer I’m not pushing people to personalize visuals that’s a good point I think I yeah this is these are interesting points here I there’s I think there’s a lot of things that are coming down the pipeline of like that’s going to make this easier to consume and easier to use these more Rich features of of the service and particularly powerbi yeah I agree with you Tommy I think there’s other things that are out there that will also help with the learning the education the the exploring
46:48 learning the education the the exploring the data pieces and I want to say I hate the fact that people don’t use personalized visuals because I love it I use it on my own reports and I’m not going to walk my answer back but I will say one thing that is a bit challenging today if I’m going to make a perspective that it requires a thirdparty tool so when you’re doing personalized visuals when you’re allowing people to turn that on you can specify the perspective but the perspective can’t be made from Power Bay desktop so I don’t know when we’re going to get something like that but in order
47:19 to get something like that but in order for this feature to be truly built into powerbi I think you’re going to need the ability for desktop or the power. com service I don’t really care which one somewhere you’re going to need to say this is my perspective I’m going to be able to easily create the perspective with the tooling we have today I’m not going to expect so again we’re talking about it burden here right two two major points of it burden one are you going to turn it on design a model that’s efficient so you have to have those things those are have to have
47:50 things those are have to have that done then the next thing is we recommend you should use perspectives because it helps narrow down the list of fields you can use in the visual and things that don’t make sense shouldn’t show up but again now you’re in a third party tool more it burden so you have to really think about the customer experience of that Visual and that model at a much higher level and again it just takes more of an expert to build the model not saying it’s wrong not saying it couldn’t be done just be aware it’s not currently built into the tool today yeah I think I think this this
48:21 today yeah I think I think this this leads me to my other point like why don’t we see tons of it because I could I could definit think of cases where I you could craft a a report couple a page or a couple pages and you could say okay in in a traditional build we’re going to answer these questions right but that’s one slice if I change and personalize the the visuals now I would answer these questions and
48:51 answer these questions and maybe it’s even just saving the bookmarks or whatever the case may be but like it’s multi-layered in the approach and implementation to allow the business to do lots of things with one with one report the the challenge in there is if we’re already having challenges with a single report page and end users understanding basic functionality now now you’re switching contexts of answering questions in
49:22 contexts of answering questions in something that’s not visual anymore right like they have to innately understand all of the capabilities and be very comfortable using the tool set that I’ve provided them in that report page and far in way my experience has been the vast majority of business users are not in that realm now could I say there are groups of analysts that would love a page like that and maybe it’d be extremely useful especially if they’re
49:53 extremely useful especially if they’re power users in powerbi then I would say yeah that I would say okay there’s a use case here where I could literally open a page and create some areas where that would work well together from a high level but even I think there are challenges from a technology implementation to say okay what is going to what would be the best set of visuals that are going to work together regardless of how I look at or analyze this data and that that that would be a challenge but I think the the largest
50:24 challenge but I think the the largest part is just the end user ucation of data the other things that are precursors to I think challenges of rolling it out in my experience the vast majority of time in model building and from from centralized bi teams that are going to deploy an experience like this is the vast majority of time is filling gaps and insights in the business like we’re developing new models data engineering
50:55 developing new models data engineering we’re there’s tons of time in just getting stuff to a place where people can see it and make decisions and that’s what we’re designing and building for there’s not a ton of time at least in my experience for refining Solutions or extending for this like deeper analysis and that’s probably just my industries that I’ve been engaged in but it’s it’s or potentially like just the chaos that I I love finding where you’re constantly building right so
51:27 you’re constantly building right so we’re not in a phase of we have this you we’re not in a phase of we have this Fantastic Model the vast majority know Fantastic Model the vast majority of the business uses this let’s look at different ways we can explore and extend into the business and say oh man we found this group of analysts let’s now build this page that allows them way more insights than anybody else in the in the business would understand how to use then I think they’re absolutely use cases for cases for that so let’s propose a situation or scenario for you I’m going to give you
51:57 scenario for you I’m going to give you guys Mike you got a client Seth you got your boss coming to you say hey our Q4 goal is to get 20% of our view 20% of
52:07 goal is to get 20% of our view 20% of report usage to use personalized visuals are you accepting that and then two what what would be your improv your your short-term plan to do that is that something you’re gonna go yeah I think I can achieve that my would never asked me to do that fine that’s why it’s called a scenario hypothetical okay so for I don’t think anyone’s asking for specific feature adoption inside your power Bay reports of course not of understand just
52:37 reports of course not of understand just just to throw that out there this is a very hypothetical I’m sorry we’re we’re in we’re in the alternate universe where features usage feature usage internally matters a lot towards my pay scale yeah yeah we’re in one of the M okay I how do I get there that’s what is the question well here let me answer your question directly so I understand why you’re trying to ask this question because you’re trying to tie this something to like does this make sense for us to spend effort on this what’s the value of the effort of
53:07 this what’s the value of the effort of this right I think what I would rather see is see is I I I want to really measure the satisfaction of the users using the reports right I think the main goal of our organization should be if I give you a report are you able to get the things you need out of it either it’s an export of data or you’re getting the insights that you want or you’re building the things that you need to on top of a semantic model right I think you have to listen very carefully to what the users are asking for when they come to you
53:38 are asking for when they come to you with questions about data and you have to be very Discerning around okay are you asking for a pre-built report that I can just go in and look at again that might be just the culture of the of the company you build it we’ll tell you the requirements you just build what we need and then we’ll consume it and they we’re not going to extend that experience any further than that that so if that’s the culture that I’m in where there’s more of a centralized team and we’re not expecting other people to create their own content I think I would try to tie
54:08 own content I think I would try to tie educational events around personalized visuals with does this satisfy your needs like is is this report so have a question box on the report have a survey that we can send out very frequently are you getting more value out of your reports by using personalized visuals and not then I would understand why is this not working for your your use cases and it’s prob it’s potentially the data I don’t need is in the report the visuals don’t make sense to me and that’s why I’m changing them I just want more tables like what is that
54:39 more tables like what is that satisfaction point that we’re trying to get people to push through to make sure that if I’m a central team what is how do I measure my value back to the people consuming the report and so if I I start I think I have to start the conversation there and then I just use personalized visuals as part of the conversation and if I’m putting reports out that have higher satisfaction when we’re turning on personalized visuals then I think I’m spending more time building perspectives personalizing visuals and doing more real demos right one of these things is
55:10 real demos right one of these things is it’s not a very discoverable feature it’s just not very much out there so if I’m doing training on this on a SharePoint site or whatever I’m going to very clearly explain this visual can be customized here’s how you do it watch these steps this is a function of that report with that being said said all that does is it just makes the report more complicated at the end of the day so I don’t know those are my thoughts on it I would try to push for satisfaction of consumption of reports that’s what I would push for
55:40 reports that’s what I would push for with this with this feature the precursor context to all this I’m trying to find a world where this would actually be and there’s actually a use case I think that is relevant to this one that we like could potentially be there which is is this a method by which individuals without a pro license could get access to like do more analysis on on stuff because they don’t want to pay for additional licenses where they would build reports
56:11 licenses where they would build reports and deploy them in an area odd odd case but I’m just trying to I’m trying to I’m trying to answer Tommy’s question the the other prerequisites to this would be all of my users are data Savvy all of my users No powerbi Ex extremely well and the request to the team is you’re holding the business back because we don’t have a model that everybody can explore and analyze in any way that they want essentially on this page go give that to them and make sure that it’s
56:42 that to them and make sure that it’s adopted right but you’re still running into the challenges of like the only reason there would be business value is there because the business itself is saying you guys are restricting us from getting access in this specific form format that we want called personalization your metric is 20% of all of our users better be using it by the end of Q4 like right okay we can do that right but that’s a very Niche use case and one I would be astounded to
57:13 use case and one I would be astounded to see what what I find really really ironic about both your answers or what you both mentioned Seth you mentioned that in order to get this even started the the previous comment that you made was we need refinement it’s not just building and moving on there’s going to be a refinement period of the model but then Mike you mentioned that it’s just going to make the report more complicated and so it’s interesting to have those two things and if we’re gonna ever refine a report or go back to it
57:43 ever refine a report or go back to it the last thing we should do is make it more complicated for refining refining a model means that everything within it makes sense and works together complicating the report page is what personalization will do to an end user those things absolutely live together but if but if I look at the complication of things right if I complicate the report consumption experience by allowing personalization consumer experience that is simpler than I I
58:13 experience that is simpler than I I would argue that is a simpler experience than giving someone a blank report page and say go build something on a model so like there’s levels of complication we’re talking about here so that might be the first a good first step compared to to here’s a blank page start everything from scratch but isn’t that the Explorer View because you’re building a single visual off the Explorer view it’s a single visual but it’s not an entire report page I think I think an entire report page has got a lot more things in it I think this is a
58:43 lot more things in it I think this is a good conversation but I do know we are at time now so I do want to wrap up and get final thoughts here so final thoughts of this one I really like I think your final thoughts here set that you’re pointing out here I’m going to jump on those right I think you need to be very careful on how you’re building out personalization I think education is Paramount you’re going to build a lot of examples of it if you’re going to use it use it everywhere right people got to get comfortable using this feature don’t just do one random visual one off and expect everyone to use the feature if you aren’t widely putting it across multier models I do think there’s
59:13 across multier models I do think there’s some burden on the it organization or whoever is building the model the model builder the model builder needs to understand how people are going to interact with that Visual and the columns that are in your report build perspectives so it’s all a matter of perspective anyways that that’s my my final thought Tommy Tommy any final thoughts for you I I think the biggest thing I’m my take away from our conversation is this is a really neat feature but it is a very also Niche feature this is not a global for
59:43 feature this is not a global for everyone that we want to adopt and I think the biggest takeaway is there’s a lot of other ways we can provide to users a way for them to personalize and also to customize I would not focus on this as kind to your points my end goal my my achievement of what I want my bi the bi team to do or what we consider success so I think take a look at the different ways know your models and know that how your users are interacting with it those are my big
60:13 it those are my big takeaways any final thoughts Stu yeah I think visual like personalization of visuals is it can be extremely useful should it be available to individuals or analysts that that know about it and want to leverage it yeah absolutely right is it hard for an IT team or a business intelligence team to develop a report page on a Model foot no it’s not hard at all like they can do it pretty pretty quickly but I think overall this feature is going to be driven more so from the business side and AG you’ll
60:44 so from the business side and AG you’ll probably find more success when it is driven that way as opposed to the opposite where we’re trying like could it be part of a data culture initiative and like re level up people absolutely it could but there are a lot of basic stepping stones that just have to be fundamentally understood before you throw throw something like this out to a wider audience I really like that observation and I agree 100% it will probably gain more attraction if the business is asking for this stuff and you show them it’s possible
61:14 stuff and you show them it’s possible they will that means they’re the culture is already ready for the feature I love it well thank you very much for listening to the podcast we really appreciate your time we know your ears are busy and they’re doing lots of things so so we thank you for spending an hour with us listening to our podcast our only request is please let someone else know or share this to somebody else that you think you might want to know about personalization of views if this was a good conversation talk about it with other people let them know you found this good information from the podcast Tommy where else can you find the podcast you can find us in apple and
61:45 the podcast you can find us in apple and Spotify or wherever you get your podcast make sure to subscribe and leave a rating it helps out a ton do you have a question an idea or a topic that you want us to talk about in a future episode head over to power. tisp podcast leave your name and a great question finally join us live every Tuesday and Thursday A. M Central Time and join the conversation on all of power bi. tips social media channels thank you very much we’ll see you next time
62:28 you [Music]
Thank You
Want to catch us live? Join every Tuesday and Thursday at 7:30 AM Central on YouTube and LinkedIn.
Got a question? Head to powerbi.tips/empodcast and submit your topic ideas.
Listen on Spotify, Apple Podcasts, or wherever you get your podcasts.