Tracking App Usage at Scale – Ep. 479
In this Thanksgiving week mailbag episode, Mike and Tommy tackle a real-world monitoring challenge: an education consultant in Ohio supports 70 school districts with 120+ Power BI dashboards and 9,000 users. They’ve moved to the Power BI app experience with audiences, but need scalable, automated usage tracking. Mike and Tommy break down the options.
Mailbag Question
An education consultant in Ohio supports 70 school districts with 120+ Power BI dashboards covering state test results, chronic absenteeism, and early warning systems. They’ve transitioned to the Power BI app experience, organizing dashboards by district using audiences for ~9,000 users. The question: what’s the most automated and scalable way to monitor app-level usage—specifically how often each district accesses their dashboards and how many users engage over time?
Main Discussion: Monitoring Power BI at Scale
The Built-In Usage Metrics
Power BI’s built-in usage metrics work at the report level but have limitations at scale:
- Manual tracking across 120+ dashboards isn’t sustainable
- App-level aggregation isn’t natively available
- The data retention and granularity don’t always meet enterprise needs
Admin APIs and Activity Events
Mike and Tommy point to the Admin REST APIs and activity event logs as the most scalable approach:
- Activity events capture who viewed what, when, and from where
- Can be automated via notebooks or pipelines to land in a lakehouse
- Gives you full control over retention, aggregation, and visualization
- The data can be sliced by app, workspace, report, user, district, and time period
Fabric Capacity Metrics
Fabric capacity metrics tell a different story—they’re about compute consumption, not user engagement:
- Useful for understanding cost and performance
- Not designed for tracking who’s using which dashboards
- Complementary to activity logs but doesn’t replace them
Admin Monitoring Workspace
The newer admin monitoring workspace feature provides pre-built reports but may not have the granularity needed for this use case—especially app-level breakdowns by audience.
Practical Recommendation
The consensus: build a lightweight pipeline that pulls activity events into a lakehouse, then build a semantic model on top. This gives you:
- Full history and custom retention
- Flexibility to aggregate by district, app, report, or user
- Automated refresh on a schedule
- A single dashboard to monitor all 70 districts
Looking Forward
Usage monitoring at scale is a common pain point. As Fabric matures, the hope is that app-level analytics become a first-class feature. Until then, the activity event API + lakehouse pattern is the most reliable approach for organizations managing hundreds of reports across thousands of users.
Episode Transcript
Full verbatim transcript — click any timestamp to jump to that moment:
0:00 Heat. Heat. N. Good morning and welcome back to the
0:31 Explicit Measures podcast with Tommy and Mike. Hello everyone and welcome back to the show. Good morning Mike. How you doing? I’m doing well. Just clipping along, keeping busy. The end of the year is is happening fast. we’re getting a apparently a a cold wind coming through our area. So it’s going to be cold here pretty soon. We’re getting into winter and daylight savings time has happened and all the things it just everything off. Yeah, that’s right. Daylight saving times. Do the reason why we even have daylight saving time? I I thought it was for people to get
1:05 Food to market quicker in the for farmers. It’s a fallacy. Really? Yes. Okay. So, I don’t I don’t I don’t know. That’s what I thought it was. So, first off, it was well two pe two different groups of people. invented it. One were the Nazis. So right there with all right, but the other one was actually because there was no power at night. So you had to burn a lot of oil and candle. Makes sense. That makes sense. That seems much more reasonable of an answer, right? However, now it’s this the opposite’s happening because we have our
1:40 Lights on even longer because we don’t have to worry about how long is my candle going to burn. So, so this is an interesting point that you bring up here, Tommy, around like the light and how much light pollution we have now. , this is actually goes back to like Jav’s paradox a little bit. We’re talking about the cheaper you make something, you think, oh, they’ll use less of it because, , we made it cheaper. No, actually, the opposite is true. The cheaper you make something, the more it becomes consumed. And because we’ve made electricity and light so easy to build and consume, now we have these things called light
2:13 Pollution. And so if you want more consumption of things, drive down the price of it, make it a commodity, and then you get more consumption. Exactly. So that’s the problem now. So Illinois was close to actually putting a rectifying a law putting to vote to get rid of daylight saving time because we don’t need it anymore. I would agree with that. I don’t I don’t think it makes any sense to have daylight savings time anymore. I would like to see that gone. Does the rest of the world again I know some countries shift but most do not right. Most yeah most do not. So
2:47 Yeah it seems odd. Yeah. Let’s let’s not make it more hard for people to figure out what time zone you’re in and how and how to get all that stuff working out. Anyways, okay. Enough about our introduction stuff of things. today this is a recorded episode for those of you who are listening online. let’s go into this with a a mindset of we’ve already recorded this one. We’re we’re not going to take any news today. So, that being said, let’s jump into our main topic today, which is a mailbag. Tommy, you want to read us off our mailbag around monitoring and keep in mind it’s Thanksgiving week,
3:19 Too. So, , we’re still here. So, thank you for joining us on Thanksgiving. Yeah. So, this is I I’m excited to hear your thoughts, Mike. So, here we go. I am an education consultant in Ohio supporting 70 school districts with over 120 PowerBI dashboards covering key initiatives like state test results chronic abantesium I cannot say that word chronic not being in school and early warning systems I’ve transitioned to using the PowerBI app experience to
3:52 Streamline access for around 9,000 users organizing dashboards by district using audiences Previously, I tracked report level usage manually using the builtin usage metrics. Now, I’m looking for the most automated and scalable way to monitor app level usage. Specifically, how often each district aces their dashboard and how many users are engaging over time. I’ve explored fabric capacity metrics and started enabling admin monitoring, but neither seems to provide granular
4:25 Usage data by app or by audience, which is critical for reporting back to districts quarterly. What’s the best way to track PowerBI app usage over time, ideally broken down by audience or group? App usage. So, this is a very specific question. It’s not report usage. This is down to the app level of details. , so I’m going to answer well there’s a number of different ways to get data out of PowerBI for usage and usage metrics. So there’s a lot of things in there
4:57 Already that you can go grab and go use. Let’s maybe narrow down for this particular question. Tommy, I’m going to answer like directly how to find the app usage and then we can talk about other solutions that make this a bit easier and automated maybe on top of that. So my first recommendation is you you have to get familiar with the scanner API. I believe the scanner API is is going to scan all the items or the artifacts gives you all the details that are inside your tenant. That’s that’s the first side of things. And then once you have the some of the details around
5:31 All the items, again this is a mess cuz things there’s a lot of different teams building a lot of different things. There’s a lot of items and events happening there as well. And so that should then give you a list of all the events that are occurring by what information that you need to see. So that that was where I would the technology piece that’s where that starts. you can also turn on workspace monitoring. Workspace monitoring is a feature on the on the workspace where you can turn on the monitoring of the workspace and it gives you additional query level statistics and other statistics on top of it too.
6:04 The combination I think of those two items are probably where you want to start like that Microsoft gives and exposes to you directly the user. That’s where you can start collecting information. Tommy, would you recommend anything else? Is there anything else you’d add there? Honestly, the it really is there’s no native out of the box really solution that does app monitoring it explicitly what the the the mailbags in questioning. However, you can still do it. It just takes a little more configuration.
6:35 So what by that is you cannot go into the the usage analytics either the audit log or the usage and say hey how many people viewed this app explicitly and then actually track that in a data set but you can track the contents of the data set. So there’s a a workaround solution because I need the scanner API to know my audience, correct? And I need to know what content’s in an app, which the scanner API does show. It does show what what app is, ,
7:09 Associated or what reporting content is associated with app. So then you just build your model in a certain way that it would show you the the people accessing the app, but you’re not going to necessarily get out of the box, hey app, , app a 10 views. You can get to that number, but you do need to build your semantic model. There’s details like it doesn’t give you directly the it gives it to you in you have to look at like who’s rendering the app. like there’s an event that happens when the app is opened and the and the event is rendered because
7:42 That’s an event item inside the log analytics or the details that are coming out. So those are the main the two areas that we talked about workspace monitoring which again you find that in the workspace settings you go over to the in the once you open the settings there’s a menu that shows up on the lefth hand side you go all the way down to the item called monitoring and you turn that on. What that does is it basically streams data instead. Instead of using log analytics, that’s what was traditionally used was log analytics of all the events happening on my particular workspace. Now what you can do is you can turn on
8:13 The workspace monitoring. It creates an event house. All the events that are being generated from the Microsoft side are now being sent to you. I will caution you on this one. Turning this on is quite chatty. there’s a lot of events and if you’re running a report, it’s also sending all the queries to the semantic model that are happening from the reports. So, you can get a [clears throat] lot of data very quickly. So, just be mindful if you’re going to turn on the monitoring at the workspace level. Be prepared if you have a very busy workspace. And again, I’m assuming we’ve got a number of people
8:45 Going here. We’re talking about what does they say 9,000 people that they’re trying to report for. If you’re at the 9,000 level, you could have a lot of people in reports hitting a lot of queries and a lot of data being generated very quickly. So you want to be very mindful of like the volume of information you’re going to get into this event house. Yeah, that’s just one thing to be aware of. the other thing I would point out here, so there’s a lot of different places where information exists and as an admin you need to know about where all these things are hidden somewhat, right? The other area that I would say is the fabric capacity
9:17 Monitoring app. There’s a there’s an application that’s in the apps area of PowerBI. And when you get the fabric capacity monitoring app, not only does it give you some event based things like what happens operation IDs, this operation occurred, it also will start providing you capacity metrics. So when you’re on a particular fu or capacity and again I don’t really know based on what this customer is describing, it sounds like you’re maybe on a pro or premium per user workspace. So in that situation, you’re less worried about monitoring the capacity and making sure
9:50 You understand how many users are hitting the reports. But if you are in a Microsoft fabric environment, you the admin are now managing or monitoring the the capacity. So you can throttle things. You can have too many people accessing a report. You can have a report that’s poorly written and that causes a lot of extra consumption on the capacity. So as you the user who has the advantage of the the advantage the upside of this is when you get to an F64 level you
10:23 Can have unlimited users showing up to that free users not unlimited you can have free users and PowerBI pro users consuming content from that workspace. So at the F64 level now we have a problem where okay we have a number of users that are not pro licensed users consuming reports and apps. What are they doing? How’s that how’s that hitting our capacity? So the reason you buy the dedicated capacities is you can have larger amounts of users on the same capacity which can bring your price down per user. So and again I’ll just
10:56 Point out the capacity app is awesome. You can take a derivative of it. You can make one, bring the app in, you can make your own report on top of the existing data set and the data set there actually lives on Microsoft’s side of things. So the Microsoft side has a their own custo database that this report connects to. You can’t edit the custo database, but you can consume from it. So if you want to store that data or run a pipeline to go get data from that report, you can. And that’s a lot of work. And that’s
11:28 That’s if you want to see a lot more than just usage though, too. That’s what you’re wanting to see all the ins and outs of what’s going on in the workspace. This is good oldfashioned just let me see who viewed what report and they want to be able to build their own insights because there’s not a lot of data points to get started here which I’ve always been amazed Mike when I’ve worked on building out PowerBI. I’ve always said, , hey, sooner rather than later, I know we’re not launching PowerBI, ,
12:01 Today, but sooner rather than later, make sure that you’re working with a develop a developer to get that audit log and get the access and get starting that track. And that’s one of the biggest things I say, and it’s never seems important, especially even before they actually launch, even if they’re doing a pilot. Y but you want that data. And the thing is, again, it’s really not a lot of data. You can do a lot with it but at the very least and I let’s make the distinction here too between the admin monitoring or the workspace monitoring and the audit log right because a lot of
12:36 People suffice with the admin monitoring or the workspace monitoring saying oh I see my usage. Yep. I personally hate that because it’s only a 60-day rolling 90-day ruling that I got to save it tell me a lot and that’s a good call out Tommy. Yeah. So even in the capacity metrics app I think it’s only 14 days it’s even smaller like in the capacity metrics app it’s very small window of time and and again like do let me let me just pick on your comment there a little bit Tommy like in in the grand scheme of things right are you really going back for
13:08 Fabric capacity metrics are you going back six months and looking at the data capacities probably not probably not but however to your point though Tommy right we do want some general trending of information in a longer period of time like maybe it’s maybe you aggregate something up to like the min maxes of by day maybe you but 14 days I feel is a little bit light on the capacity metrics app I think I’d like to see that one go up to like 30 60 maybe 90 and then when organizations care about that data dude
13:44 We’ve already got fabric we’ve already got lakeous every time I refresh this report why not just let it dump all those tables that it’s using in that model. Just dump the tables down to a lakehouse. , that’s what we have it for. So, let it do a once a day dump and we’ll keep all that information directly inside the lakehouse and we’ll do a one day export. So, that’s another opportunity there as well for some additional monitoring. Tommy, have you noticed one thing? Let’s I’m going to dive into a little bit in the fabric capacity app. Have you been keeping your capacity metrics app up to date
14:16 Recently? It is. It’s so I go back and forth to from using it, but I just noticed there’s an update last week. There is an update. Yes, they keep updating the app. So, one thing that I would like to point out here around the fabric capacity metrics app is when you go into the app, there’s now a new column called operation ID. You’ll find this somewhere in the details. And they’ve also added like a details page in here as well. So, there’s a detail around some more of the information here as well. And I really like this new
14:49 Reporting piece because it it really helps out with identifying when we have needs or or when we’re looking at particular operation IDs around testing out capacity pieces and figuring out what the heck is going on. [snorts] So that’s something I think is really interesting. I like to see this operation ID. It seems like more and more data or the data behind the scenes is changing. Microsoft’s adding more metrics to things which is making
15:20 It very helpful for us as a developer to figure out, okay, what is going on here? What information do we need to have in these tables that we can actually use and leverage inside the reports to help us get better information or insights around what is it doing? I like this. And but again, you’re really talking about the admin side of fabric and that includes everything and If I can bring it back because I I know how fun that part is, but I want to bring it back here to just the good old and this is to me not just for admins
15:52 But this is we’re talking pure for me PowerBI adoption just usage just pure I’m not even looking at any lakeouses or Yeah. Yeah. what I’m what I’m trying to point out though is like there’s a lot of things that are happening like across different systems and you’re trying to tie them together. You almost need you almost need like a data model of here’s the scanner API here’s all the items I have here is the capacity metrics here’s when those events are occurring and what events are happening here’s workspace
16:24 Monitoring here’s all the queries that are happening against my semantic models and other events so when you look at these three lenses of like what’s happening Microsoft is putting metrics down that they give you access to the information but it’s up to you to build what works for you and this This is one of the reasons why we’ve built a solution like an accelerator. if you go to the Azure marketplace you look up I think it’s business intelligence monitoring accelerator I think is what we have on the Azure marketplace. We’ve built a solution that makes like does a lot of
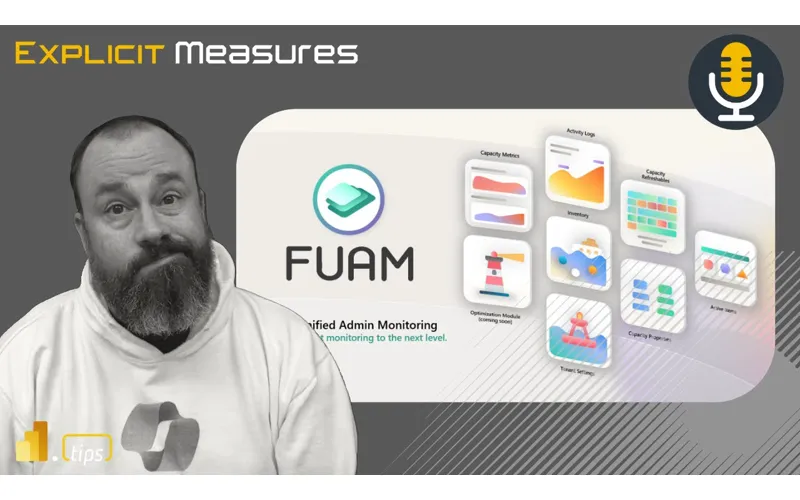
16:55 Automation of this. Like it’s it’s complex to get from these raw JSON files that the scanner API gives you into un unflattening them out, making them into tables, building proper dimensions of reports, workspaces, apps. There’s a whole bunch of stuff that you can have inside these monitoring things. So, we’ve built like a solution to accelerate you on that one. So that’s a an off-the-shelf, , , white glove approach to helping you get started with monitoring. Another off-the-shelf monitoring is the FUAM fabric unified admin monitoring
17:29 Solution. Have you played with this one at all, Tommy? I have. This one This one’s been fun. Is this the notebook or is this this is something different? This is the one that Microsoft produced on GitHub. Wasn’t in a notebook or No. Nope. It’s pipelines. It’s the whole enchilada. It’s a full off-the-shelf solution. It’s not like you haven’t played with it because you don’t know what it is. So, [laughter] so FUAM is this other solution that Microsoft has provided. It’s so let me say it this way. Microsoft has provided details around it’s like
18:02 Gateways, it’s workspace monitoring, it’s all these APIs you can even hook into. So the FUAM solution [snorts] hooks into the capacity metrics app and pulls the capacities for you. puts it down in lakeouses. So there’s a lot of things happening inside this solution and this is Microsoft developing what they feel is like a good starting point for monitoring or off-the-shelf monitoring. You can install the items into your workspace. You can get going from there. The downside of this is there’s no support. You can get the solution, you can get it into your workspace. Microsoft’s not going to
18:34 Support it. There’s changes happening every so often. Microsoft is distributing it, but there’s a big warning label at the bottom that says if you use this, you just got to figure it out yourself. there’s no support given to it. So, it’s I think it’s reasonable to say we’ve we’ve installed it. It’s not super difficult to install. There’s just a lot there. There’s just a ton of stuff that they have to like configure and get set up and and put in there. So, yes, it works, but I I sometimes feel like some companies need like a little bit of a hopefully especially with all the things with fabric and how quickly fabric’s
19:07 Changing. that’s not the thing you want to implement in your organization as your default solution at all. I don’t know the way how things are rapidly changing with fabric anyways of like things getting removed. I wouldn’t say this would be the your default solution. Say this will work. This is what we’ll implement. You got to this is experimental and it’s meant to be. I I don’t think it’s experimental. I think it’s a I disagree with that statement. It’s an unsupported solution and if you have nothing this is better than nothing as I would say. So it does
19:39 A lot of things like like what other solution are are you aware of Tommy that monitors gateways up or down. Actually there was there used to be a PowerShell one but let’s let’s take a step that was ruer and mono and that was like three years ago. Oh I remember not that this doesn’t use that. So the fum I think has some form of that as well going on but like again the idea is like if you’re really trying to get your head around your organization what other options do you have? I don’t think there’s any other really good monitoring options. And again, if you’re an admin, again, how I’m hearing this question come in. Hey, where’s the
20:13 Off-the-shelf solution? Where’s where’s the one button click install? Where’s the easy button to get monitoring up and running? There’s not a lot of that out there right now. So, that’s something that’s that’s not it’s not it’s not as easy to get your hands around. Yeah. So I’m curious if the PowerShell scripts and modules are still supported because honestly a lot of organizations I knew did rely on that but yeah so you could use one but I think we’re we’re looking at every scanning and every
20:46 Activity kind solution here where Mike I I want to take a step and focus on there what is the baseline because you’re raising some good points and I think all of this is important. important. However, let me ask you for this type of person where we’re really just in the PowerBI world, what is the baseline that you would expect them to be tracking and pulling in? What is the baseline, right? Because you could do all of that.
21:17 I wouldn’t say that’s all really going to depend on your architecture, right? , as an as an admin of your fabric capacity, right? There’s there’s a couple things you need to do, right? as an admin. Let’s talk about let’s talk about that first because I think that’ll really frame out like what you want to do in monitoring because I think that those two go hand in hand in my opinion. Right? So if I’m an admin, what should I be doing as an admin? I should be setting policies in the admin portal. I should be reporting up to leadership
21:51 Stakeholders essentially how how adoption’s going. Are we are we have we built good process to add more workspaces to add more users to get more reports being built and what content are we building right so as an admin of of fabric wouldn’t there be some metric around here’s the number of certified things that we have here’s the usage on certified items I think those are like if your strategy is build apps and deploy them you want to track the building of those apps how
22:24 Many apps do you which ones are being used and by whom. So, I’m just going to start there. Like that’s to me those feel like admin level tasks. See, I I would argue that at least for the purpose of who’s writing this the I don’t think this is an admin request. this is a person who’s an education consultant who supports 70 school districts with the dashboards. I don’t think that the admins or the auditing log the audit logs what a lot of people need to get out of this is
22:55 Only for admins. Most of it is most of it absolutely I’m not I didn’t say anything about audit logs. Are you listening to what I’m saying? Yeah. I’m saying like they should be monitoring what is measured for success for them. Right. So this person is helping as a consultant for them. Fine. But they’re building all this content they need. They’re reporting back to their stakeholders. What did you do? That’s what I just said. I’m not talking about logs. I’m talking about what does the admin And that’s what I’m asking. What is the is would you say then that’s the
23:27 Baseline in terms of like what the minimum they need to track and pull in. Is it more than the usage? So, okay, let me let me rephrase it. I don’t understand your I don’t understand your question. I think you should define what this person should be doing. And again, I would define this person if you’re building reports, making app apps for customers, and then you’re trying to report up to leadership what the results of what you’ve built. That feels administrative level stuff to me. Would you agree or not? Let’s start
24:00 There. I would I would say it’s obviously admin level permissions, but that data itself and who’s going to you No, no, hold on, hold on, hold on. Why would I give you admin level permissions and not call you an admin? Hold on. Yeah, sure. If I’m doing all the APIs and PowerShell pulls myself, I better be an admin. Not saying that. I’m just saying whatever you if the admin level permissions, obviously, it’s going to come from an admin. However, let me let me say the rest of this. The data that comes out of that doesn’t necessarily
24:35 And more importantly should be for more than just admins. So the admin may be the one who’s creating the semantic model. The admin may be just pulling the data into a lakehouse or into a static table to actually get the historical records. That may be the only role that the admin does. However, it could be the rest of the team who’s building in a sense the intelligence out of that data. the admin may not be the one who’s actually going through and building the DAX measures and the report off of this
25:09 Because again the what’s lacking in the workspace monitoring is outside of your 60-day interval is how the data is structured and if you’re especially if you’re trying to look at things over time to your point to say we’ve been more successful here are things we need to retire all those things are going to have to be off historical data so yes will an admin need to get involved. That’s probably a better way to say it. Yeah, absolutely. You do need an admin involved in your tenant in order to get a solution here, bar none. However, the
25:43 Admin can just pull that raw, , unstructured data into CSV, JSON again at World Lakehouse with some trusted lieutenants out there who say, “All right, build the semantic model, clean it up, make that relationship between we have the scanner data that I pulled in, I have not done anything with it, but we have it and we have all the usage.” Now you can actually now build in the relationships to actually say okay this report is related to that app here’s the usage for all those reports and so
26:17 You can have who’s not just admins using that data and I think that’s an important distinction here more importantly I’m going to lean even more into that and say I think any BI team who does not have the ability to look at the usage metrics from a raw point of view and build their own intelligence out of that is lacking. Where I’m struggling, Tommy, is the things that you’re describing are admin
26:49 Features. The the things that like even in this question here, I’ve explored the fabric capacity metrics. Okay, you can install apps. That’s not an admin, but that’s getting close to it. I’ve also looked at enabling the admin monitoring. My opinion here is this user is acting on behalf of this organization as an admin and doing admin level things. The only things that they’re touching right now is they’re doing what is the note here? I’m trying to
27:22 Look like look at the me back at the message here. It’s saying I’ve explored the fabric capacity metrics and started enabling admin monitoring. These are both insufficient for what I’m looking for. , and it says I’ve also used, what did it say? Previously, I tracked report level usage by using the built-in usage metrics, which again, that’s only per workspace. That’s a that’s a single workspace view of the metrics that are going on. And then, , yeah, that’s it. And this this is this is an area that I’m
27:55 Saying like is is not This is the area where I feel like things are not quite sufficient. And this is where I’m saying if you want a better off-the-shelf solution, you need to go use other APIs or do more advanced things such as go after the scanner API. So, you don’t have to be an admin and like write out JSON and all these other things, but you do need to understand like there are solutions out there. You do need to understand the API exists. BUAM is a good solution there. Our company helps out companies with this
28:27 And builds good solutions on this one. Ruy’s solution a long time ago was doing a lot of admin monitoring things. But at the end of the day, what’s really required here? What do we really want? I think what you want is you want tables of data with dimensions and facts. That’s what you want at the end of the day. So to get from a scanner API to a somewhat dimensionally modeled bit of information, you’ve got to comb through a bunch of JSON and build a bunch of things. And so if you go look at the FUAM solution, I have it up here in my tenant now. there is probably
29:00 About 20 different notebooks. They’ve got one, two, three, four different lakehouses. And they’ve got probably about 15 pipelines to load activities, load the capacities, load capacity metrics, load the capacity refreshables, load the delegated tenant settings, load fuom data, load the git connections, load inventory, load items. Like there’s all these pieces to this thing. So all this to say is there’s a lot of data when you turn on PowerBI and all the
29:32 Metrics that come out of things. There’s a lot in there and you can start with the monitoring app, but really I think what you’re going to get down to is what needs to happen is you need to have the event level details at least in a table somewhere and then you can build on top of it. And I’m saying the fastest path to get there is either go use FUAM or go figure out how to hit the scanner API, dump the data out, and then start from there. , I think you’re going to have to get to that level to get there. There’s nothing
30:04 Offtheshelf that is that easy to get going. And I and I would agree. Unfortunately, there is that paytoplay here. There’s really no other out of the box solution. That being said though, I’ve worked with companies or when I first started, I wasn’t an admin of the organization, but I was an analyst and I know we were tracking our adoption and I talked to the team, the IT, and I said, “Look, here’s this thing called usage in the scanner API. Can you just push that into a CSV file here and I’ll do the rest from there?” And that was fine because
30:37 Here’s the thing. all that data there. It’s a This goes back to the thing that we’ve talked about a few times where most BI teams aren’t actually looking at data to actually see what they need to do differently and actually say what their actions are. And all the things in FUAM, all the things that are available in pipelines, that’s fine. That’s fine. That’s great for an admin. That’s great for an admin who needs to see capacity, who needs to see security. But if I’m supporting schools or if I’m if I’m just
31:10 The data guy, right, there’s three things I need. I think you’re I think you’re underestimating the power of this person. If this person is already in admin monitoring and already pulling out and pushing apps, this person has as much access as they need to get whatever they want to do. They’re an admin. Assume it. I What What are they doing in their job that makes them not an admin? they’re supporting the dashboards and the reports they could beat. So but let’s think about okay if I’m giving what what if the role of
31:44 The person I guess what I’m arguing here Tommy is if the role of this person is to go back to leadership and say here’s how the app and the platform is being used. Are you not an admin? That’s my question. You could have an admin level permissions, but let’s Are you not an admin? Yes or no? Fine. You are an admin by nature thing. That’s by definition if I I feel like that is a role that an admin should have. That’s all I’m trying to make the point around here. You can argue are you
32:16 The admin of the workspace? Are you the admin of the entire tenant? Are the admin of like the app? There’s a lot of different admin level like higherend privileges on things. But if I’m a role of an admin of a PowerBI tenant, I think it’s clearly if I am trying to sum up all the information that’s happening from my organization and go back to leadership and provide here’s how we’re using our investment. I don’t care what you are. That feels like a task that is an admin level task. So that’s why I would push this person into the the
32:50 Questions they’re asking. Now to your point Tommy I do want to give you some like like credit here to this right which is when you look at like do we have to give them full admin access of the entire tenant to do what they’re doing here I think no right so do I let them have the admin portal maybe maybe not right there may be a separate IT admin where you divide the IT people own the the settings menu the admin settings right and this user while they’re still being adesque of reporting back and giving details, right? There’s an IT
33:24 Admin that controls the back end. And so I I think this line blurs very much between organization to organization. Some organizations will keep PowerBI admin settings only in it. Other organizations don’t care and let a business user or a front-end user own the business own the admin settings of PowerBI. Right? , so I I think you can’t really specify all admin settings are only it and , everything else is not it. And to your point, I agree the controls you can give to users are very fine grained, right? They can be nuanced per
33:57 User and how that’s been working. So I I agree with you there, but I would argue the task that’s being described here is an admin level task. [sighs] I don’t know why I want to push back to you on so much on this because to me, this is all about what I was doing when I was not an admin. when I was just a data analyst when I was at the forefront of PowerBI to the organization because we use this data to eventually at the end of the year to tell my boss and their boss like the what usage went up thing. So yes, and I I’ll
34:31 Give you I’ll give you your flowers here where yes, I had admin permissions, but my job at the end of the day wasn’t to make sure the capacity was running. Yeah, I’m not going to fault you on or I’m not going to fault this company for not giving you the proper title that you deserved. They were asking you to be a data analyst, which was the title, but what you were actually doing was being you were acting as admin on the on the tenant regardless of what they told your title was. , realistically, right? If you if you’re so the fact that you tell me you had like did you have let me let me ask another question. Let me just
35:04 Step right there. If you in that situation, Tommy, when you were the data analyst and they were asking you to report usage metrics about your tenant back up to leadership, what level of permissions did you have in the admin portal? Yeah. No, I I [laughter] of course I I had I had to. No, you had all of them, right? My assumption here is you had all the admin privileges in the admin portal. Correct. Yeah. I was an a glo I was a PowerBI global admin. Okay. So the reason I point this out is because even though
35:36 The job title didn’t align with what was going on there, they were expecting you to be the leader, the the role leader, the admin of the entire PowerBI tenant. So even though your role wasn’t really like, , BI intelligence, , director or something like that, which it probably should have been, right? It should have been a better title there. You were acting on behalf, you were that governing body that was in charge of bubbling any of the metrics up to the rest of the organizations. So that that is important. Like I think that’s that’s the note I’m trying to make there. So and and I’ll I’ll absolutely give you
36:09 That. I’ll absolutely give you that. It was interesting though that once I did create that usage report, we did have some great great champions from the other departments. And after this is where to me the the really the fruit of this or the impact of what this can be. , I was just going through talking with them. They were already savvy, but they were the basically the the assistant to the director of sales. So, they had a lot of a lot of
36:41 Hold, but they knew PowerB was important. And I showed them what I look at to say what to focus on. She’s like, can you give me a version of that because I want to make sure our team’s using the right reports. And this was not anyone in business intelligence. This was someone in sales. Sure. I want to be able to track this to make sure that everyone’s looking at the right report for quota and I can then when people complain that they don’t know their numbers or whatever is going on I can look back to say have they actually looked at it when they have because that’s the beautiful thing you
37:13 Can do with very basic data here is it’s not all about how much data you can get. It’s just simply having that data in sense in a tangible way whether it’s a warehouse or imported. One of the biggest things that we did was we created automation around it where any report that was more than 30 days past view past viewed a little conditional formatting had a page just for that so we knew what to retire and what to remove. So then like so what I’m talking about there this is all based on the
37:45 Admin data so to speak it’s all based on you do not get that information without pulling that in whether it’s a service principle or again someone with a a global admin role or powerbi admin role but the ability to what they can do with it this is where I’m I think making the distinction here on just pure usage is where I’m falling on the sword here is because I don’t think enough people do it. Well, there’s a there’s a difference between what I think you’re describing
38:16 Here, Tommy, which is one on one side of this, there’s can I get my hands on the data, right? Can I get the data down? Can I use the API calls I need to do? I can I can I get the information into a lakehouse? That’s one side of the equation. Can I supply at least the data that I need to get? The other side of this equation, I think, is okay, now how do we distribute the usage metrics? What does the distribution of the m usage metrics look like and how do you delegate that portion of the admin role to other people and I I would agree with you Tommy I for my the way I read this question excuse
38:49 Me [clears throat] the way I read this question is we are having issues just getting to the data we’re at step one what you’re describing what you’re speaking to is step two of this which is okay now that we have some known usage where do we build the common report where do we build the you our internal company usage metrics app where we can push out to the broader part of the organization. Hey teams here’s here’s now what I want you to start consuming at your workspace level. So where’s the
39:22 Linkage between here’s the admins of this workspace here’s the report that uses role level security and then I will start showing you when I go into this report all the admins can see the workspaces they own and the activities that are occurring on their workspace like that’s a different problem and I don’t hear this question even being asked with that yet they’re not trying to distribute insights on usage they’re just trying to get to the usage is what I is how I’m reading it but that just may be my interpretation no I think that’s That’s a that’s a good point though too because
39:54 Just even the basic question of what the person’s asking for is just over time and I love that so much where really what they’re trying to say what how they’re engaging over time and this is a very basic ask that honestly everything we’ve talked about is valid because you can’t do that without everyone talked about much less more than where do you go from exploring I guess the biggest thing is there really is no other way is there Mike for if I want to see if I want to create a
40:27 Report that’s showing me my it’s my app my act app activity dashboard let’s say looking at all the views the number of people last time I was viewed by app there’s really no other way without getting the raw data of the scanner API yes to get the metadata and then using the audit log to get the usage correct And then just basically creating a semantic model that way. Correct. Yes. Yep. Yeah. That that’s what that’s what I’m surmising here is like how how can I get this customer in the fastest path from
41:02 High volumes of data into a solution that works. And so again this is this is what I’ve gone back to Tommy like I yes I understand what’s going on here but I think FUAM is a is a bit overbuilt. It’s like the everything solution, right? And this is where I think we struggle a little bit is like, okay, what parts of a solution do you care about? Do you care about, , it’s almost you need like a peacemeal solution to some degree, right? Hey, these are the things I care about. What parts of a deployment solution should I be deploying? Should I be deploying a a full solution around , gateways? Like this
41:38 Customer may not have any gateways. It may all be in the cloud. Okay, fine. great like no gateway. So that part of the fuom solution isn’t required. all the other usage metrics like are you using KQL or other databases that are there like you may not being using fabric. You’re only caring about PowerBI usage. So describing like what you need to monitor and then getting that down to like something that’s easy to use. I would agree a lot of this is customuilt. A lot of this is are built by companies, organizations or you’re working or researching things. So my recommendation or advice to this one would be go at
42:12 Least go install FUAM on a place or an environment where you can see and test that solution out. It has a lot of really good examples of getting access to API calls, how to set it up, all the different things that you can do with monitoring and then start from there, right? And then you can basically take the best parts of that and only migrate pieces of that that you need and then you can get the the metrics and the reporting that you want. How much would you think that people should actually invest in more custom solutions because most of this is all
42:43 Done by hand. It’s a GitHub repo. Again, some supported some like Romanos which I believe is actually archived now. it is it is archived and it’s actually I’ve we started our solution based on our knowledge and what we learned from Ruie initially. his semantic model is extremely complex and he’s doing a lot of weird relationship based building things in there that no longer apply anymore because the JSON has changed format multiple times since then. And there there’s again to get not too technical
43:16 On this thing Tommy but like when we get into the admin monitoring when you pull the admin metrics certain tools have two or three columns that have different data in them based on where it came from or what tooling is providing the information. So even then like the the data you get back is not in a unified simplified schema for everything. It’s still in flux. It’s still changing a little bit. So you may have something called this is a bad example but you may have something called workspace id you may have another called a column
43:49 Called workspace so or source workspace or something like that right so each tool is providing metrics back to a central system whatever that may be but when you pull the API data you may have two columns that mean the same thing but they need to be unified into a single column for your reporting like that’s the stuff that you have to understand and like dig through this is weeks and months of time of figuring this stuff out. That’s why I would recommend partnering with a company or , call me up. I’ve got a solution. Like we can have a a solution deployed in an hour or two in your
44:22 Environment and you have some basic reporting and you can start using the scanner API. , another part of this too, Tommy, that I think is really relevant here is the speed of monitoring. Again, back back to this question around what’s the best place, how do you figure out this ideal solution here. I also want to note here too, the more frequently you want to pull the data into an analytics centralized reporting solution, the more expensive it will cost you, right? Every time you run a solution to go get data, it’s going to cost you more compute units to go run the job, per se. So, what I want to point out is that doesn’t
44:58 Have to be the case. Whatever you build, whatever you pick off the shelf or whatever you talk to, I want you to be mindful of do you need this data once a month? Do you need this data every week? Do you need this data every day? What are you using the data for? And I think to the question here, back to your point earlier, Tommy, was if we’re just looking on number of people, which apps, which audiences, you’re probably good pulling this once a week and going through the data because you’re going to provide bigger updates around what’s happening in the
45:29 Environment. So pull the last seven days, save it down to the lake, boom, you’re done. You save yourself a ton of money by not having to run that job every single day. So there’s also a lot of opportunity here to cost save around reporting and metrics because gosh Tommy I don’t even have that big of a tenant and I’ve got like oodles of data. It it can get big fast if you’re not really paying attention to the analytics. Oh yes. And what we used to do is we pulled I I actually this was before AI man. I had a PowerShell script
46:04 At my old company which I’m not sure if I took it with me because it might have been some NDA but basically whenever you ran it would ask you do you want to get the activity from the last 30 days if you haven’t pulled it since then do you want to also get the scanner API do you want to get the gateway refresh and then do you want to get the list of users and you just choose from those options and it would basically look at everything run go and it was it pushed in a CSV at at the time, , CSV on a local SharePoint drive.
46:36 Yeah. Which wasn’t great, but guess what? It got some of the job done, but now we’ve got like now it’s way more complicated now. And it really it really is because I think too when especially when you’re thinking of the word adoption, right? It’s more it’s going to be a lot more than just report usage. And we’re going to be getting to that, , especially at some point, , I see 120 dashboards in 90 schools. I already hear managed self-s service coming as some point or that ability for the schools to build their own data.
47:10 Then what from a usage point of view, I I’ll before we again try to boil the ocean there, I think there’s a a very straightforward solution here and it’s been the same solution for years from the from a baseline point of view from if you just want the bare bones you want to make sure that you get from point A to point B data data wise you’re pretty much dealing with the same solution if you don’t want any other bells and whistles that being said there with what Microsoft doing with u what
47:46 You’re doing too there’s a lot more sophisticated alternatives out there what basic solution are you referring to? I’m just talking about the pulling the API, pulling it into a CSV thing. There’s no it’s not nothing really out of the box. Just I would call that level two of the solution. I think level one of the solution is go to the workspace and use the workspace use the workspace usage app. I don’t use them anymore, but like again I don’t know how this person is just deploying things, but the the workspace usage app and that’s that’s
48:18 All you get out of the box. That’s the only out of the box thing you get. That’s level one. I I specifically did not mention that because to me that is I’m trying to think of the analogy there. But I wouldn’t even I would not say that’s even a a tempor that’s a solution you have if you need something real quick. But that is not on a stepping stone to get in the audit log to me. Personally personally I agree. I’m not saying it is. Okay. I’m just saying that’s that is the easiest simple solution you can get there. And you can you in the workspace usage metrics if you go to the filter pane on the right hand side you can kind
48:51 Of hack it a little bit where you run the report it gives you the workspace level usage and if you open up the filter pane on the right hand side if you remove the report ID from that report you can then see all usage in inside the entire workspace. So that’s that’s somewhat helpful time. Yes. But you again but you can’t really get anywhere with it. There’s like there’s no way to export it. It doesn’t have a semantic model. Again, to your point, Tommy, it’s extremely limited. That is probably the easiest, quickest way on a per workspace level to see usage. Now, I’m assuming here
49:24 Because this customer is thinking about this one, and again, I’m I’m also looking at like organizational dashboards, we’re talking about 9,000 users, we’re talking about different apps. I’m assuming they’re using PowerBI apps and not org apps which would allow you to have all the org apps in one single workspace which is a fabric thing. So if you have organizational apps that’s all in one workspace and then you get I think different metrics based on that because now you have a single workspace with many apps in it.
49:56 And so I I think even the structure of what you’re doing potentially again this is really of if you’re in fabric or you’re not in fabric I do like the idea of or organizational applications but it really shifts on you have to rethink your architecture because user audiences no longer exist that that’s not a concept that you would use there. That’s a really good point. So that’s that there’s a lot of like ways you can distribute. I still do adhere to like whether you’re using a workspace app or an organizational app, both of those are the proper way to
50:29 Deploy stuff like to get it out to your broadest audience. I think that’s the way to go. Isn’t it amazing, Mike, that still after 10 years, we’ll say eight years since the API has been out, there’s really not a ton that’s changed with this. Like you talked about FUNAM, sure, but to me, Mike, I’m gonna it’s a great solution, sure. But the fact that it’s something that’s not again actively supported and it’s an at your own risk thing, that that’s the best that we have
51:02 Right now. Yes, you have the that to me is a like that is not an adequate answer there. Let me Yes, I agree with your comment, but I want to add a little bit more context. The reason why there isn’t a good offtheshelf solution to get this to go I think I think the issue Tommy is because the the issue is because the the data underneath the monitoring is continually shifting. It’s very difficult to build a consistent solution when your
51:37 Underlining data is constantly evolving and changing and doing different things. So a solution built today may not work well in two months from now. A solution built today might have to have different data or different inputs to a solution that was like 6 months ago. Right? So to me that that is the issue that we’re dealing with here and that is going to be the problem. But yeah and that’s fine and I I one I totally understand that but if you’re an
52:11 Organization going all right let’s launch this and we’re going to track everything this way and things break. Yeah. So that’s why I think we’re talking about the baseline here. There’s a ton you can go down and trust me there’s a lot of rabbit holes of being able to go through and there’s a few great [clears throat] community things that I actually never heard of out from before from PH data is another one that is actually another solution I never saw before but for the most part it they all start in the same place they all start with the API making that call and then getting that
52:43 Data in some one other that way or another yeah again I’m going to go back to like there needs to be better solutions that are easily more easily start up can start you get monitoring turned on we have a solution I’m going to we’ll see where it goes we’ll see what customers want to see the solution evolve into a better thing but I I definitely think there’s an opportunity here that to help people build a better monitoring level solution across their entire fabric or PowerBI instance for that matter I do feel like when you are monitoring there is a
53:17 Commitment that you’re going to have to just go fabric, right? So, you could get the data the details down using other tools, but to be honest, the easiest way to get going with monitoring if you’re going to build your own proper solution, you need a minimum of a fabric workspace because you’re going to need pipelines. You’re going to need storage. You’re going to need to transform the data with notebooks or some other other way of shaping and shifting that data around. That’s what you’re going to need. You’re going to need something like that that just works. And so when I think about solutions for monitoring, that’s the starting point of what we should be
53:49 Talking about, which is if you’re going to be doing monitoring, your company should probably be committing. If you’re not going to use the standard stuff, you’re going to need to figure out a solution to do this in. And the easiest way to do it is bolt it directly onto fabric with a fabric workspace. And you can go down to an F2. Yeah. Right. So an F2 would let you do a lot of this. Again, if you don’t do it fast, if you don’t, , have a lot of data that you’re like trying to get in every day or every hour, I think an F2 would easily be able to support that level of investment, which is $155 US each month. That’s reasonable, I think, for a reporting solution.
54:22 Not bad. Not bad. All right, that being said, I think we’ve beat this question up enough. Really good discussion on admin monitoring. What does it look like even around what are the roles of an admin and and what are the parts of that onion as well? So, hopefully we gave you some insight there. I’m sad to say there is no what we have found there is no real easy off the sol shelf solution. You’re going to need to go hit APIs. You’re going to need to go get the scanner API lit up. That will then give you I think the details that you want to see, but you’re going to need to spend some time digging in it. If you have questions around this or you need help with this,
54:53 Reach out to Tommy and I. we we do this. We know how these APIs work. we are consultants and we both help out organizations to get their monitoring in place and under wraps for whatever you need. So with minimal investment, I think you can get up to go up and running with some monitoring solutions. That being said, thank you very much for listening to the podcast. We hope you enjoyed this episode around monitoring and fabric monitoring. , we got some value out of it. That being said, if you don’t mind, please share this episode with somebody else if you like it. We’d also love for you to become a member of
55:25 Our channel. These episodes will be released as soon as they’re produced and on the channel in the members area. Pommy, where else can you find the podcast? You can find us on Apple, Spotify, or wherever get your podcast, make sure to subscribe and leave a rating. It helps us out a ton. And what? H share with a friend since we do this for free. You have a question, idea, or topic that you want us to talk about like today in a future episode. Head over to powerbiot.tipsodcast, leave your name and a great question, but make sure you’re very, very clear on what you want us to answer because
55:57 Anything nerdy, we’re going to go off on a tangent. And finally, join us live every Tuesday and Thursday. am central and join the conversation on all power tips social media channels. Thank you all so much and we’ll see you next time.
Thank You
Want to catch us live? Join every Tuesday and Thursday at 7:30 AM Central on YouTube and LinkedIn.
Got a question? Head to powerbi.tips/empodcast and submit your topic ideas.
Listen on Spotify, Apple Podcasts, or wherever you get your podcasts.