
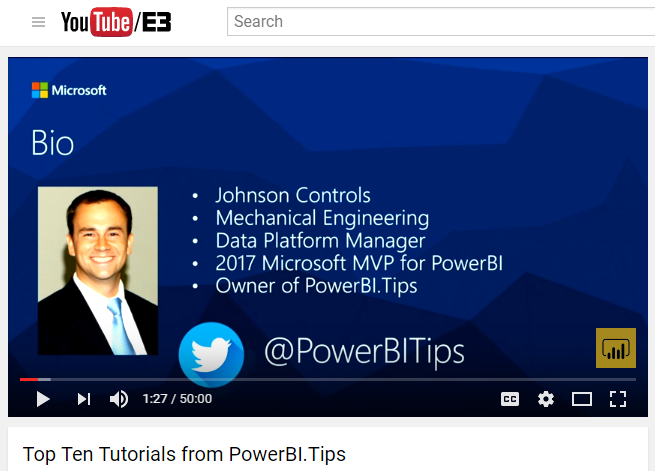
This year I had the wonderful privilege to attend the Microsoft Data Insights summit for 2017 as a speaker. My topic was the Top Ten Tutorials from PowerBI.Tips. So, let me say thank you to all those who attended you provided a very fun audience and were very positive, Thanks. For those of you who couldn’t make it to the Data Insights Summit below is the actual talk:
We went through 10 different tutorials in 50 minutes. Needless to say we went pretty quick. So, if you were there, or just want to go through the tutorials on your own here is the list of the Top Ten Tutorials.
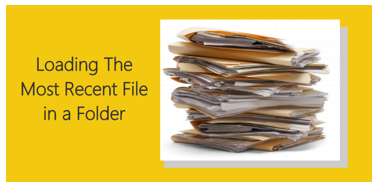
10. Loading Data From a Folder ( Link to Tutorial )
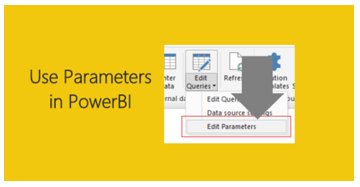
9. Using Parameters ( Link to Tutorial )
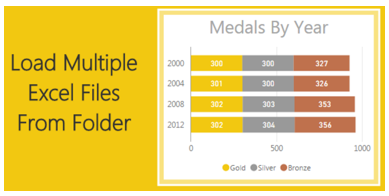
8. Loading Multiple Excel Files ( Link to Tutorial )
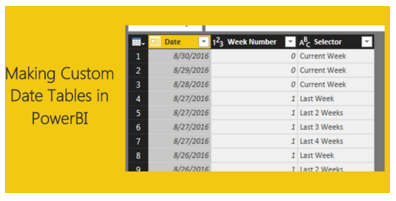
7. Custom Date Tables ( Link to Tutorial )
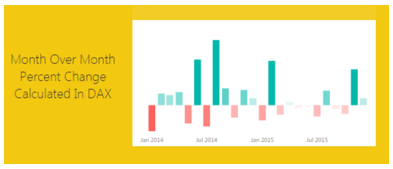
6. Percent Change ( Link to Tutorial )
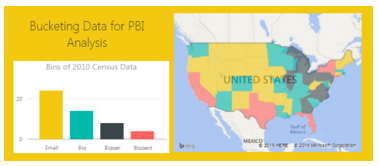
5. Histograms & Disassociated Tables ( Link to Tutorial )
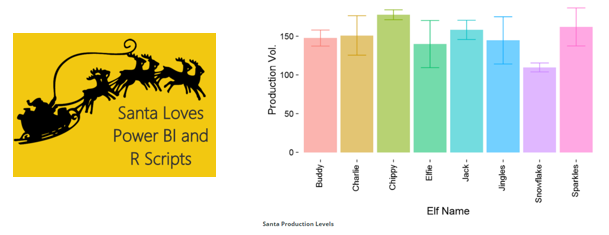
4. Bar and Whisker Plot in R ( Link to Tutorial )
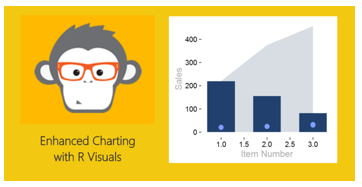
3. Bar, Scatter, and Area Chart in R ( Link to Tutorial )
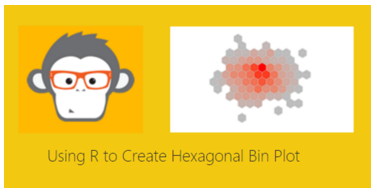
2. HEX Bin Scatter Plot in R ( Link to Tutorial )
1. Color Theme Generator ( Link to Tutorial, Link to Advanced Color Theme Generator )
If you wan to learn more about Power BI or DAX follow this Link to books and other helpful Power BI resources.