PowerBI.tips

Data Table Filters

June 6, 2018 By Mike Carlo
Data Table Filters

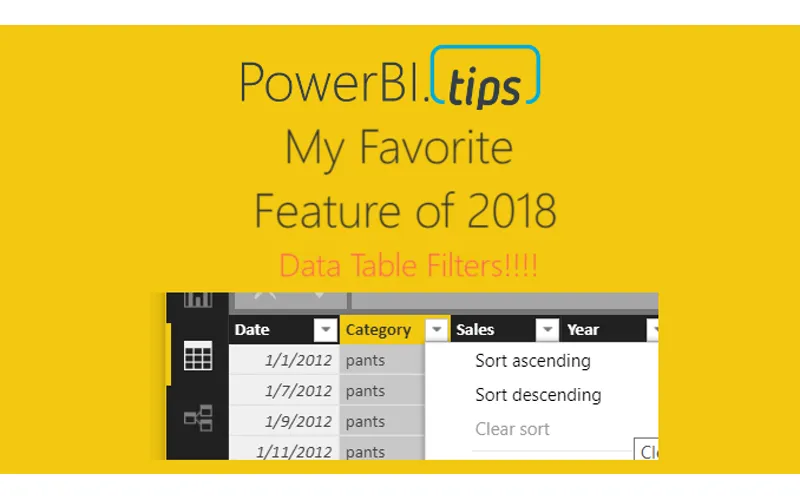
Hands down best feature this year to date, Data Table Filtering!  In the June 2018 Power BI Desktop Microsoft released the ability for you to navigate to the Data Table view.  While on this view drop down icons now appear which enable filtering of the Data Table.  This is super helpful when looking at the raw data that has been loaded into your data model.  Check out the video below to see how the feature works.

Other Thoughts:

For those of you who like Excel, and data tables in Excel, this feature will make you feel right at home within a pivot table type feel.  I hope you enjoy this month’s update as much as I did.  Thanks for stopping by.

For the official documentation from Microsoft follow this link to the blog announcement.

Previous

Apply a Filter to a Slicer

More Posts

Jun 10, 2026

Microsoft Build Recap – Ep.535

Mike and Tommy recap Microsoft Build 2026 through a Power BI and Fabric lens, focusing on the announcements that matter most for report builders, semantic models, and agent-driven app development. They unpack why Rayfin, Replit integration, OneLake, and new Fabric skills signal a shift from asking AI for answers toward using agents to create real production artifacts.

Jun 5, 2026

CI/CD Automation with Agents – Ep.534

Mike and Tommy explore how agents can simplify CI/CD in Fabric by helping teams work through Git workflows, merge conflicts, validation, and deployment automation. They also compare deployment pipelines with Git-based approaches and explain why small, testable automations are the safest way to start.

Jun 3, 2026

Claude Design & Power BI Embedded – Ep.533

Mike and Tommy explore how Claude Design, agentic workflows, and HTML wireframes could reshape report prototyping for Power BI teams. They also debate where today’s tooling still falls short, especially for Power BI Desktop users who need practical ways to turn context, design ideas, and embedded experiences into working reports.