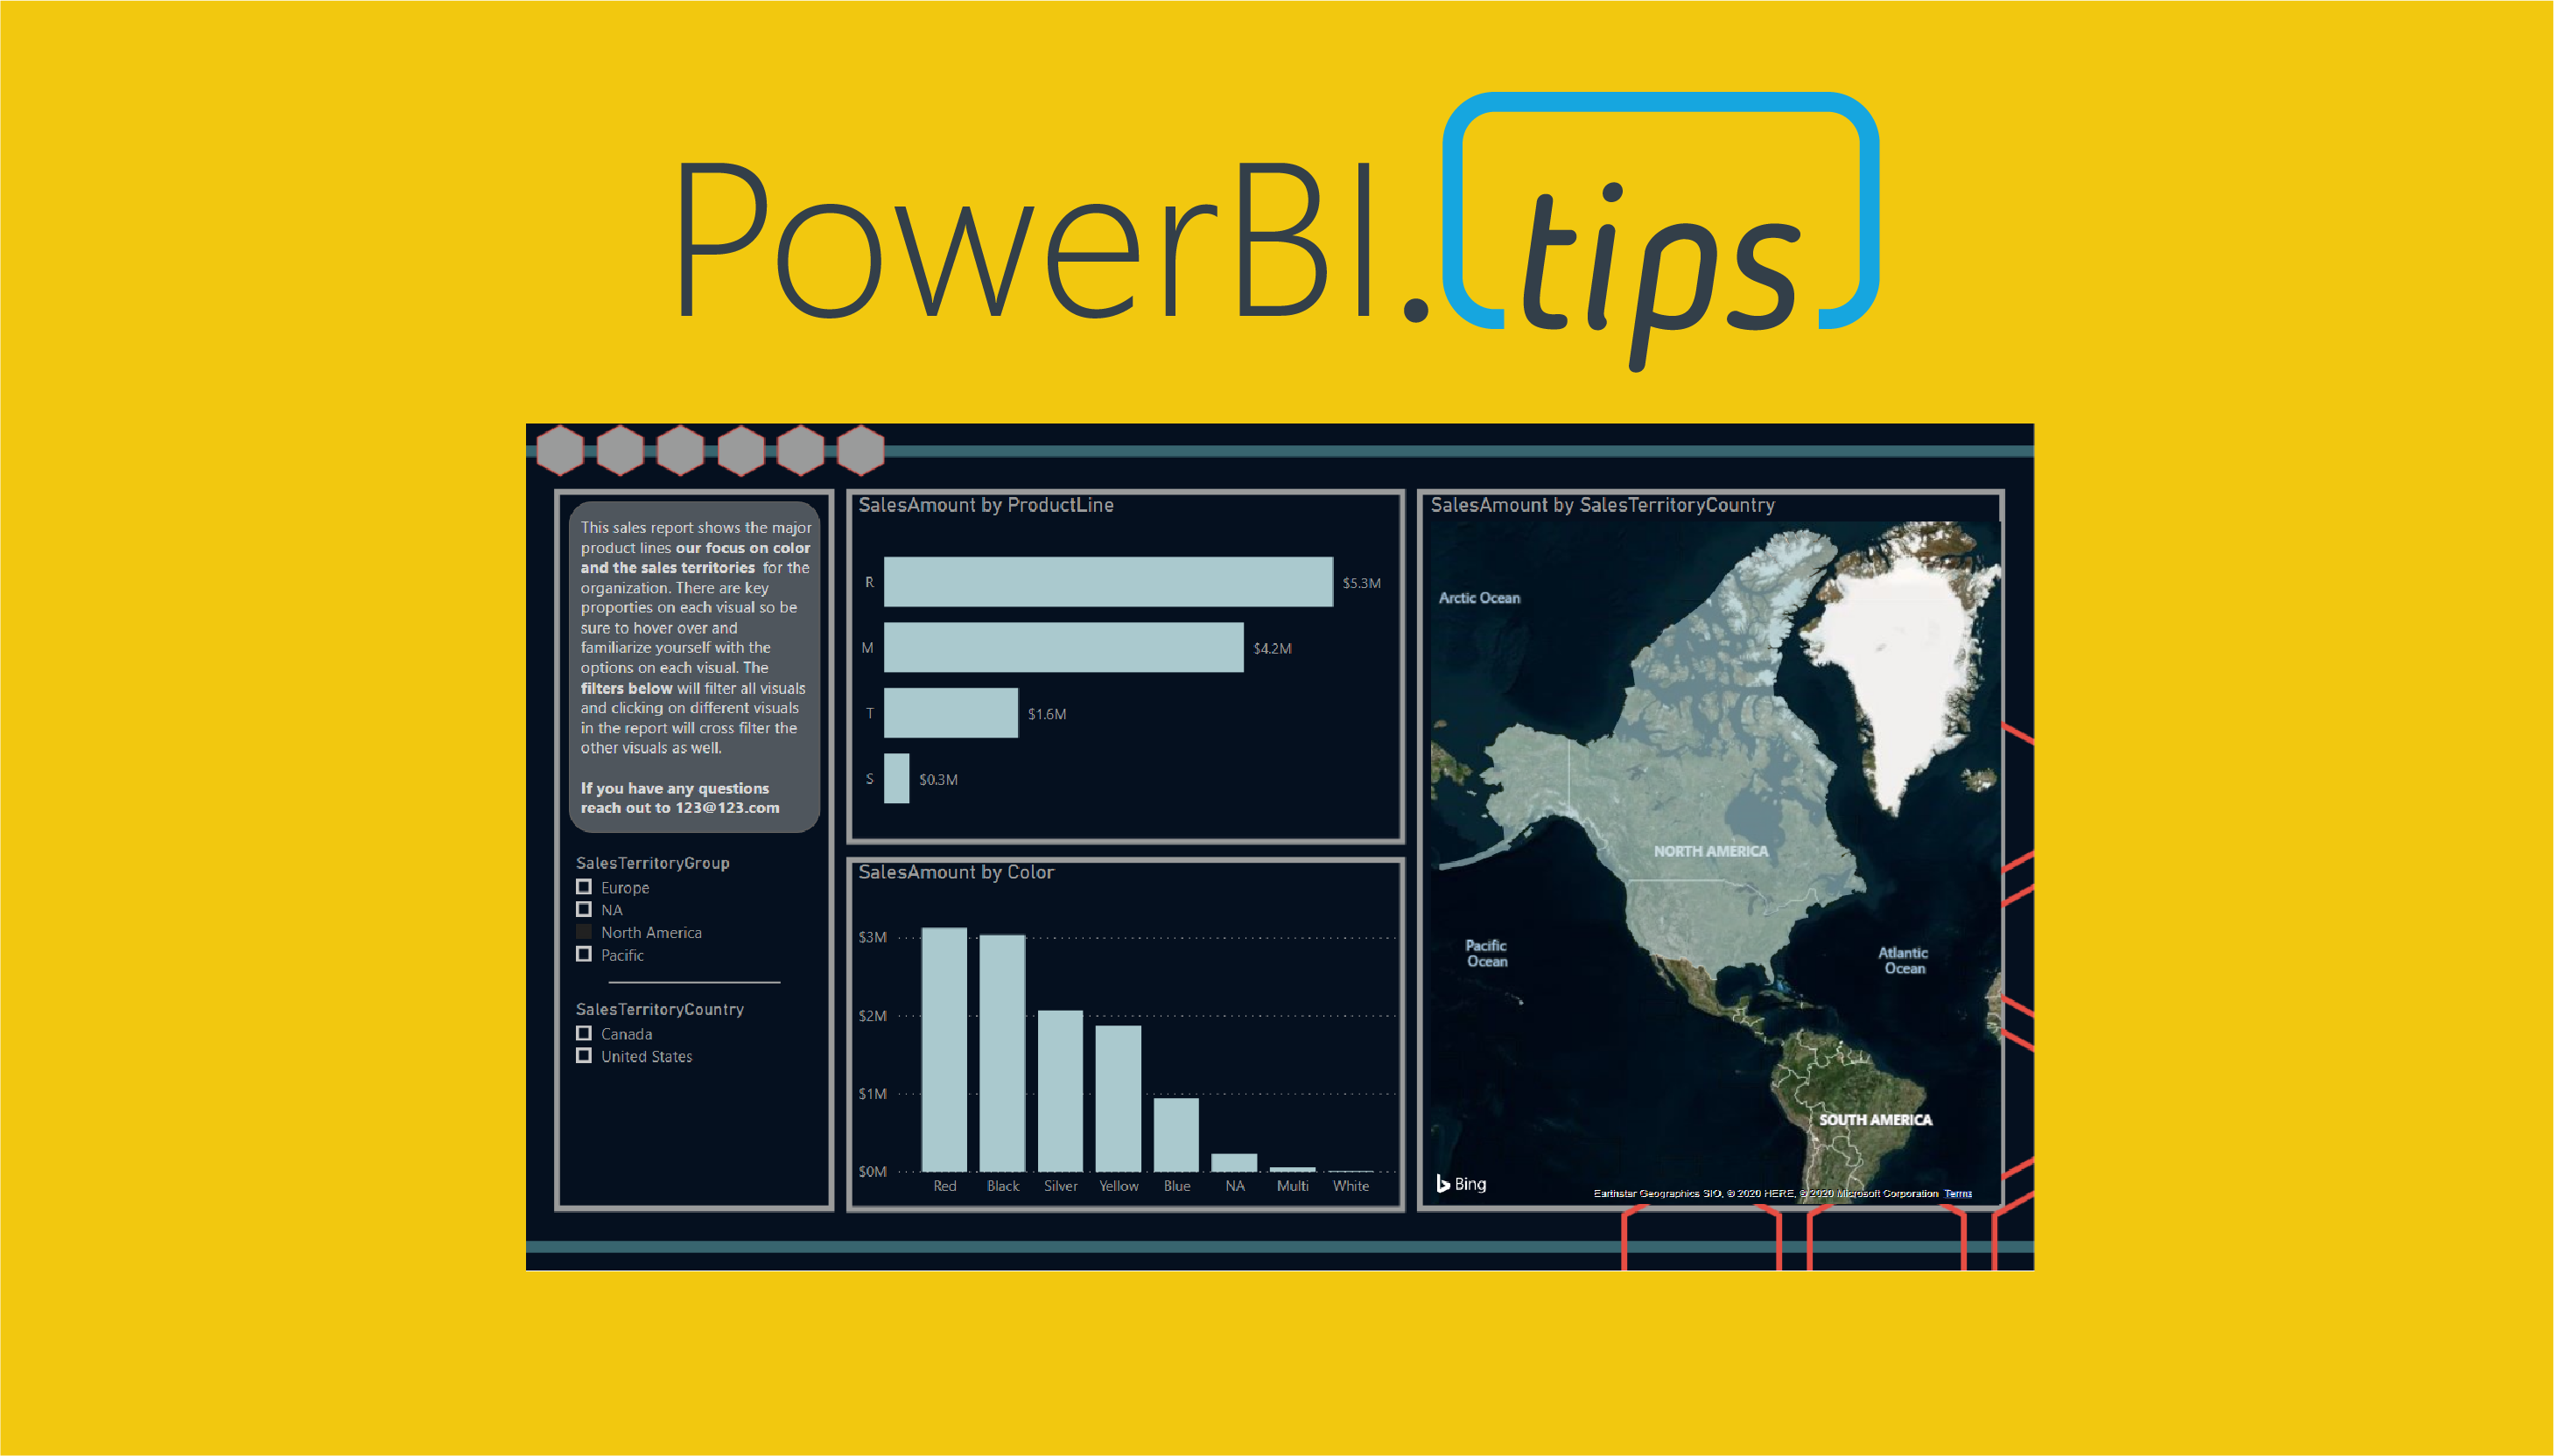
As a report author it is important that you build the necessary context for your end users. The main areas most often needing context either relate to the data or functionality contained within the report. The battle of space, usability and design all impact the choices we have. Lucky for us, Power BI has many different options and we have plenty of choices. This video will walk through the following options and explain methods on how to use them.
Text on Page
Visual Header Tooltip
Button or Imagefor
The Overlay
A Different Page
A Different Report
If you like the content from PowerBI.Tips, please follow us on all the social outlets to stay up to date on all the latest features and free tutorials. Subscribe to our YouTube Channel, and follow us on Twitter where we will post all the announcements for new tutorials and content. Alternatively, you can catch us on LinkedIn (Seth) LinkedIn (Mike) where we will post all the announcements for new tutorials and content.
As always, you’ll find the coolest PowerBI.tips SWAG in our store. Check out all the fun PowerBI.tips clothing and products:
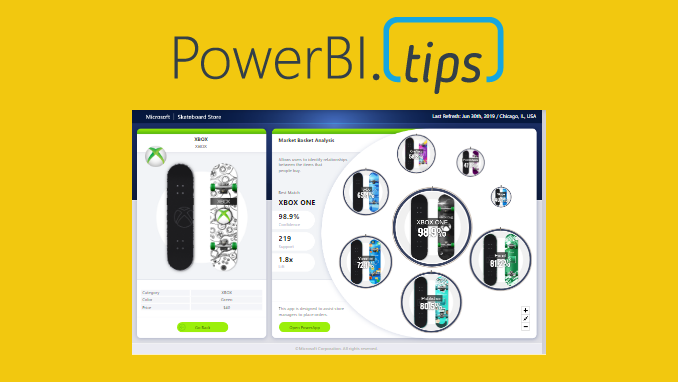
This report is just over the top amazing cool! Check out the work done by the Microsoft team to make this incredible report. It is called the Microsoft Sales & Returns report. We love this one so much we have produced over 48 HIGH RESOLUTION scrims based on this report design. Download all of them for free.
If you like the content from PowerBI.Tips please follow us on all the social outlets. Stay up to date on all the latest features and free tutorials. Subscribe to our YouTube Channel. Or follow us on the social channels, Twitter and LinkedIn where we will post all the announcements for new tutorials and content.
Introducing our PowerBI.tips SWAG store. Check out all the fun PowerBI.tips clothing and products:
This article is the second part in a series on API calls. It will look at some best practices and considerations when using API calls in Power Query. While it does not serve as a definitive list, it is an important start to consider performance when using such queries.
The articles in the first part of the series can be read here:
Batch queries refer to sending information in “batches”. Making an API call requires information to be sent to an external source, that information returned, then the information parsed and then loaded. Imagine we are doing this for thousands of different dimensions. Consequently, you will have the exact same process to be repeated this many times. Instead, check in the API documentation if batch queries are available. As a result, you may be able to send many of the dimensions in the same API call. This will drastically reduce the amount of times this process happens.
Use Data Factory
Data Factory is an Azure service that offers no/low code solution to Extract, Transform and Load (ETL) or ELT (Extract Load, Transform) processes. These are called “pipelines”. Pipelines are repeatable processes that allow you to copy and move data from one source to another (read the documentation here).
Let’s say you’re trying to load a high level of stock data for thousands of stocks. By doing this in Power Query may put big stress on your gateway. Your gateway may get overloaded and cannot handle sending so many complex API calls. It may be a better idea to load the data into a separate table (such as Azure Synapse). Then your power BI report can read this file directly. Read this documentation for a good overview of this architecture.
Shifting this to the Azure cloud can leverage Data Factory’s auto-scalability and ability to handle large volumes of data. This results in a more reliable and robust process.
Consider the most efficient design
Always consider the way that will send the least number of queries. For example, if you are using historical data that doesn’t change, think if you need to refresh this data every day. In addition, try and avoid sending the same information multiple times. Do queries off unique lists.
Only return the correct data
If you load data into Power Query from a source such as SQL Server and then remove columns, a process called Query Folding will take place. Essentially, the data isn’t even loaded into Power Query – it edits the SQL query to not include these columns.
This can only be done on certain sources. Custom APIs will not do this. Therefore, make sure you send the correct queries. Don’t return extra bits of data that is not needed and make sure you only return columns you will use.
Review
While this is by no way a definitive list, it should serve as a starting point to acknowledge performance considerations. Pay attention to how many queries are sent out and try to limit duplication. Remember, Power Query is a powerful tool, but make sure you are using the right tool for the job. Very large and complex operations can be improved with the help of other tools, such as Data Factory.
Here we are, jumping in to 2020. This Month PowerBI.Tips is kicking off and sponsoring the next year of Power BI user groups (PUGs) for Milwaukee. If you are not participating in your Local Power BI User Group we highly recommend that you get plugged in. Power BI User groups are intended for like minded Power BI individuals to get together and learn from each other.
If you don’t have a User Group you can follow along with our group. We record each user group and post the highlights from the 2 hour event. This month we go over the top three most popular blog posts from 2019. Then we demo creating a Paginated report in from a PowerBI.com dataset. Finally we publish the Paginated report into the PowerBI.com service for end users.
If you like the content from PowerBI.Tips please follow us on all the social outlets. Stay up to date on all the latest features and free tutorials. Subscribe to our YouTube Channel. Or follow us on the social channels, Twitter and LinkedIn where we will post all the announcements for new tutorials and content.
Introducing our PowerBI.tips SWAG store. Check out all the fun PowerBI.tips clothing and products:
Recently I had the privilege of working with Microsoft doing a Webinar on layouts. One thing we are passionate about at PowerBI.Tips is good looking reports that drive action. Often as report authors we spend a ton of time working on the data model, and the calculations. While these things are important, we must also consider the user experience.
You may have the most compelling report but lack some visual appeal. Alternatively we might have a great looking report but the navigation or interactions is un-intuitive. We then are spoiling the impact power of our report.
Use Layouts
This is where we feel our layouts make a great fit. It provides a shortcut to provide excellent looking reports on top of your existing data model.
Get your hands on some layouts now and try them out. Check out the downloads below.
Want a Layout without the PowerBI.Tips Branding. Check out these paid layouts.
If you like the content from PowerBI.Tips please follow us on all the social outlets. Stay up to date on all the latest features and free tutorials. Subscribe to our YouTube Channel. Or follow us on the social channels, Twitter and LinkedIn where we will post all the announcements for new tutorials and content.
Introducing our PowerBI.tips SWAG store. Check out all the fun PowerBI.tips clothing and products:
If you’re like me, building a data model in Power BI is an iterative process. Sometimes, you try out different ways of writing measures before you hit on the one that’s right. You end up with temporary measures that don’t actually end up being used in visuals. You may also pull in more columns than you might end up needing, just in case. The final result is your report masterpiece with measures and visuals, there are probably quite a few that you don’t need. Two problems with this are that having extraneous columns and measures (1) can slow down your model and (2) can make it more difficult to maintain. You may also want to know where on your report a change to a measure will have an impact.
The Solution
The problem this led me to was that I had no easy way of finding out where columns and measures were used in the visuals of reports. I could click on each separate visual to see what elements it used, but I couldn’t go the other way and click on a data element to see where it was used in visuals. In researching the existing Power BI utilities, I learned a lot about how to improve my data models, but I couldn’t find anything that provided the ability to find where exactly data elements were used in reports. So I decided to try to build one myself. Based on the incredibly informative blog posts of Gilbert Quevauilliers, Reza Rad, Jese Navaranjan, Imke Feldman, and David Eldersveld, among others, I was able to create a tool that met some of my needs. Hopefully it will help you, too!
The download contains both the pbix file and the template (pbit) file for you to use. Use the template if you want to just get started and use the tool as-is. To see how it works, or make some tweaks of your own, use the pbix file.
Setting up the Field Finder
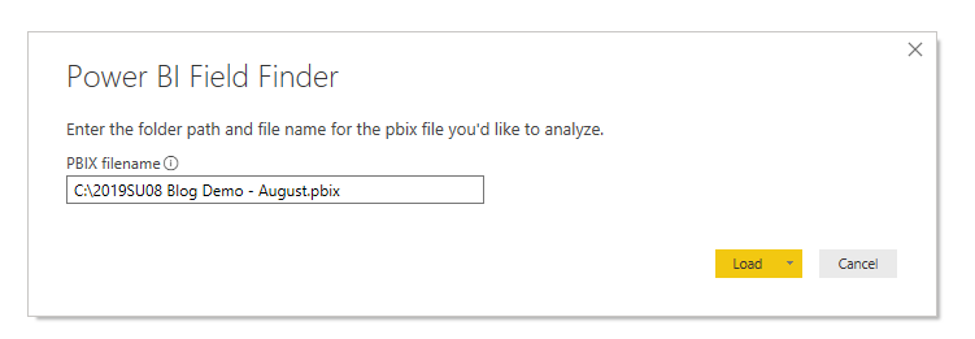
1. Double-click the Power BI Field Finder.pbit file wherever you downloaded it.
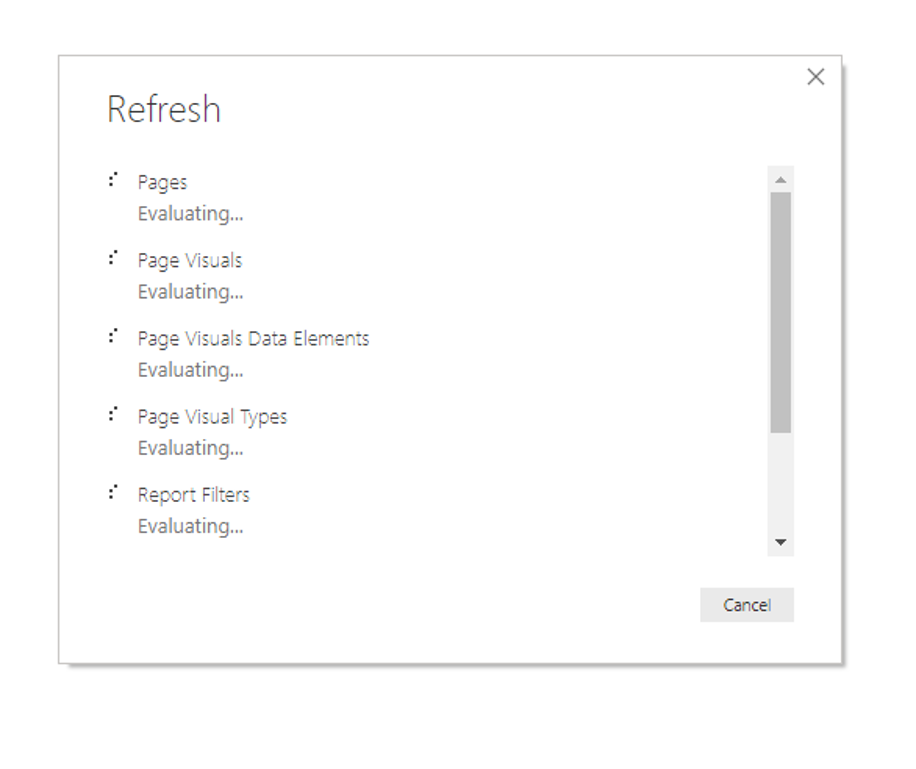
2. After the file opens, you’ll be prompted to enter a value for the input parameter. This is the complete file path and name of the pbix file you’d like to analyze. (thanks to Marco Russo, you no longer need to have your source file unzipped!)
3. Click the Load button. The file will start importing the layout information for your file.
Field Finder Contents
4. After loading the information, you’ll see four tabs.
The first tab (Instructions) provides basic information and instructions.
The second tab (Columns and Measures) provides an overview of all pages of your report
The third tab (Page Details) provides more detail on each page of your report
The fourth tab (Helpful Resources) includes links of blog posts I used to make the tool
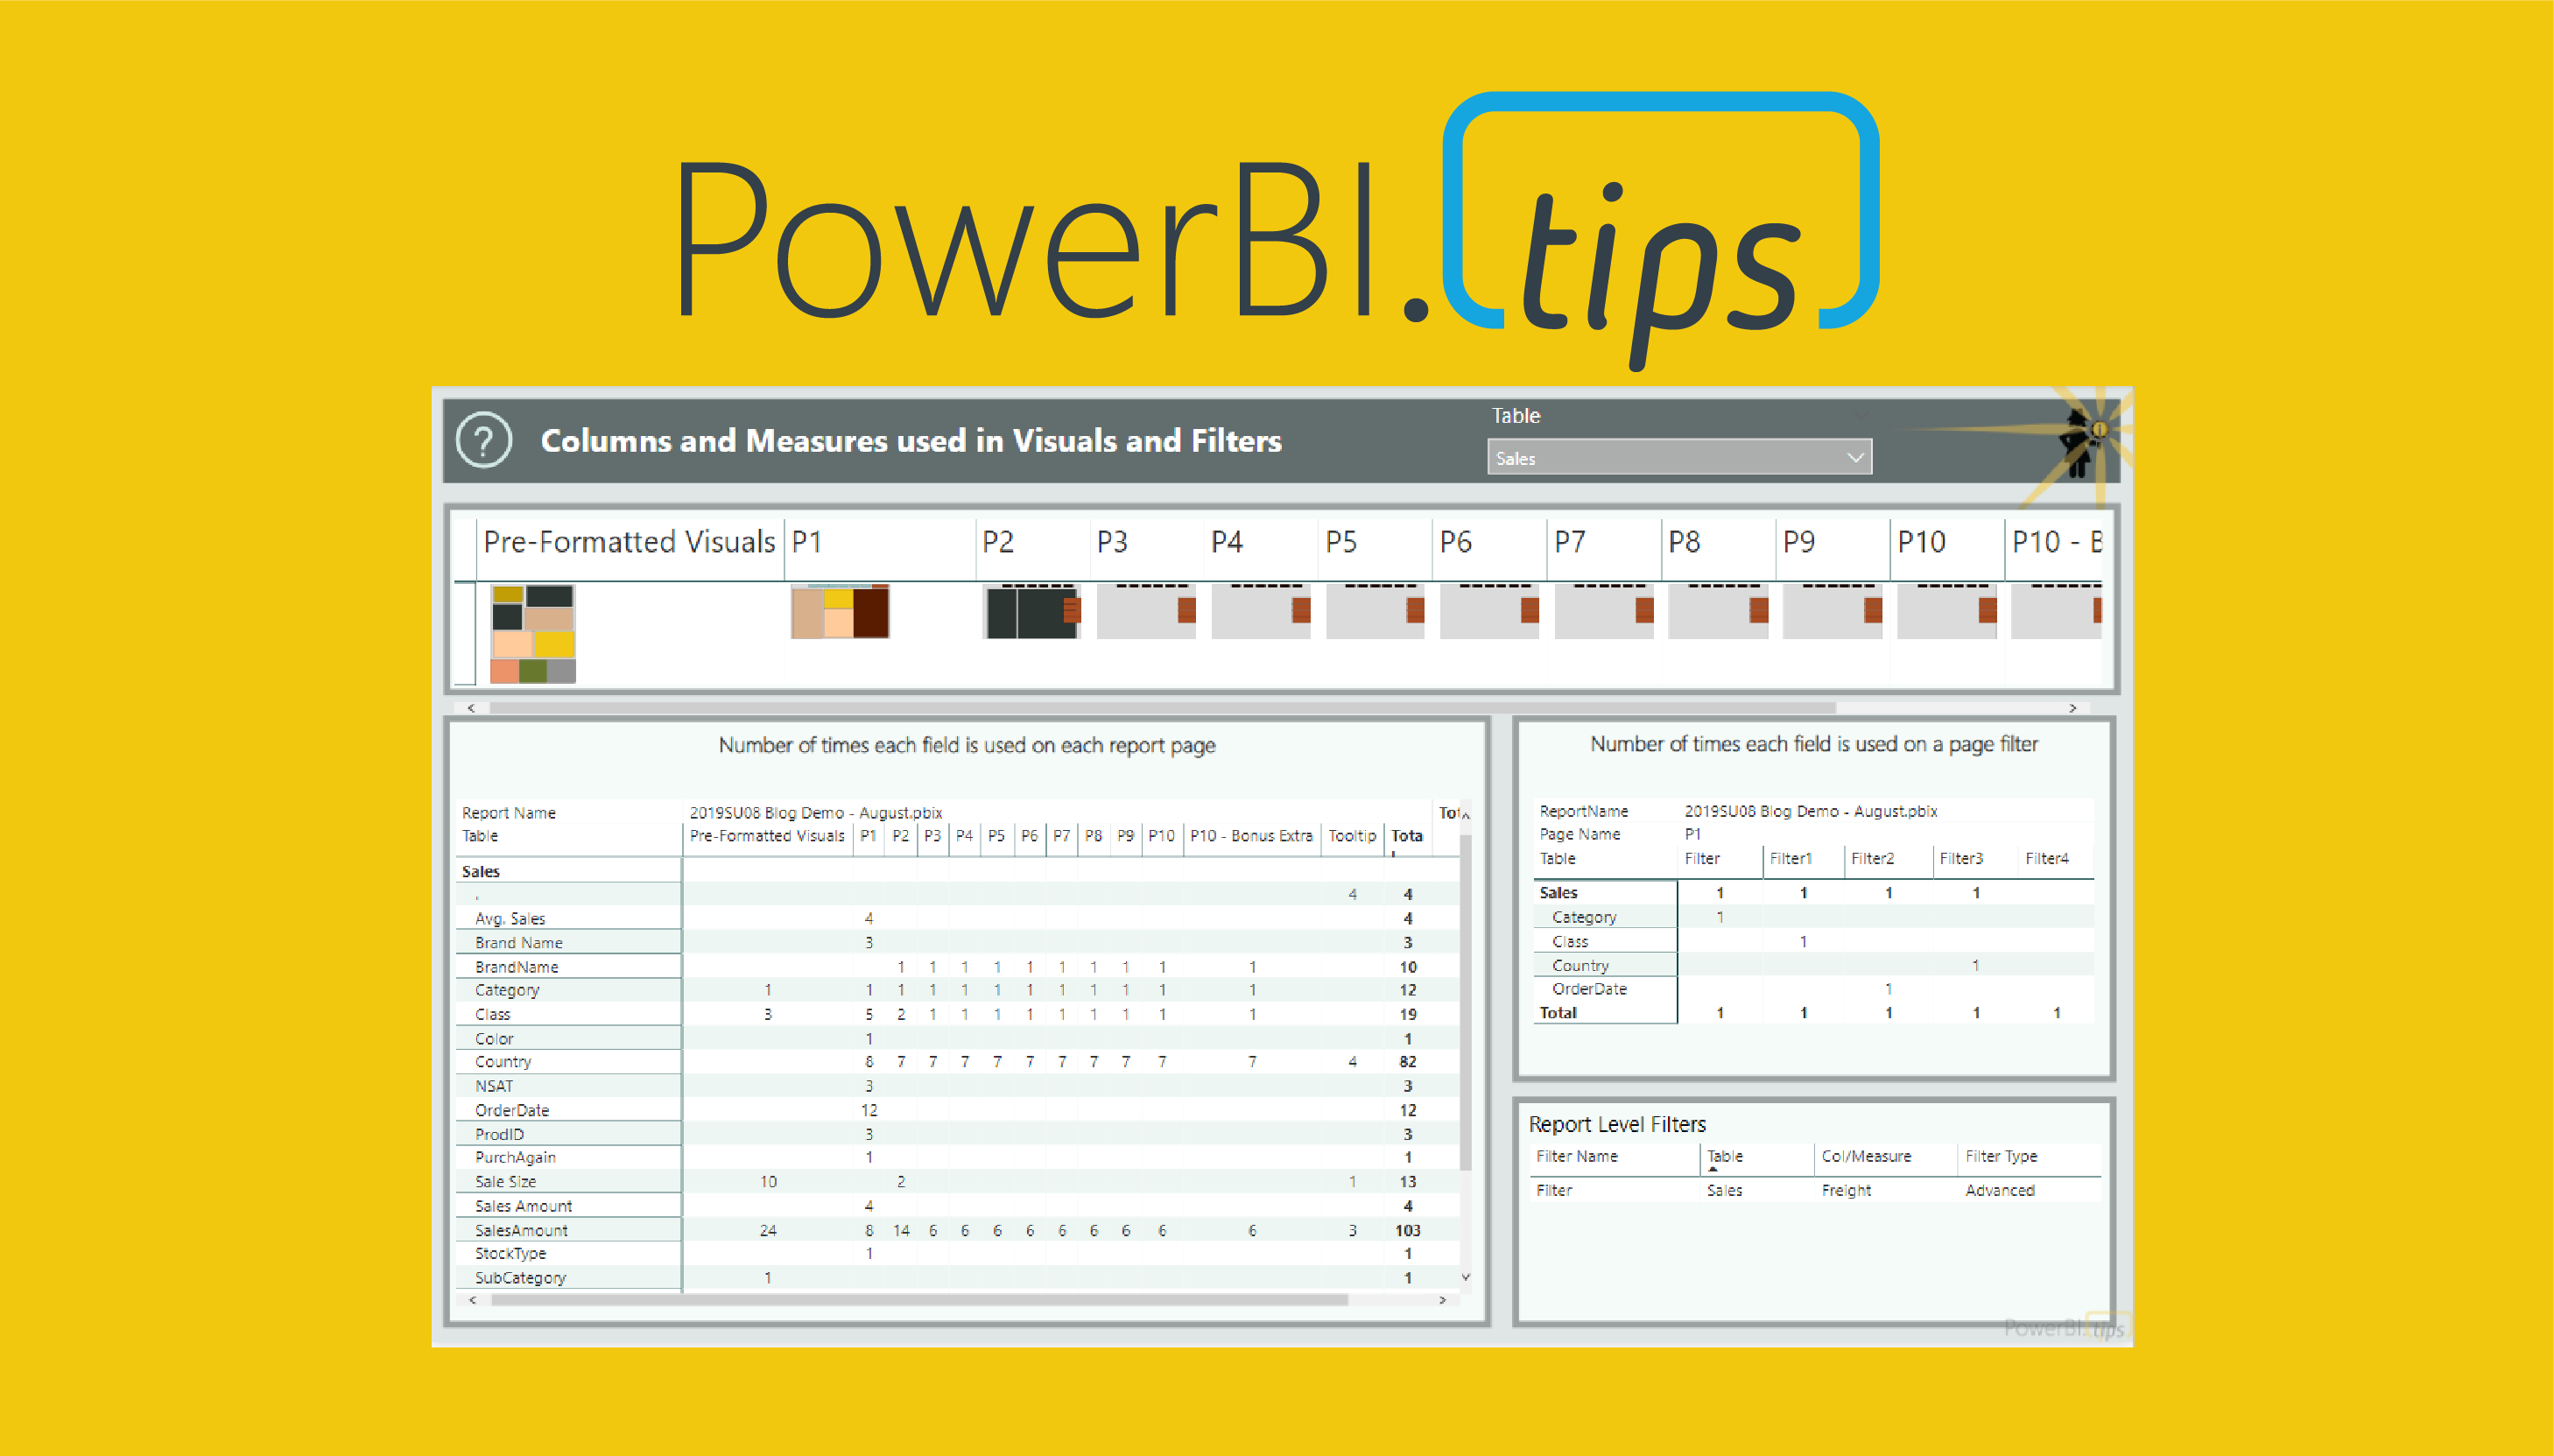
Columns and Measures
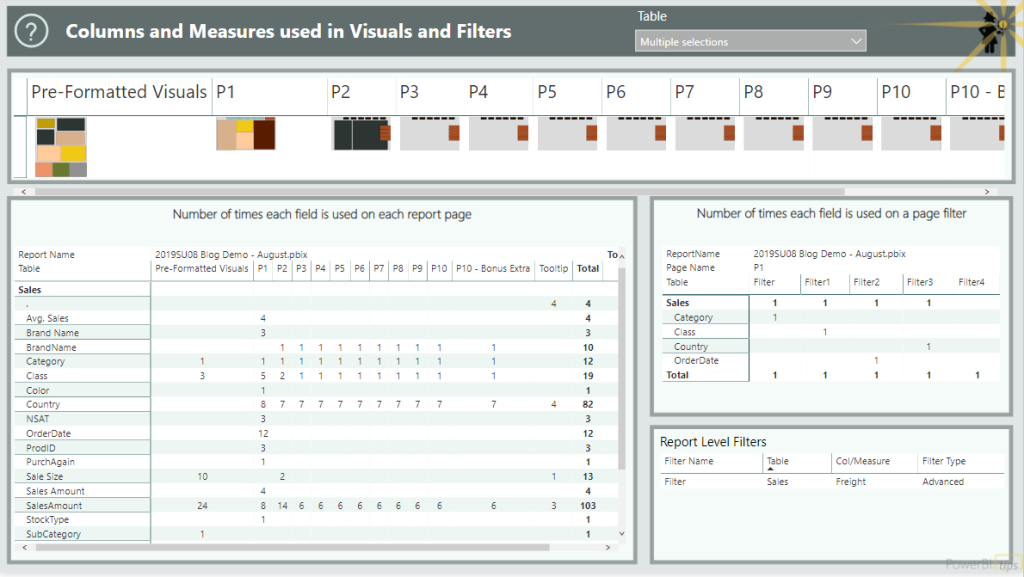
5. Let’s look at the Columns and Measures tab
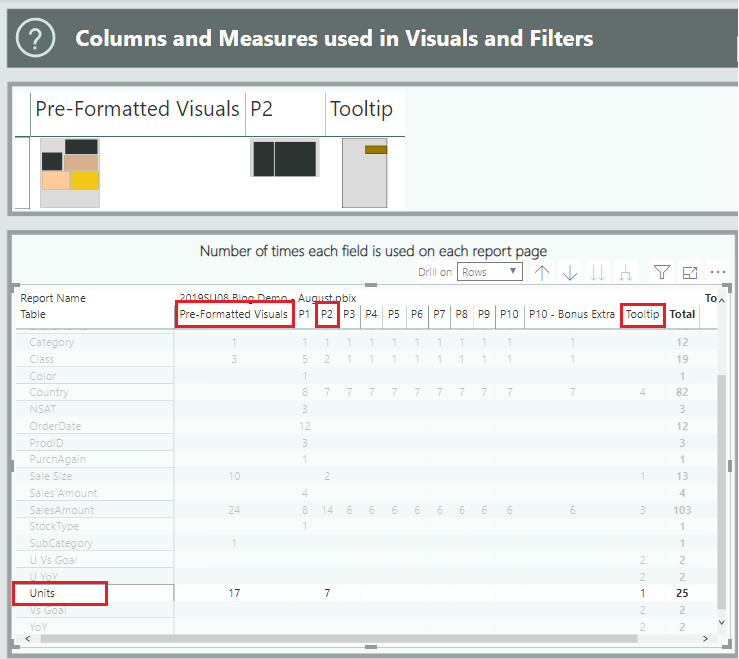
On this tab, you get a thumbnail along the top of each of the pages in your report. The types of visuals are color coded and the name of the page is above the thumbnail. The table on the bottom left gives you the number of times each column or measure is used on each page of the report. On the right you will see the page level and report level filters using columns and measures. Clicking on the thumbnail of a page will filter the tables below to show you exactly which elements are used on that page. Similarly, by clicking on a column or measure name values in the tables will cross-filter the thumbnails above. This lets you quickly see which pages it’s used on. For example, clickingUnits from the Sales table in the bottom left shows that it’s used in the Pre-Formatted Visuals, P2, and Tooltip pages. The thumbnails cross-filter to just those pages.
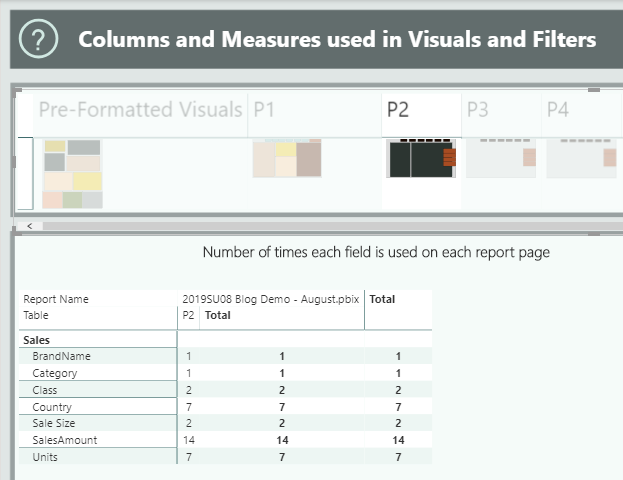
Or, clicking on just thumbnail for P2, you can see which columns and measures are used on the entire page.
Page Details
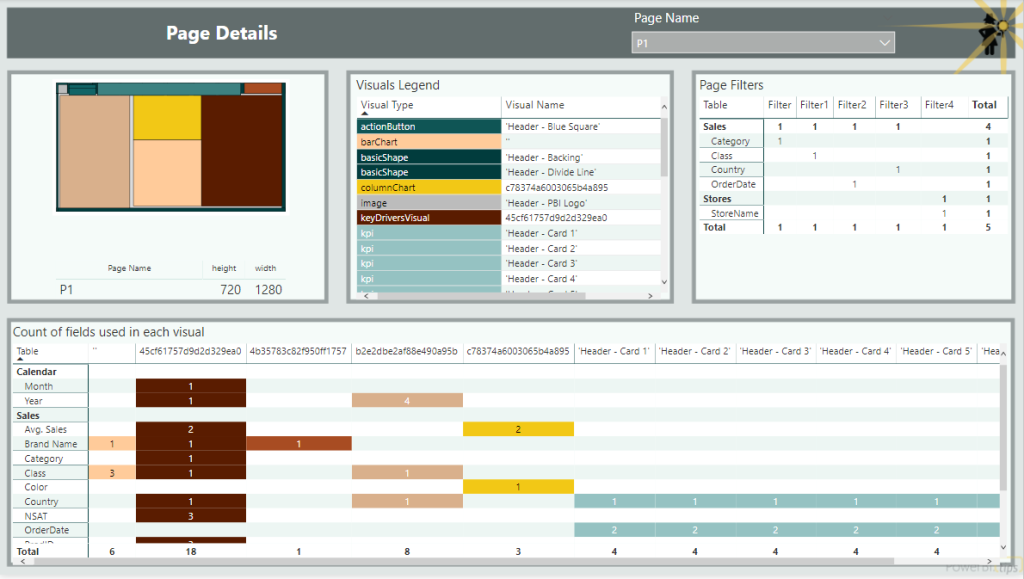
6. For more detail on a specific page, click on the “Page Details” tab.
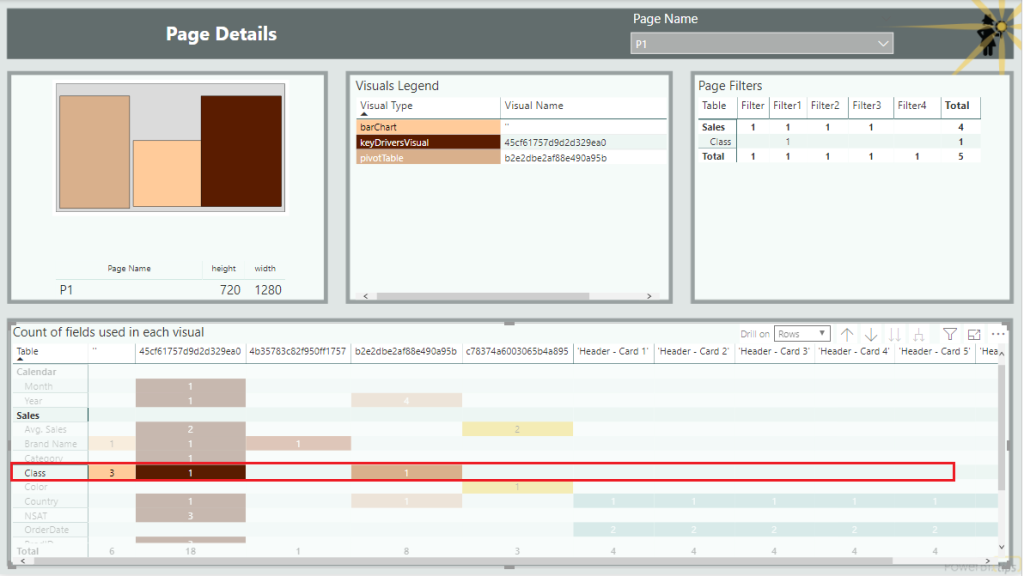
The Page Details tab provides a bigger image of the visuals on the page, and includes more details on the types of visuals and what they’re using. You can select one of your pages with the slicer on the left. The Visuals Legend provides a color code of the type of visual used and the name of the visual. If you haven’t updated the name of your visual in the Selection Pane of your pbix file, you’ll get one of these long strings for the visual name that isn’t very helpful. In addition, you will also see the list of all the columns and measures used in the visuals as well as any page level filters. For example, by clicking on Class in the table in the bottom right, can see at a glance where it’s used on the page. The image of the page also makes it easy for me to go to my pbix file and find exactly which visuals it’s used on.
7. If you make changes to your source pbix file, just save it and then refresh the Field Finder to get your updates.
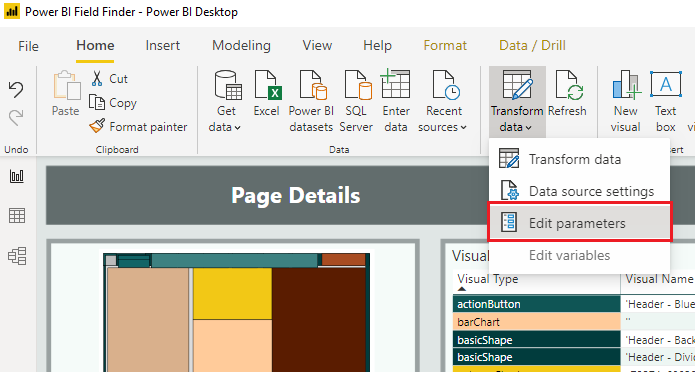
8. If you want to examine a different pbix file, all you need to do is change the parameter for the file name and path. To do that, go to Transform data – Edit parameters and enter the path and name of the next file you want to look at.
I hope you find the Field Finder useful. Please let me know if you have any
suggestions for future versions.
Many thanks to Seth and Mike of powerbi.tips for creating
the improved visual layout of the Field Finder!
This month we did a webinar with the Microsoft team on how to build different custom visuals in Charts.PowerBI.Tips a version of Charticulator.
If you haven’t seen Charts.PowerBI.Tips this video explains the program, all the functions of each button and building demos. We walk through all the buttons on the tool bar and what they do. Finally we build multiple different charts. Check out this webinar if your curious about building custom visuals with no code.
I want to give a super big thank you to the Microsoft team especially Kelly Kaye for making this video happen.
Thanks for watching and have a Wonderful Day!
If you like the content from PowerBI.Tips please follow us on all the social outlets. Stay up to date on all the latest features and free tutorials. Subscribe to our YouTube Channel. Or follow us on the social channels, Twitter and LinkedIn where we will post all the announcements for new tutorials and content.
Introducing our PowerBI.tips SWAG store. Check out all the fun PowerBI.tips clothing and products:
This article examines using the advanced editor in Power Query to better handle when things go wrong. It will also allow custom actions to be triggered using Power Automate, allowing the rest of the data to be refreshed while alerting the owner by email of data source errors.
Note that this article requires edit Power Query (M) code. If you want to review this, consider reading this article: Query Editor – Editing M Code
Data Sources
Data can be messy. Thankfully, Power Query has given us an
excellent and efficient way to extract, transform and load the data to
manipulate it to the way we want it. It is extremely versatile and can connect
to a huge host of data sources. These can include third party sources as well
as internal data.
While beneficial, we need to ask what happens if the third-party source suddenly shuts down or changes its access policies. What if there is bad data recorded in the on-premise excel sheet or databases? An error in any Power Query step can stop the entire report refreshing. We can opt to receive alerts on the service, but these can be unspecific and require us to dig deep into the report.
The technique laid out here allows to receive a specific alert of the exact step the error occurred. What’s more, we can ensure it won’t break our queries and continue to refresh the rest of the data.
Step 1 – Base Query
First we need to set up the query that we want to error handle. For this example, I’m going to send a web request to get some information about the Microsoft stock price. For more information on this API or to pull other stock data, check out this article.
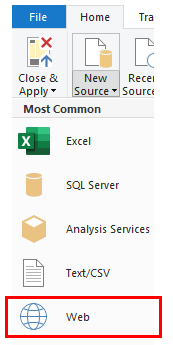
Open Power Query and Select the New Source > Web on the Home ribbon.
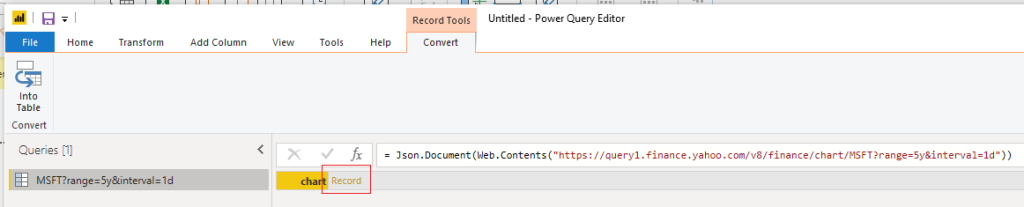
This will automatically return a JSON object and parse it for us.
Note: This link returns 5 years of daily daily historical stock price.
For simplicity, I will just return the meta data to ensure the API call is working. The automatic parsing will return a table with clickable elements. To explore into the JSON we, click through the following steps:
chart:Record > result:list > Record > Meta:Record
Note: See sample of nested structure below for chart:Record
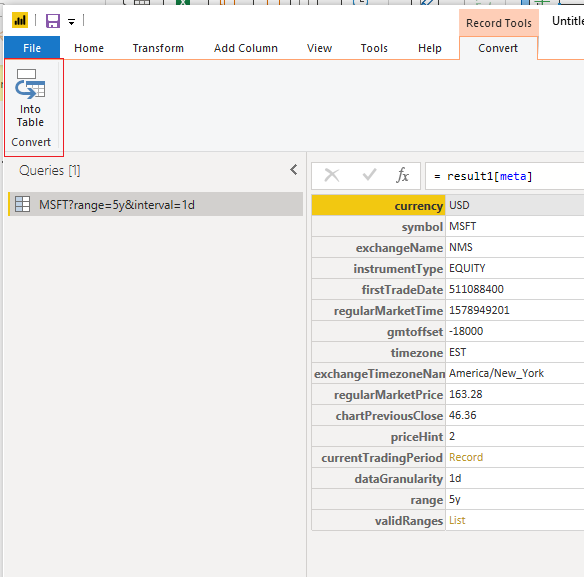
Once we have expanded all the way down to the Meta level, Press the Convert Into Table Button found on the newly appeared Convert ribbon.
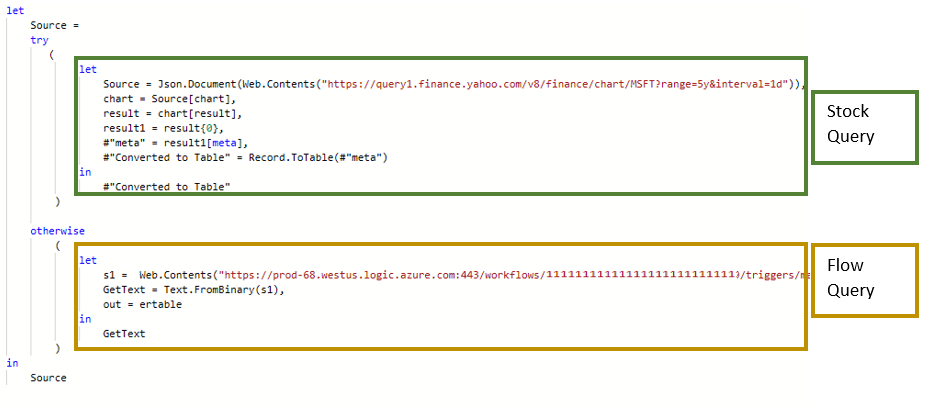
Here is the final code, which you can see by Clicking the Advanced Editor button on the Home ribbon revealingthe advanced editor:
let
    Source = Json.Document(Web.Contents("https://query1.finance.yahoo.com/v8/finance/chart/MSFT?range=5y&interval=1d")),
    chart = Source[chart],
    result = chart[result],
    result1 = result{0},
    #"meta" = result1[meta],
    #"Converted to Table" = Record.ToTable(#"meta")
in
    #"Converted to Table
Rename this “Stock Query” by editing the name in the properties pane on the right.
Step 2 – Create the flow
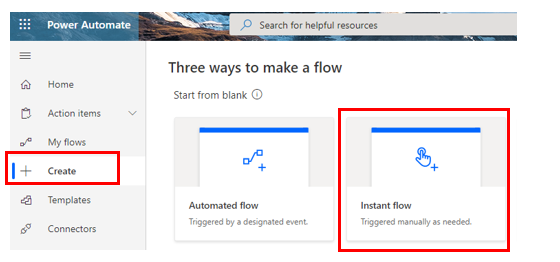
Next we create the Power Automate flow that will alert us something is wrong. Navigate to the Power Automate website. Once logged in, Click on the new Instant flow button.
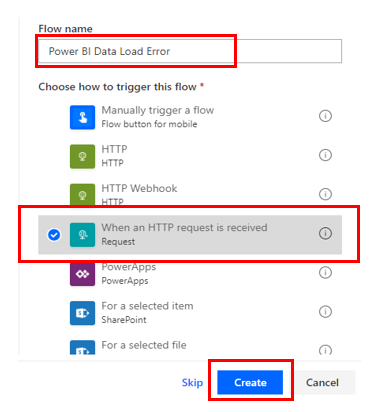
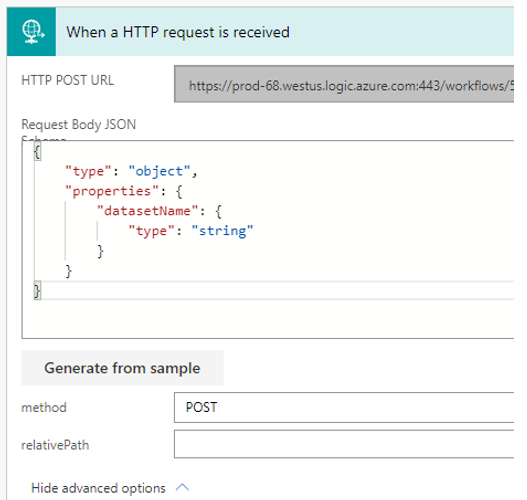
Give the flow an appropriate name. For the trigger, select the option When an HTTP request is received. Next press thebutton Create to make the flow.
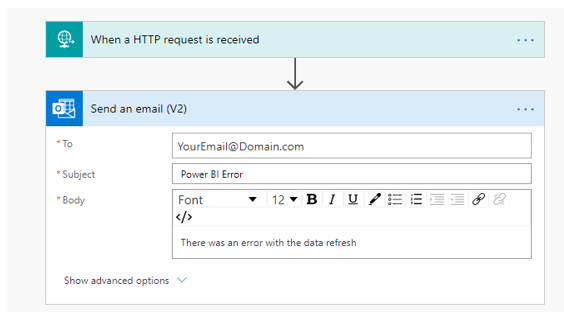
Once we save the flow will supply us with a URL. This URL will trigger the flow any time it is visited. You can use any action you want, but I will have the flow send me an email to let me know the refresh failed.
I’ll search for the item Send an email (V2). Make sure you fill in the email address you want to send it to, and write an appropriate message and subject.
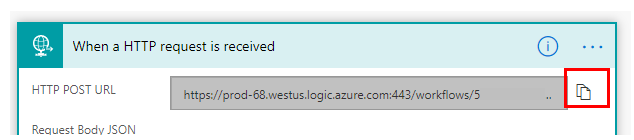
That’s our flow! Hit Save. After you have saved, click on the When a HTTP request is received step to expand it. You’ll see that a URL has been generated. Copy the link using the Copy button on the right. You’ll need this to enter it into Power BI.
Step 3 – Make the Flow Trigger Query
Next, set up the query in Power BI to call this flow. In Power Query, make a new query by selecting New Source > Web. Paste in the Web URL you copied in the previous step. Open the advanced editor. Inside you see the code uses the Web.Contents() function. You’ll need to copy this code in a later step.
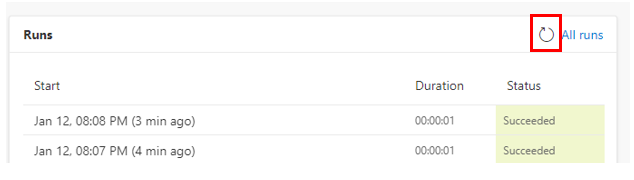
This will send an email as it runs the query. For testing, if you press the Refresh Preview icon, you can trigger the actions to run again. If you don’t want to wait for the email or chose a different action, you can check if the flow ran by checking it on the power automate site. Click My Flows on the left, open the flow and scroll down to Runs. Press the refresh button on the runs section to check when the flow ran.
Step 4 – Set up the Error Handling Code
Now we need to add the logic to have the Power Automate run
on error, which is going to take a little coding.
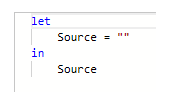
Back in Power Query, start by adding a blank query by clicking New Source > Blank Query on the Home Ribbon. Next, open the Advanced Editor and the code should look like this:
Now we will employ the try … otherwise statement. This is Power Query’s error handing statement. We can add a placeholder for now. Replace the step:
Source = ""
with the following code:
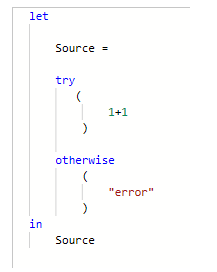
Source = try 1+1 otherwise “error”
How this works
Any code between the try and otherwise keywords will be attempted to be executed. If this is successful, the result will be returned and the next step will be evaluated, in this case the number 2. If this returns an error, however, the result will be discarded and the query after the word otherwise will be returned, in this case the word “error” .
We can add this statement as the Source step. I’ll also wrap both statements in parenthesis as this will come in handy as we add more steps. It’s important to keep good syntax to make it readable, so here is my code:
As 1+1 is
valid, this will return the value 2. If you change the 1+1 to 1+“A”, this is not valid so it will return the word error.
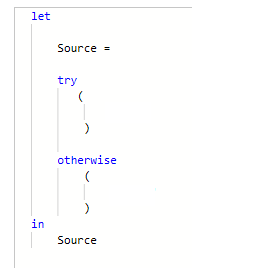
Now we can see its working, delete everything between the parenthesis in both the try and otherwise statement to set up for the next step. Do not worry if you get an error as we will be adding code to it.
Step 5 – Update the Error Handling Code
Now we’ve got the placeholder set up we can copy our previous code into each step. Open the Stock Query we made in steps 1 and 2. Click Advanced Editor and copy the entire code. Now, come back to the try..otherwise query. Open the advanced editor in this step and make sure you delete anything between the parenthesis in the try statement if you did not before. Paste the entire code you just copied.
Next, go to the Flow Error Query, open the advanced editor and copy all the text. Go back to the try..otherwise and paste everything between the two parenthesis for the otherwise statement.
Step 6 – Tidying the Code Up
The URLs are prone to change so it is code practice to separate them as a variable. To do this, you can simply state them at the beginning of the query as a step. Here, add the URLs to variables called WebURL and FlowURL. To add WebURL, at the beginning of query after the let keyword, add the line:
Don’t forget the comma at the end. Do the same with the FlowURL. Then, replace the URLs with the variable name.
Additionally, it will help to change the word Source outside the try..otherwise to Output. This makes it easier to follow, as we have several steps called source. Also update it after the keyword in.
Output:
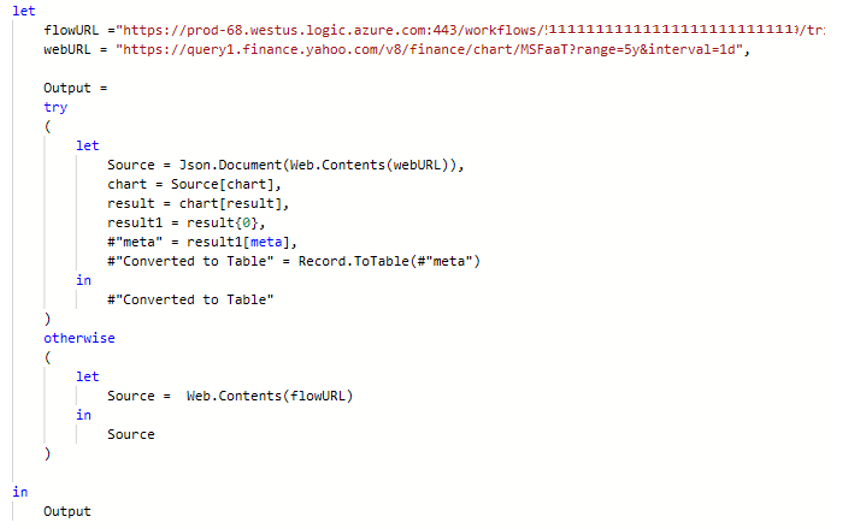
Final code to copy (you will need to update to your correct URLS):
let
    flowURL ="https://prod-68.westus.logic.azure.com:443/workflows/ RestofURL",
    webURL = "https://query1.finance.yahoo.com/v8/finance/chart/MSFaaT?range=5y&interval=1d",

    Output =
    try
    (
        let
            Source = Json.Document(Web.Contents(webURL)),
            chart = Source[chart],
            result = chart[result],
            result1 = result{0},
            #"meta" = result1[meta],
            #"Converted to Table" = Record.ToTable(#"meta")
        in
            #"Converted to Table"
    )
    otherwise
    (
        let
            Source =  Web.Contents(flowURL)
        in
            Source
    )

in
    Output
Optional Step 7.1 – Adding POST Parameter – Flow
Now we have set up our workflow, it may be useful to reuse this on multiple datasets. Instead of setting up a different flow for each dataset, we can allow the flow to accept inputs, such as the dataset name.
Navigate back to Power Automate site and on the flow set up previously, click edit.
Open the step and paste in the following code into Request body JSON.
Next, expand advanced options and change it to POST.
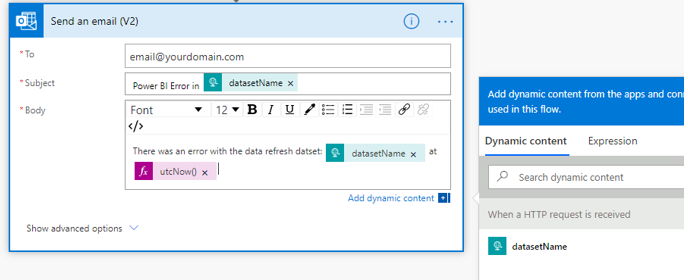
This will create a variable called datasetName. This is the name of the dataset we will pass from Power BI. We can use datasetName in the email to inform us which dataset had an error. The variable will appear in a list when you click to edit the email message – click on the name to add it.
In addition, I added the expression utcNow(). You can find this by searching in the Expression tab of the pop up. This just displays the time it is sent. Thus we can see in the email when it failed. Notice the variable from the first step is green, while the expression is pink. Personalize this message as you wish.
Optional Step 7.2 – Adding POST Parameter – Power BI
The final step is to pass this in from Power BI. In our query, open the advanced editor and add three more parameters before webURL and flowURL:
dataset name is the name of the datset we pass into the flow
and ultimately appear in the email. Right now it’s set to Stock Query, but this
is what we can edit for each dataset we use this query to pass a different name.
content and headers build the correct format to pass into
the API call. This will create a POST request and provide the correct format.
Now we can edit the Web.Contents(webURL) step to include our parameters:
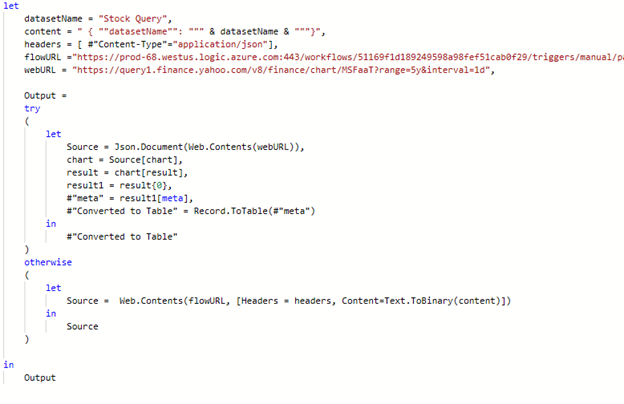
Final code to copy (you will need to update to your correct URLS):
let
    datasetName = "Stock Query",
    content = " { ""datasetName"": """ & datasetName & """}",
    headers = [ #"Content-Type"="application/json"],
flowURL ="https://prod-68.westus.logic.azure.com:443/workflows/RestofURL",
webURL = "https://query1.finance.yahoo.com/v8/finance/chart/MSFaaT?range=5y&interval=1d",
Output =
try
(
let
Source = Json.Document(Web.Contents(webURL)),
chart = Source[chart],
result = chart[result],
result1 = result{0},
#"meta" = result1[meta],
#"Converted to Table" = Record.ToTable(#"meta")
in
#"Converted to Table"
)
otherwise
(
let
Source = Web.Contents(flowURL, [Headers = headers, Content=Text.ToBinary(content)])
in
Source
)
in
Output
Limitations and Considerations
This technique uses premium Power Automate features and a valid license is required. However, only one service account license is needed.
This query has been designed to return blank data if the query fails. This could break your model if this data is required.
This blog does not examine securing the Power Automate endpoint, so be aware if the URL was discovered people could execute the end action (in this case sending an email).
If you like the content from PowerBI.Tips please follow us on all the social outlets to stay up to date on all the latest features and free tutorials. Subscribe to our YouTube Channel. Or follow us on the social channels, Twitter and LinkedIn where we will post all the announcements for new tutorials and content.
Introducing our PowerBI.tips SWAG store. Check out all the fun PowerBI.tips clothing and products:
KPIs are a key visualization type used to convey high level metrics to the end users. They provide an at-a-glance metric that allows business users to know whether they are on track or off-track. Over the course of time that single metric number has been enhanced to include lines to showcase trends, date stamps, variance and many other metrics to convey key metrics in a compact and concise way. There are a number of different takes on what a KPI can or should look like. If you would like to take a look at all the different KPI visuals you can download from AppSource you can find those here there.
I’ve used several of the visuals from AppSource before, and
what I would recommend is that you always verify that the visual has the blue “Certified”
label if you plan on just using it. That means that the custom visual has met
certain code and verification criteria and the visual is not accessing or using
external resources. That is not to say that you can’t use the other visuals,
but I would recommend looking at them closer and potentially reaching out to the
owner of the custom visual to see if there are any extraction or third party
interactions that would not be acceptable risk for your company.
That being said, one of the great things about having custom visuals is that they typically offer more enhanced visual options or settings that you cannot find in the default visual set in Power BI. KPIs have been one of those visuals that needed a bit more enhancement. I’m happy to say in the latest December release of the Desktop it received it. If you’ve been looking elsewhere for your KPI visual, it might be high time to give the latest default version a little bit of a test run as it offers some of the key features that are plenty enough for me.
Basic Updates
Prior to the December update the KPI visual was a bit standard. An example of what that looks like is here.
However, if you look at the below example of the new one, there have been several key updates that pop this KPI now by default and extend it to make it look more pleasing. The first change is obvious, the Font is DIN and brings a bold pop to the overall number. We’re off to a good start! We can also now change the Font family of the larger metric which will allow us to mirror the overall fonts we’ve selected within our other visuals.
The Indicator and Goal properties have received the most prominent updates, but there are also some key changes that allow us to now set the font colors both statically and conditionally.
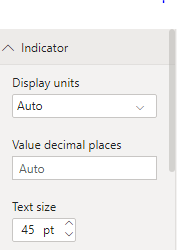
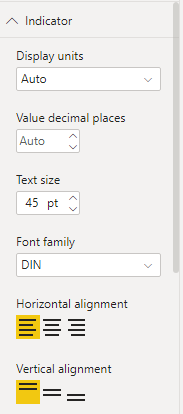
Indicator Properties
Let’s see how these changes impact things overall. First, lets take a look at the Indicator. The options went from this:
To this:
What does that do for our KPI? Aside from what we outlined above, it gives us a simple two click option to adjust where we want the number (Top & Left), which makes our trend seem a bit more trendy?
Another option we now have is to increase or decrease the transparency of the trend.
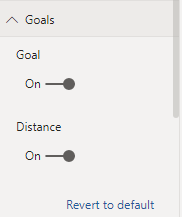
Goal Properties
The second property area that received a bunch of changes is the Goals area. That looked like this:
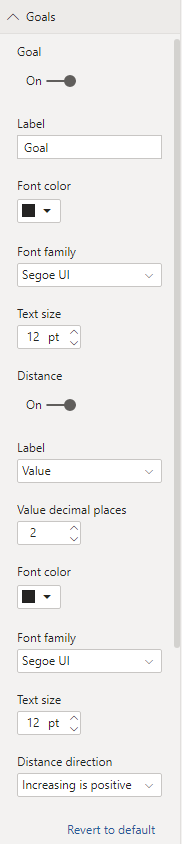
While the new properties pane looks like this:
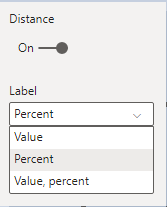
This change is almost like the difference between the Edison bamboo filament light bulb and the latest LED that lets you pick between millions of colors… Ok, maybe that’s a bit extreme, but you get the point. This property is now extremely useful. Note: the Goal label name can be changed and the metric returned for the distance value can be updated to show the percentage, value or both.
The color and font family for both Goal and Distance are updateable
now as well along with a new property for the Distance direction.
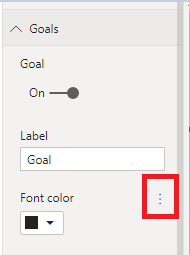
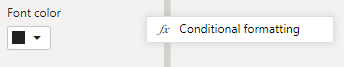
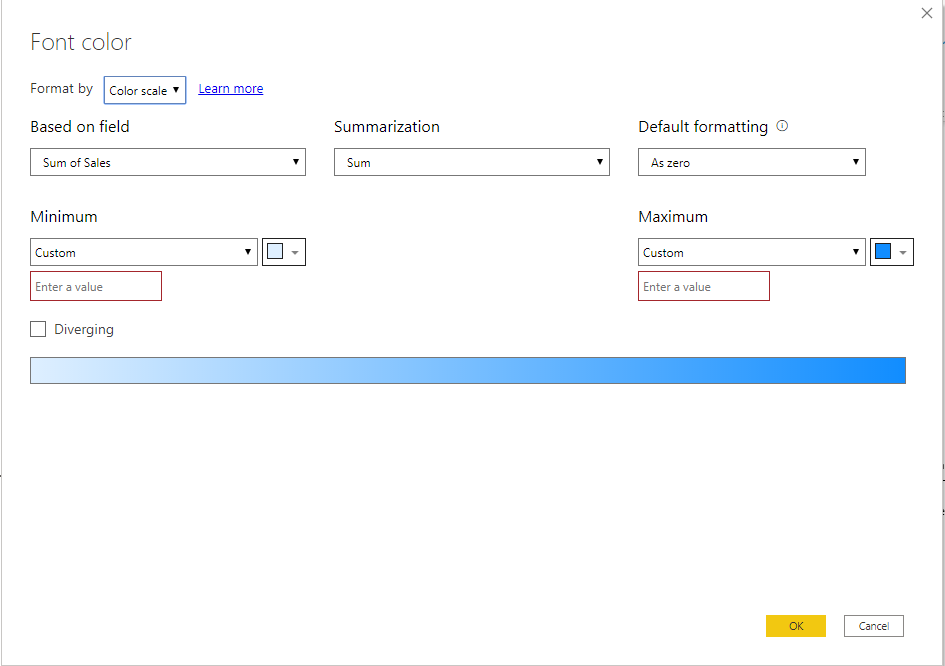
Conditional Formatting
One of the “hidden” things to be aware of is that the above screen shots are the default view of all properties. To see if you can use a conditional setting you need to hover the mouse over the Font color area. Doing so will illuminate the “…”
Clicking that gives us :
And one more click opens the dialogue where we can set our conditions.
One final key property is the addition of the top level “Date” property. This is a great addition in that it takes away any doubt about what the current KPI context is without having to look at filters.
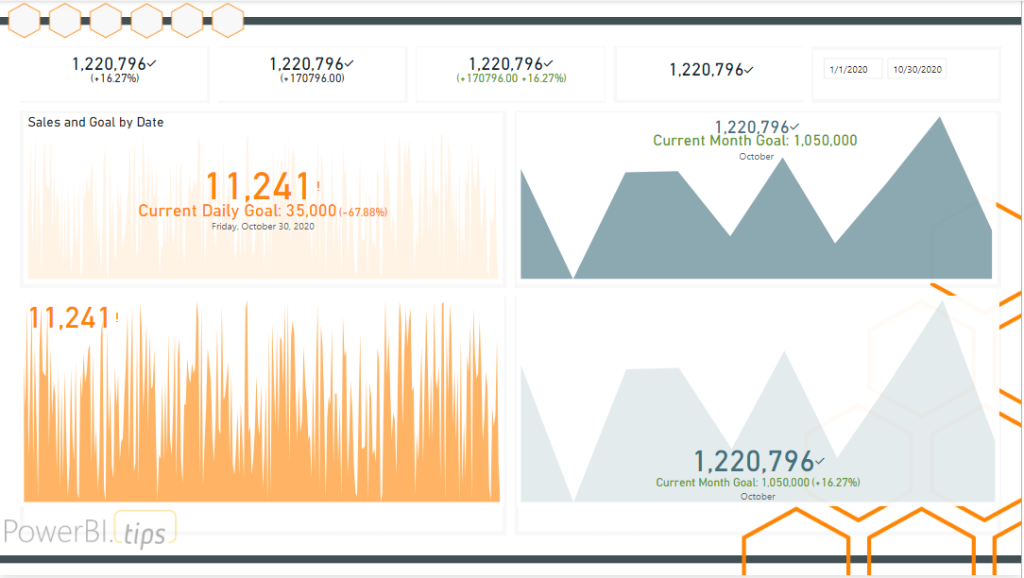
Showcase
Utilizing all the capabilities now given, we can create a series of KPIs that carry the vast majority of all our needs in the out of the box visual. Below is just an example of a bunch of different ways to format the KPI visual. The goal here is to show how many different ways we can see these metrics using the same KPI visual now that we have all these new properties at our disposal.
Sometimes the features we want to have added to visuals in Power BI aren’t being worked on. It isn’t for lack of effort on the Power BI team, believe me. But there are only a finite number of resources, and a backlog a mile long. Check out ideas.powerbi.com to see all the ideas being requested. I believe that is why they opened up a program to work with Power BI experts to engage with the Power BI team directly. These KPI features are a result of that program. The individual we can all shower with our thanks is James Dales. You can check out what James is up to on his blog – https://powerbi.jamesdales.com/, and be sure to hit him up on twitter and offer up a bit of thanks – @jamesdales
If you like the content from PowerBI.Tips, please follow us on all the social outlets to stay up to date on all the latest features and free tutorials. Subscribe to our YouTube Channel, and follow us on Twitter where we will post all the announcements for new tutorials and content. Alternatively, you can catch us on LinkedIn (Seth) LinkedIn (Mike) where we will post all the announcements for new tutorials and content.
As always, you’ll find the coolest PowerBI.tips SWAG in our store. Check out all the fun PowerBI.tips clothing and products:
Manage Consent
To provide the best experiences, we use technologies like cookies to store and/or access device information. Consenting to these technologies will allow us to process data such as browsing behavior or unique IDs on this site. Not consenting or withdrawing consent, may adversely affect certain features and functions.
Functional
Always active
The technical storage or access is strictly necessary for the legitimate purpose of enabling the use of a specific service explicitly requested by the subscriber or user, or for the sole purpose of carrying out the transmission of a communication over an electronic communications network.
Preferences
The technical storage or access is necessary for the legitimate purpose of storing preferences that are not requested by the subscriber or user.
Statistics
The technical storage or access that is used exclusively for statistical purposes.The technical storage or access that is used exclusively for anonymous statistical purposes. Without a subpoena, voluntary compliance on the part of your Internet Service Provider, or additional records from a third party, information stored or retrieved for this purpose alone cannot usually be used to identify you.
Marketing
The technical storage or access is required to create user profiles to send advertising, or to track the user on a website or across several websites for similar marketing purposes.