Requirements for Semantic Models – Ep. 288
This episode is built around a Tabular Editor article on gathering requirements for semantic models—and the conversation is basically a reminder that modeling is an engineering discipline, not an art project. If you don’t document definitions, grain, and constraints up front, you’ll ship something that looks right… until the first stakeholder asks a ‘simple’ question and the model falls apart.
Mike, Tommy, and Seth walk through the kinds of questions that prevent rework: what decisions the business is trying to make, which measures are non‑negotiable, and where security/refresh/performance requirements will force tradeoffs.
News & Announcements
-
Gather Requirements for Semantic Models (Tabular Editor blog) — The reference article for this episode: a clear, end-to-end checklist covering stakeholders, definitions, grain, security, refresh, and delivery expectations.
-
Power BI Theme Generator (Tips+) — A quick way to standardize report styling (colors, fonts, and visual defaults) so teams stop reinventing branding on every report.
Main Discussion
The big idea: semantic models don’t fail because DAX is hard—they fail because the requirements were vague. The team talks through what to clarify up front so the model is useful, trustworthy, and maintainable.
Key takeaways:
- Start with the decision: what questions must this model answer, and who is accountable for the definitions?
- Lock down business definitions early (measures, inclusion/exclusion rules, and edge cases—especially anything time-based).
- Confirm the grain and time expectations (calendar vs. fiscal, snapshots vs. transactions, and what ‘as-of’ means).
- Identify the authoritative sources and transformation boundaries (what belongs in ingestion/Lakehouse vs. the semantic layer).
- Treat security as a requirement, not a bolt-on (RLS, sensitivity, and who should never see certain slices).
- Make refresh/latency explicit (what’s acceptable, what breaks when refresh fails, and how users will notice).
- Define ‘done’ with validation + performance targets (reconciliation checks, response-time goals, and a change request process).
Looking Forward
A little time spent up front on requirements usually saves you weeks of rework later—especially once the model becomes shared infrastructure.
Episode Transcript
0:28 [Music] n n welcome back to the explicit measures podcast with Tommy Seth and Mike good morning everyone welcome back good good morning let’s give you a quick round out of our main topic today today our topic is an article made by probably one of our favorite external tools I this is this is high on my list made by tabular editor written by Kurt ber I think everything we’re talking about now is written by
0:58 we’re talking about now is written by Kurt these days I don’t think we talking about anything else that Kurt doesn’t write he’s a busy struck Accord with us so Kurt has written another article around Gathering requirements for semantic models talking about that so that’ll be our main topic for today I think it’s very relevant especially when you’re a business user and you’re trying to move into more of a data modeler role or experience these are important to understand what’s going on here so I like this is going to be a good article looking forward to talking through that
1:29 looking forward to talking through that but first let’s go through some news Tommy do you have any news articles anything across the internet that you found was interesting so Gil I can never say his last name but foru actually just came yeah just actually came out earlier today and he basically went through this process of trying to compare data flows gen two versus no books on cost and usability yes and yeah something we’ve talked about a lot and
2:00 something we’ve talked about a lot and basically looking at the F2 capacity in Australia nice basically loaded the same data set was looking at both again like the ease of use of what his transformation is trying to do okay and everything else out so in a nutshell a good question let’s just talk about like that topic in general this is a great question now because previously on older versions of powerbi. com we didn’t have multiple ways to move the same data around we only had data flows
2:31 same data around we only had data flows it was one option we only had you could use a data flow or you could use the semantic model power query to load a table this is a whole new world for us because we have data flows Gen 2 and we can place data in our Lakehouse and we can use pipelines and we can use notebooks all of these things can write data to the same location so this is very interesting I like this is good because I want to be able to see like comparatively how much does it cost me what’s what is the impact of doing the same amount of data crunching this is
3:01 same amount of data crunching this is great I like this okay cool sorry I didn’t I want to get some context there yeah yeah yeah yeah I’m sure the jury is still out but just looking at the cost of doing the cost per calculation what she was basically saying was 42 cents an hour for the fabric capacity for how much time it took them say the index ranged about 0. 98 for second I believe that was or yeah so about almost a penny a second MH so the and
3:35 almost a penny a second MH so the and then he was talking about bursting cost that was an additional side for one notes that wasn’t part of just the normal like when you’re looking the usage it’s not just that one thing so then there’s bursting capacities so compared to data flows because at the end of the day you have to get down to like what is the cost of a compute unit I think that’s really what we’re talking about here cuz Microsoft change things we were previously we were doing things in Virtual cores it was like VC how many V cores are you using to run
4:05 how many V cores are you using to run the process well now it’s all bundled together in one big network and internet connectivity and compute and storage like there’s a lot of other things that are happening because you’re spinning up a Spark engine you’re spinning up something for data flows it’s more of a compute unit now that you’re consuming so I like this because it roughly rolls out to for an F2 I would calculate like I don’t know for one CU it’s like 5, 000 of a penny or something like
4:35 like 5, 000 of a penny or something like something super small yeah it cost something but the nice the nice part is because then you can go look at your jobs and say okay if that’s my cost per job how many cus can I consume right and then that tells me oh that’s how much it cost me yeah so the big thing that well let me ask you what do you think just from an index point of view what which one was cost more costly costly and by how what percent do you think well I’m going to give you a very I’m going to give you a very weird proxy on
5:05 going to give you a very weird proxy on how I measure these things the time it takes to process the data will always cost more because the longer it takes the more compute you need to use so if you can do a job in data flows it will take less time in if it takes less time in another process like for example you do a data flow it takes a minute if you if you can do it in a pipeline it takes 30 seconds it will cost you less because the pipeline
5:36 will cost you less because the pipeline ran faster so any anytime you can get things to run faster it feels like it’s a good proxy for Less compute now one thing that doesn’t what that doesn’t do is there is this concept of scale out or scaling up things so even though you have less time running on a job in data bricks you can run a really big cluster and it will have many many computers running to do your job and so that could cost more even though it took less time but again as a rough proxy I try and use
6:06 but again as a rough proxy I try and use time so my impression is data flows is always slower than notebooks it has been and people have been talking about it so I would say the notebooks will be faster and less costly so it worked out to be 115% cheaper to use the notebook than the data flow Gen 2 no way that doesn’t surprise me and obviously wow data flow must have a lot of overhead when it runs and again this was I don’t think by no means like a a three-month like cost but sure and then it was looking
6:37 cost but sure and then it was looking at the the cus that were consumed for each of the workloads wow consumed 340 340% less than the data flows okay so and and that makes sense right the cus used for that same data flow to Crunch that data was I think he said like a thousand and then the same cuu used in the spark notebook was 300 which exactly right there you’re looking at ralle a 4ex cost savings just because you this is going to push people to start learning notebooks
7:08 learning notebooks honestly oh yeah so wow yeah basically from those point of views if you obviously don’t know python is a little harder and you and I have had this conversation a lot lately about where yeah it’s a new it’s a new skill set that it’s not easily learned right away you have to study code to make it to be comfortable in a notebook well it’s not just that it’s like you have this whole graphical user interface and it’s always been part of powerbi but I’ve
7:39 been part of powerbi but I’ve been realizing more and more too now that every how everything’s integrating with fabric too there’s a it’s really incredible what a one not book can do it’s just much easier I think in power query if you’re like want see how everything’s looking but this it’s pretty insane just looking at the hourly cost and what he did so the link I’ll I just sent to you yeah there so great article
8:09 to you yeah there so great article highly worth a read and I love the stuff that Gilbert does Gilbert is an amazing writer he’s prolific he he writes he puts out a lot of articles on his on his blog site so he doesn’t do a ton of videos but he does a ton of blog content right and for my understanding Gilbert works on a lot of really large data models like things that are in like close to like the 80 900 gigabyte level size data models so his expertise at working with these really l if he wants to refresh a data set he’s looking
8:39 wants to refresh a data set he’s looking at like a day of refreshing data only it’s like a 24hour exercise to refresh just the data holy smokes that’s a that’s a crazy amount of information going on in there so anyways here’s the article I put it here below looking through foru and talking through data flows Gen 2 notebooks and costs so that is a great article talk that’s a really good find Tommy I’m glad you found this one and brought this up yeah when I wasn’t sleeping this morning because like I said it was it came out today so yeah that’s how you do this all okay so
9:09 yeah that’s how you do this all okay so while I’m resting yes you you are up because you can’t sleep and you’re finding all this cool stuff well I appreciate that Tommy I’m sure everybody in audience does too yeah I I will say
9:20 in audience does too yeah I I will say this too of the experiences that I’m using of fabric I’m liking more and more I’ll say it I like the idea of being able to run Piper lines pipeline seems to be Fairly reliable for me and work pretty pretty smoothly so far in fabric data flows Gen 2 was a little a little bumpy at the beginning but it has gotten a lot better I feel like and the improvements have been smooth and it runs well so recently I’ve been had no problems with data flows Gen 2 the spark notebook experience is awesome I just
9:50 notebook experience is awesome I just wish there would be a bit more if if I think about what power query can do with all the transforms and removing columns a lot of those things can already be done in Python notebooks I already be done in Python notebooks a lot of the transforms are there mean a lot of the transforms are there that you could just do it and when you use data Wrangler you can do a lot of those transforms using a UI right in data Wrangler so I have to imagine it couldn’t be super far of a stretch for you to use like why don’t they let you use like the power Corey experience to build a
10:21 power Corey experience to build a notebook that yeah that should be easy to convert right I don’t know It feels to me like this would be mean it feels to me like this would be something that should be close or hey I’m going to produce a data flow do I want to run it on the regular data flow engine or do I want to translate it into like a spark notebook and have it run there like it there should be some kind there like it there should be some it feels like a lot of the functions of it feels like a lot of the functions and buttons you have could be easily translated into what python could do so anyways that that feels like it should be a thing at some point we’ll see if it actually if it actually gets
10:53 actually if it actually gets there anyways Seth I think you said you had another news article too I don’t have a news article but I do have an announcement oh yeah let’s hear it so for those of for those of you who joined us in our last episode I got a little animated because we’ve been talking a lot about the Microsoft documentation round strategy and planning Etc right loves to do which I love doing right strategy planning and within there there there are some
11:24 within there there there are some definitions that were used in the technical documentation that were causing me cognitive dissonance around okr OG gsms anyway might G might have gone off the handle a little bit I’ll dive more into this in our next episode as we dive into it but suffice to say one of or the owner of that documentation reached out to me yesterday and apparently liked the ideas that I was sharing and already got approval and made fixes in the technical do and I
11:54 made fixes in the technical do and I swear when I look this morning it’s almost all like talking about okrs oh wow several thoughts here okay all right good the squeaky wheel sometimes does get attention when weren’t squeaking I think you were more like yelling at the microphone when come on come on let’s when you have a good argument yeah and then the follow-up to that was actually one that I did want to convey because it it is falls into this realm that I think one of the
12:24 into this realm that I think one of the the biggest elevators in I think anybody’s career but even in mine I always have said it’s Consulting and that was because I thought I had the opportunity to get in and see all of the similar same problems within businesses but I’m also beginning to realize I think it’s because it made me look at those businesses in and care about solving the core problems that they were bringing me into and now taking that further into working for an
12:56 taking that further into working for an organization I think what I wanted to convey is one of the biggest career shifts that I think people can do is figuring out how do you engage in solving the bigger business problems with the work that you can do and don’t be shy about pointing things out or trying to make sense or in in nice gentle ways causing issues that that are things that the organizations need to think and that I think alone sets you apart in just being somebody who
13:27 apart in just being somebody who executes on a job versus somebody who gets put on a career path or good things happen thing or more doors open when you start doing so that being said the guy responsible for this ironically enough and I this wasn’t planned is Kurt ber so if you don’t know Kurt he’s got his own website data goblins Awesome by the way Twitter LinkedIn just Kurt ber we’re talking about another article
13:57 we’re talking about another article today at he wrote on tabular editor but a huge thanks for him not only for listening to the podcast and listening for me listening by rant but reading between the lines and seeing some value there and already making some what I think are fantastic changes to the documentation wow I I’m already seeing it and it’s funny you brought that up because I actually took the liberty of I’m like I wonder how many discrepancies because I’ve been thinking the same thing so I actually I I have a note LM by Google which is basically
14:27 note LM by Google which is basically like document retrieval and I’ve been asking it like hey what discrepencies do you see in these documentation between goals and objectives and it basically outlined where set an objective where is said goal and the definitions I was going to bring that up once I put that more together but it’s already fixed in two days don’t have to I don’t have to well let me let me be clear that’s pretty crazy let be clear I I love the fact that the alignment of the terminology is Al I’m aligning a bit
14:58 terminology is Al I’m aligning a bit more with the ogsm or okrs that makes sense and and having the same language across what you communicate in the adoption road map should match what you see inside the Tactical planning piece I will say regardless of what you call a goal or a goal or a objective what stands true is the concepts of what he’s talking through in the article were 100% spoton yep maybe the terminology was slightly off in our minds but like it’s solid like this is great the fact that Microsoft is
15:29 great the fact that Microsoft is putting out this level of detail and documentation around how to get into powerbi because I think a lot of times organizations look at Power behind say oh it’s just a reporting tool oh it’s just this very high level thing and I think what this is these articles are Illuminating to me is this is a much deeper program it does way more than just build reports it does way more than creating a page report where you can dump data out or send out automated emails of reporting this is a full semantic modeling ecosystem it has full
16:00 semantic modeling ecosystem it has full data engineering capabilities it’s Enterprise grade you can use it for everything in your company why not you should use you should use it for all your data things because it’s it is capable enough to do a lot of big projects anyways really really like this awesome news on that one set that’s pretty cool I have one minor news announcement here and then we’ll jump right into our topic so if you have noticed I believe the powerbi team is beginning to wake back up and what I beginning to wake back up and what by that is yesterday I logged
16:30 mean by that is yesterday I logged into winter hibernation they’re coming out of winter hibernation from the December break there must have been some code laying around at the end of December or maybe some people were working on some things in early January I have noticed two minor updates with powerbi desktop in the month of January so typically we don’t get a big announcement of like here’s new features in January honestly we very rarely get any updates for powerbi in January at all but I’ve seen two come through and the second one just happened on I think
17:00 the second one just happened on I think the 22nd of January where I was I opened parbi desktop and it notified me it said hey there’s a new version of desktop you should go download it so I think they’re doing minor bug fixes and things as well so just be aware if you’re using parb desktop or you’re going to use your desktop open it up check your version go out to the website check the version there on powerbi. com and you may have you may find there’s a couple improvements to desktop I can’t find anything in the code or looking at it don’t see anything Vis visibly different
17:30 don’t see anything Vis visibly different I’m guessing they’re just cleaning up some other things behind the scenes so anyways just wanted to point that out there was two more updates this month and we we’re greatly anticipating a good revision a good update in February so I’m very excited to see February’s update it I get I want I want to I love all the new features coming out it excites me so I’m I’m excited for them to get back into the routine of things so excited excited exced excited
18:00 things so excited excited exced excited about new things it’s a game changer sweet excellent well with that let’s let’s jump over to our main article today so our our main article today is again from the one the only the Kurt bu he is Mr knowledge either Kurt is either really really smart or he really knows how to use chat GPT because he’s producing so much content these days it’s crazy no no I think he’s much more nefarious I think that he’s writing articles all over the place so that we don’t know it’s and we don’t like look at the author first and we’re like man
18:31 at the author first and we’re like man this is another great article this is a completely different website it’s not just data Goin like and then we get into
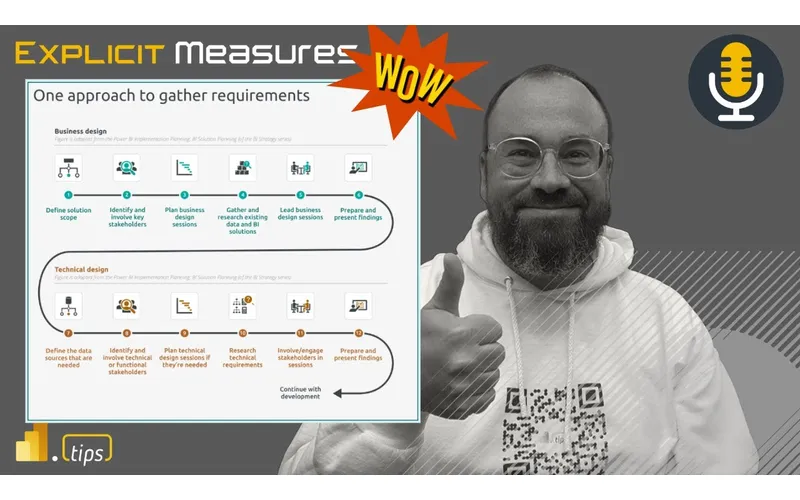
18:37 just data Goin like and then we get into it we’re like wait a minute I agree with that one so this one this one comes from and again appropriately named here right it’s coming from tabal editor this is a great talking point how can you effectively gather requirements what questions should you ask about your data model how do you wireframe things and how can you make one in tabular editor so some really good talking points here let’s jump into the article and react and or get through
19:07 and react and or get through some of this Tommy you want to give us a bit of a a summary or some key points here you want to kick off with inside this article I think it’s first when you think about it it’s really nothing terribly new and I was actually just talking doing a training last week and which is like the fundamentals of data modeling I’m like here’s the crazy thing everything I’m telling you today about a best practice around star schemas and relationships this is going to hold true whether you have five rows or you have
19:38 whether you have five rows or you have 50 million this is not like we’re going to learn some very basic thing but there’s another way to do it better like down the road whenever from when we first start building models we’re already in the right mindset obviously there’s more complex situations but the same idea still applies and and I’ve seen that from my from my own career Journey where working with others Markus is like how’s your data model how’s your data model and it’s following that same structure so getting that right is
20:08 structure so getting that right is probably the skill not so much I think in any in more doing the data model it’s how can we translate whatever the situation is into an effective data model that is where I I think the skill really comes into play in taking your experience but our framework of putting together a semantic model putting together in a in a structure again this is not like going from Power query to python from a we now that we’re more
20:38 python from a we now that we’re more advanced if you use tal editor if you don’t you’re just really accomplishing the same thing and really should look the same the same too yeah I like this and a lot of times when I use the analogy of like building a report and or semantic model I use the analogy of like building a bridge we building a bridge from the report side like what does the report need to do to the end user what what data do you care about when you walk away from this report what are the expected actions we expect you to do or go talk
21:09 actions we expect you to do or go talk to or what’s what what happens after you look at the information a lot of times I I have people ask for reports and like what’s the actions I don’t know I just need a need a table okay tell me more about why the well I need to export it okay well why do you want to export it because I have all this other work outside of powerbi that I need to go okay tell me why you’re doing that extra work like where’s that where why are you taking a a dump of data and running away somewhere else to do a bunch of analysis to get to tell me why that analysis is important let’s talk about that and
21:39 important let’s talk about that and bring that forward potentially because that’s really the value ad is is to bringing a report in front of you that gives you the answers you need so you’re building that report side from one half of it and then the other side is you have to find the data and make sure that the data can actually speak or support what the report needs and I find a lot of times people don’t do enough work on the data engineering side and therefore their Dax gets very complicated it’s overly complex it slows down the model we have tables that are
22:10 down the model we have tables that are not designed very well and so what we wind up doing is spending more time data engineering because we didn’t have good requirements around how does the data coming to us because I I don’t know about you guys but every project I’ve ever been in anytime someone gives me a data source it’s never in the right format it’s not made for for semantic models it’s just not you need it needs to be shaped differently so I’m always reshaping data and thinking about what other the dimensions what do I care about hey I’ve got this table that’s joining to a fact table and it has a high cardinality join well that
22:41 has a high cardinality join well that slows things down so I can’t have that so what can we do to simplify that is there any way can I break that apart into more Dimension tables do we need all these dimensions in this this product so there’s a lot of other elements here that you can finesse inside the models to meet people’s needs Seth what are some of your initial reactions any initial reaction you want to go through the article like in sequence or do you want to just pick out a couple key things that you like what what are your thoughts I I think my thought is this is one once again a big big topic and you always
23:12 again a big big topic and you always know that right off the bat when the first paragraph or whatever includes links to other things that supporting documentation also Support also support the article that we’re talking about and I I would just say we probably will gloss over sections because it appears that that every cart article requires or could require multiple episodes of the show and he’s already got Tuesday for a while so we can’t do it again so links on Links of of other great things I would say people don’t gloss over that like dive into those
23:43 gloss over that like dive into those those areas that give some background to the approach of gathering requirements we’ve also talked about data models themselves in episode 231 so this is like dovetail onto there as well but I I think you make a really good point and I don’t want to move past what rides the line maybe in the article here is the business side one of one of the biggest warning signs to me is
24:13 the biggest warning signs to me is exactly what Mike you just described when Engineers are already building models and they’re going down and building a specific Visual and they’re building calculations and somebody who isn’t really in the weeds comes in and says Hey asks a business question right like hey we how how are we handling this requirement or what do we think we’re going to do here when the answer is always the technical one a and not the highlevel one I get worried and then
24:44 the highlevel one I get worried and then I try to back up the convers okay what what problem are we trying to solve yes what are like what is the specific area how does that tie into the overall you how does that tie into the overall report and and what it is we’re know report and and what it is we’re doing and when people can’t articulate that that’s a problem yeah but that’s also why we go through all these business steps so as Engineers as developers don’t don’t just zoom through this stuff it’s where we lock in our heads the high level easy speak that we
25:16 heads the high level easy speak that we should be conveying to the business but also contains really important information so when you’re down in the visual it’s like well this wasn’t originally in the spec like why do we think we’re doing this the answer I would hope to hear is well this page is designed to solve like to answer these questions and as I was going through here I like I found this bit of data that I think really enhances that so what I wanted to do is incorporate that because on the output for the end you like that kind for the end you like that speak because you it means you’re
25:47 of speak because you it means you’re engaged in solving the problem not just building something technically and that’s where I think engineers get re like wrapped around the axle is without that clear understanding we’re ready to go yep it’s a data set I’m going to pull it in we’re going to build these data I got a model and Bam I’m going to build this report yes the meaning behind what we’re doing is all encapsulated in this first part where we’re Gathering talking to the business Gathering the requirements etc etc and I was gonna wait till the end but I’ll interject it
26:17 wait till the end but I’ll interject it here because I think it makes the most sense okay do it I would interject in this like pushing forward a conceptual model because the the article way at the end into more of the logical and physical implementation which we have in tabular editor and I think that that jumps from hey we’re having a business conversation into yep we’re right into the technical like logical technical right there has to be that like I love ever since we started talking about I
26:47 ever since we started talking about I think it was 231 the the idea of this conceptual model it’s hey business user I’m going to use some terms that you’re not familiar with they’re called fact and dimension so when we start talking about that ad nauseum down the road here’s what they mean right and in a conceptual model what I’m saying is we’re going to take sales data right here’s some like column like the areas of business you want to care about and I’m going to call this is the fact right
27:18 I’m going to call this is the fact right and over here we’re going to have a distinct list of salespeople we’re going to call that a DeMent right so like the conceptual model is designed to bring everybody onto the same page yes right because ultimately we have a business owner that is the one that we’re serving up this solution to so if they’re not on the same page and they can’t see the structure of like the bits of business logic that we want to apply and all these things that’s a key part of
27:48 these things that’s a key part of business like Gathering requirements and I think even more so when we’re talking about models and its use and we’ll get
27:55 about models and its use and we’ll get into like the different areas I think Kurt does a fantastic job breaking down but I would just like interject in here the conceptual model that wraps or encapsulates these conversations is a fantastic thing to implement in whatever you’re doing wherever you can because whenever it’s not always just one conversation with business it’s multiple and if you can come back to the same visual diagram right with everybody you never have to rehash things you never have to reme like remember things or you
28:27 have to reme like remember things or you weren’t paying attention this one time in that meeting etc etc everybody has access to this thing that is like here’s what we’re building right like we’re solving a problem and here’s how we’re going to do that with data I like that I think I think to add to your point there as well I think when we’re using PBI I think there’s actually a I’m going to say misnomer maybe it’s not a misnomer maybe there’s a lack of understanding I think everyone thinks it has to be a powerbi report page always yeah and I think there’s also the idea of we want to model
28:58 of we want to model data together such that multiple tables make sense and relate to each other to your point facts and dimensions we want to explain this a bit more to the business because a lot of times business shows up and says I want this example report and they have a they have a pivot table they have a graph they have something built in Excel and say this is what I want give me this and we don’t talk about those requirements which if you’re build if you’re thinking about okay I understand let’s talk about the data source let’s talk about the relationships of the data now now we can start saying okay well you could
29:28 start saying okay well you could actually just analyze and Excel this stuff oh wow I didn’t know we could do that oh well if you need a table dump or you’re trying to get lots of columns together well that’s a page name report let me build the model and you can pick whatever columns you want you build your own things now now there is inside a workspace you can now do your explore your data right so you can do a little exploratory data where you just grab columns and measures and stick them together it produces a table and maybe a visual for people to go look at and then turn that into a report and then you can download that so I think there’s a lot
29:58 download that so I think there’s a lot of other tools that we’re not potentially we understand it as developers but the the audience who’s trying to consume powerbi isn’t thinking about it should be page report it should be a powerbi report or it should be analyzing Excel they’re just thinking I need this table done and move on yeah so I think there’s a little bit of like an illumination experience here I think these questions get at those answers right how many how many models do you need to make we think I think I think companies also or people who do
30:28 think companies also or people who do this or do this for the first time think I’m just going to make one Mega model so I can manage one big thing that works but you have to also be very organized and careful with that Mega model because when you change the mega model every report hanging off of it potentially could break so maybe maybe there are two models and I think a handful of well architected models solves a many many questions inside the business I don’t think you need a hundred of mean I don’t think you need a hundred of them but I think four or five designs of
30:58 them but I think four or five designs of models does a really good job of answering a lot of business questions across the company that is that is an interesting question so so a question to pose to you and Tommy and and Chad right there there are many many different solutions we can we can Implement now yes are are the days of the giant data warehouse gone not not like it’s not relevant anymore but it was it was always the Northstar solution right like the mythical thing was the giant data
31:29 the mythical thing was the giant data warehouse and like organizations want to move towards that thing that that model that just that just encapsulated everything it great question has that shifted shifted now in in your experience or what you’re hearing or like how you’re imp no what what I’m hearing now I think you’re right that we’re going to shift that way I don’t think that’s still the conceptual idea yet for a lot organizations but no what you’re
32:00 organizations but no what you’re saying to me is like yeah if I was a betting man that’s that’s where we’re going but to me this is like our conversations around we know how slow companies are to adapt to whatever the best practi is I don’t think they even know like this so whole idea is still of power B still even new to a lot of people and when we had this conversation with them I was going to bring up the idea of just bringing the requirements is usually a good exercise
32:31 requirements is usually a good exercise for can you table can you table the direction you’re gonna go yeah I I want to lean into like this question and the answer because it has it’s not really that that direction so I will say is there is there and I think that Donald is actually asking a very good question here did anyone ever really build the right giant IM style data warehouse is that still around I I still think there is I think the flexibility of that warehouse has changed right when when
33:01 warehouse has changed right when when that warehouse had to be built entirely inside SQL entirely on on Prem machines and we hadn’t had enough scale to support all the reporting I think there had to be a lot of very clear Financial justification to say what are you building right so I think that I think I think the warehouse or the giant Warehouse of information is going to still exist instead of calling it a warehouse now where it’s a single machine that’s doing all of it we’re now talking about like there’s now multiple lak houses and if I think about again
33:32 lak houses and if I think about again I’m I’m leaning on more of the data bricks version of this right when you say Lakehouse in data bricks it means all your storage accounts it means all of your schemas or your cataloges or your storage accounts and all the curated Delta tables everything you do in an organization that is your Warehouse so to me it’s a more of a a general terminology of we have storage we have compute we’re putting it together in the powerbi world Microsoft
34:02 together in the powerbi world Microsoft has made a a an icon on your powerbi workspace that’s called Lakehouse I feel like we’re we’re we’re not as true to a single Warehouse where all the data goes however if we look at all the lak houses collectively inside your organization and what you’re building yeah you are building a warehouse and you want to have how you organize that information now by quality of data right these are these are things coming from corporate these are things coming from Central bi that
34:33 are things coming from Central bi that will be governed differently than other people creating their own little lake houses on the side and doing what they need to do so does the warehouse still exist yes absolutely you need a place to collect data you need a place to clean it transform it and shape it into what I think is happening now is when you when you when I was studying database design in my masters for data science science there was many different diagrams of how you wanted to build an architecture you could have this monolithic warehouse and then have
35:03 monolithic warehouse and then have everyone looking at that monolithic Warehouse or you could have a warehouse and you’re building these little data Marts on the side to point at tables that came from the warehouse but you’re building many topical information like this is the financial data this is the sales data this is the operational data so I feel like what’s happening is the way Microsoft is building this we have this storage and compute layer called the warehouse which is Lakes and Spark and data flows and pipelines that is acting as if it’s the warehouse and now
35:33 acting as if it’s the warehouse and now what we’re doing is we’re building a bunch of tabular models that are acting like little data Marts for teams or topics or governed or not governed pieces of data so it’s like a hub and spoke approach you need the warehouse to collect all the data raw transform it clean it and then you’re building these spokes off of that that are the semantic models that actually serve the reporting pieces and keep that fact fast so that’s my picture of it so I don’t know if that answered your question directly Seth is that your your view too I think it does
36:03 that your your view too I think it does well I I think what we’re doing is were there was the thing called the data warehouse right which was structured transactional data it was a thing single thing and it was database driven right that’s where the technology lied and I think even based on the descriptions and what I’m seeing in chat like the concepts have not changed no and exactly Technologies have yes and I think where this is interesting when we we start talking about how many models right
36:33 talking about how many models right these are structures of the data warehouse concept yes that are being applied typically in areas especially with larger data sets where we’ve Amalgamated or brought together the data Lake right a storage place where we can store any data yes with the Trans actional nature of the data warehouse that was required to break out and use things we could
37:04 to break out and use things we could interact with in table form to reshape into dimensions and and facts which we still use in CTIC models the power behind all that is is
37:16 models the power behind all that is is Delta tables right like ultimately this unstructured storage using compute to get the same or very similar outcomes that we got with traditional databases so I think the interest point for me in asking the question is we’ve already evolved to using new technologies there is complexity though with going after a very large model because there’s a lot more
37:49 model because there’s a lot more involved in not breaking things as you go as you go along and I think what it’ll be interesting to me is as we build out the the bigger and bigger models if these new technologies also offer up different ways for that to be easier to interact with where engineering groups can make changes faster because like I have seen the the data warehouse in large form in a database environment and it would it
38:19 database environment and it would it would be if you wanted a new column somewhere to show up it was like weeks of work yeah and and and ultimately that becomes like you are no longer helping the business anymore yeah you’re you’re hindering a lot of the the things that they need to do and I think powerbi in its meth connections right and ways in which we can merge and like connect to and add on additional data even to just prove out value as a temporary solution while one is built is one of the the the
38:50 while one is built is one of the the the biggest benefits of of using the Microsoft tool stack I like your analogy there because I think I I feel like you’re you’re articulating something very relevant the technology is a enabling more Nimble and hopefully quicker changes to the warehouse structure basically I think that’s what what I’m hearing you say I and I really feel like that is good but there’s also this happy medium I feel like around even in the powerbi semantic
39:22 around even in the powerbi semantic model layer world right we can make changes fairly quickly but as we as the importance of the data increases as the eyes or number of users or consumers of that data increases yeah we may not be at months to add a new column to data sets and bring that in through all the store procedures and add the columns where it needs to needs to be I do think we are extending the time frame it’s it’s not going from Days anymore it’s you’re now taking a bit more time and rigor to build that that
39:53 more time and rigor to build that that Pipeline and making sure you’re test things appropriately one topic that’s not in here yet but we’ll probably have we probably have more talk about talks about this in the future is the idea or concept of data Ops I think with faster changes inside your semantic layers and your warehouses it we need a better more automated way of checking when we make changes and making sure the data did not drift or change in an unex unexpected
40:25 drift or change in an unex unexpected way but that’s going to that’s that’s another whole top topic yeah Kurt Kurt has a little data Ops icon yes I think data Ops is an underrated topic and there’s not there’s some people talking about it today I think there’s going to need to be more tooling supported either from Microsoft or people are going to build some things to make this easier for people to consume anyways back to the article back Tommy go ahead sorry I just want to have that segue yeah go ahead before moving on into the other I’m actually
40:56 moving on into the other I’m actually glad you guys did because you guys just had the most powerbi techn like data engineering consultant talk I’ve heard this this free hour of Consulting brought to you by Seth Mike dat model I think we need manic model too it needs to be built yeah like and know that’s all the knowledge we know we have we’ve seen that’s where we live but I think even just going back to the the article for getting a warehouse
41:27 the the article for getting a warehouse what I’ve usually seen especially from getting the requirements is you guys are are way up where the infrastructure is I’m talking to people who have no idea how they’re even defining it still and that’s always the battle and I think Fabric’s going to help with that but when we’re talking about the models that we need the data sources that is you guys know this too there’s that Discovery like well we always track it this way or maybe
41:58 always track it this way or maybe there’s ill definitions or how all that’s usually happening can usually raise a lot of questions if you are asking the right questions I usually find find that you are beginning to shine light in some process or system that was not working and it would never was working and that’s part of sometimes the favorite thing I do even though I usually don’t get the credit for it but it’s always it just shines the light where it’s like to what was not actually being tracked
42:29 to what was not actually being tracked properly if it’s going to work now so yeah house and where we’re moving great but we got to get to this point now where there’s still a lot of stuff in the basement that organizations have just have just kept I 100% will agree with you Tommy and there hasn’t been a single project I’ve ever been on where we get requirements we do some data modeling we produce some reports and some portion of the data is junk and we and better
43:03 the data is junk and we and better reporting shines the light into the dark spaces of your data warehouse and shows weaknesses where you didn’t realize they were there before always there’s there’s I every project there’s been more conversation around this and this is why I like the questions about half on the article talking about questions about the underlining data I think these are great like is there any special security or compliance you need to talk about what are the data that’ll bite you
43:33 what are the data that’ll bite you that’ll bite you what we’ve been just thr all we want all the customer data in the customer Dimension table you can’t put we can’t have their social security numbers in there why not put phone numbers in there please like they’re like no no we need it all like no you don’t and that’s a security risk like you can’t do like but we’ve been doing it for you that’s wrong like you can’t do that I’m not I’m not going to blast my mortgage company online right now but I should good so that’s one thing there right and then what data sources do you use how do you connect to them how do you
44:03 how do you connect to them how do you use them like these are a lot of good show me how type questions and it really helps that conversation of like okay where do we get this data from what’s the pattern here what are your naming conventions naming conventions are this is a day just to get through these five questions you’re you’re lucky even just naming convention what data sources do you need to connect to use well this is the data source okay what what tables these all of them oh let’s open this table why are there 250
44:35 open this table why are there 250 columns in here yes welcome to CRM yes exactly right and then the naming conventions are great because I’ve had multiple organizations use the same term the same like Tom you’ve talked about this extensively it’s the same term used by different people like seven different ways well we call it this and we filter out these records oh we call it the same thing but we do it this way and we call it the same okay I understand that you’re trying to say the
45:05 understand that you’re trying to say the same term but yeah standard margin tell me what standard margin is right that that’s one of those those what’s your what’s your keyword you always say stay away from it’s a finance thing oh it it is because I heard it recently reallocate yeah War there’s problems here when you say reallocate I know that that is going to be a lot of problems and your reallocation of things is data doesn’t
45:35 reallocation of things is data doesn’t conform to what you want to report on that’s throwing warning bells for me but it’s it’s that stuff because I’m more than happy to build you four measures that calculates it four different ways totally okay with that you just need to give me a standard margin for sales standard margin for excluding this right I’m totally fine having that calculation in there and adding what you need for it to be described correctly but we must
46:05 to be described correctly but we must Define a new term for it because the definition of that term is not consistent across team members oh like yes exactly and and and Donald to your point yes let a thousand measures Bloom from this conversation because that’s what will happen and hopefully you can get some alignment right maybe you can get people to actually align on this same terminology on things and Define things the same way yeah data cataloging is is a lost
46:31 is is a lost art the other one here I like is what freshness of data do you need how how fresh should the data become Tommy I think you’ve had this conversation too they’re like yeah we need it every hour you realize the data warehouse that you’re putting data into only refreshes once per day so you’re refreshing every hour but we’re only getting the source system to update once a day so there’s no reason for us to refresh multiple times let’s just do one and go with it or I love the
47:02 and go with it or I love the conversation around I need it live direct query I heard direct query we can do it’s do it’s like maybe it’s possible do we really need it how often are you using it every 15 minutes no like well maybe once a day yeah once a week I’m looking at it okay so you probably don’t need live then but I really need to see it right away when I well and I and I love that convers like I asked the question when you see the data how long will it take you to make a decision based on that data that
47:32 make a decision based on that data that you see almost always the dec the the decision point of when I need to take action is longer than a day like I can’t see my sales number and immediately hire 10 new salespeople to go sell more stuff that just doesn’t happen I can’t look at my sales revenue and immediately in less than a couple hours go into Google analytics and turn on a brand new campaign and have things funded and ready to go like it takes some planning to get that stuff done so in most cases I would say in my in my world
48:04 cases I would say in my in my world almost 90% of the time the data should just be refreshed once a day it saves you money and people are well how fast can we go we need more of it right totally understand but you realize you’re adding cost every time you speed things up you’re adding more dollars because in the cloud World compute costs money period so let’s decide what’s the and my recent conversation has been what is the dollar to Value ratio of how fresh that data needs to be there is a
48:34 fresh that data needs to be there is a value in minimum once a day but if you turn that up to five 10 15 times a day are you willing to spend the extra money to make that more fresh yeah does that make sense and I would argue maybe two or three times a day is relevant but if you’re not if you’re not taking action on that quickly enough then it probably doesn’t make sense another another good point that like is made right above that and also influences like self-service versus Enterprise or like centralized is naming conventions right you’re going to have to do a lot more work if it’s
49:06 to have to do a lot more work if it’s self-service to make sure that people that are interacting with that model and building their own things it that that the model makes sense so love those points if I was going to point out like the the big warning like not warning but like great parts of the article it’s this big warning section and and my comment like as I was typing it I’m like this is gold and it’s a gold color yeah if you’re going to read one part in here as far as like the data model part though like this is fantastic because it
49:37 though like this is fantastic because it says if possible already during the requirements Gathering stage try to connect to and view data you’ll use for spanic model profiling data for completeness quality and shape can help eliminate assumptions and identify issues before development Saving Time totally this is that understand what you’re pulling in first have those conversations with business figure out what the gaps are before you just assume everything’s Complete because I guarantee if it’s not managed by an Enterprise team or an IT
50:07 managed by an Enterprise team or an IT team you you have data problems fix those are identify them first so that those are already part of an expected workstream fix and you can keep going or it’s a hard blocker until you fix it because oh my goodness the amount of wasted time down the road of like things aren’t tying out why aren’t they tying out I don’t know let’s go let’s go walk back through the pipeline figure out all these Transformations oh it’s the core table so a lot of great questions in
50:37 table so a lot of great questions in there to like sus that out don’t underestimate the value of going to the source and testing the data but that’s why fabric exists like connect to it you why fabric exists like connect to it do some quality metrics on top know do some quality metrics on top of like that’s so helpful to people to figure out what’s going on in there and the amount of business users that assume the data is correct and right right out of the box is probably much higher than you think and then when you say they’re like oh yeah the data should just join together no problem take this table that t join all the things it should be fine
51:08 t join all the things it should be fine and when you go in you’re like well you don’t have a you don’t have a there’s no match there’s no key column yeah how do you join the data together well we don’t we don’t know well you’re not capturing it correctly so you can join the data back anyways and this is the change I just want to quickly because that I was I was going to go into final thoughts here Tommy already been an hour but Seth about just like from the DAT wearle where are we shifting where are we going this is the change is that now that
51:38 is the change is that now that ability to oh my gosh that qu we can quickly do those tests and begin not just to connect everything but how we can store in in fabric this is where we’re going to shift and I think once we get more organizations begin to really understand that how much more accessible their data is that’s going to be the shift where to your point where the data warehouse is going to lose its place where it is now dat dat Warehouse is a concept I don’t think
52:09 Warehouse is a concept I don’t think goes anywhere but I will say this we’re not going to tell you everything about the article even after this he walk Kurt walks through like how do you set this up in tabular editor go check out the article for yourself to see how it ends because we’re we ran out of time d d done it’s kind like the ending the suspenseful ending insert here all right with that I really appreciate everyone’s listenership let’s just do Qui some quick final thoughts and we’ll wrap here Tommy final
52:39 and we’ll wrap here Tommy final thought I think we need to do a better job of actually going through an entire article or maybe we just have a lot more to talk about but no the two hour podcast coming up next week da podcast so no but I I think but it just goes to show all the other items in here we didn’t we didn’t have to talk about a wireframe today we didn’t have to go through some of the scheme of information while it’s important but we’ve we’ve understood this we’ve
53:09 but we’ve we’ve understood this we’ve lived this and I think a lot of people here have Liv this too and it just goes back to that idea of how well can you talk about the business and listen to that like that Seth any final thoughts for for you I I I I stiming from like hey we tell you about great things sometimes we give you your opinion go read from the guy who put all the effort into putting this article together yeah and and Kurt did another fantastic job well
53:40 Kurt did another fantastic job well worth diving into it’s a great conversation thinking about the business problem the structure of the thing that’s going to support that is what this article does a fantastic job in doing and it gives you the methods by which you can go create some fantastic semantic models so give it a check out it’s really important as the structure for everything that we’re developing from the reporting standpoint and another job well done my final thought here is these are a lot of skills that have been learned
54:11 a lot of skills that have been learned over time and by doing this over and over again I recommend if you don’t have someone who’s doing this in your organization today currently read through this article try and learn some of these skills these questions are relevant if you don’t have someone doing this in your organization it’s really good to go grab someone from somewhere go get someone who’s a consultant someone who’s done this before bring in experts and learn from them how to do this process because this is not it’s not a straightforward it’s just saying build a report it it’s a there’s more to it so I think this is a learned skill it’s definitely achievable by anyone
54:42 it’s definitely achievable by anyone building powerbi models or anyone who’s doing data modeling but this is a great skill set to know and acknowledge and I think even I think data is going to be pretty Recession Proof you knock on wood here but having these skills and being able to talk to the business and build data models will be very relevant with that thank you all very much we appreciate your time we only ask that you would share this podcast if you liked it if you like this article please share it on social media or let someone else know at work that you’ve enjoyed this topic we’d love for you to like And subscribe and or share
55:13 you to like And subscribe and or share this out to anyone else Tomy where else can you find the podcast you can find us on Apple Spotify or wherever get your podcast pleas sure to sub subscribe and leave a rating it helps out a ton you have a question idea or a top IC that you want us to talk about in a future episode head over to powerbi tipsthe podcast leave your name and a great question and finally join us live for now Tes only Tuesdays and Thursdays and join us on on all the power by tips social media channels what are you implying that we need more episodes per week I think so oh boy you’re gonna I’m
55:45 week I think so oh boy you’re gonna I’m G to be perpetually on a podcast all right thank you all very much we’ll see you next
Thank You
Thanks for listening to the Explicit Measures Podcast—subscribe for more Power BI and Microsoft Fabric conversations, and share the episode with a teammate who’s about to start (or refactor) a semantic model.