Atomic Design in Reports – Ep. 343
In this episode, the crew talks through atomic design concepts and how to apply them to building consistent, scalable Power BI reports.
News & Announcements
-
PowerBI.tips Podcast — Subscribe and listen to the Explicit Measures podcast episodes and related content.
-
Power BI Theme Generator — Power BI.tips - The worlds best theme generator for Power BI reports. Increase your speed to develop stunning reports using this free theme generator. Themes are essential for any report developer’s tool belt. Visit…
Main Discussion
Atomic design helps you think in reusable building blocks (and consistent patterns) instead of one-off pages. The team breaks down how to apply the idea to report layouts, visuals, themes, and reusable components so your reports scale cleanly as requirements grow.
Looking Forward
Start small: define a handful of “atoms” (spacing, typography, colors, card styles), then build “molecules” and “organisms” you can reuse across pages and across projects.
Episode Transcript
0:35 good morning and welcome back to the explicit MERS podcast with Tommy Seth and Mike good morning everyone and Welcome to our conversation a see I cut you off again I’m sorry happy Tu and good morning and voice is back happy good morning happy Tuesday sorry a bumpy start today all right we’ll just we’ll just jump right in there so just for everyone who’s listening this this is a pre-record episode we have done this one ahead of time people are traveling at summertime so we’re doing a little bit of breaks here in the US and some people are moving around so we’re taking a bit of a
1:06 moving around so we’re taking a bit of a break and we’re pre-recording a couple episodes so this will be a pre-recorded episode and our main topic for today I don’t think we have any other major announcements we want to tackle here but our main topic for today will be Atomic report and model development from an article written by sqlbi and coming out of our favorite harbi developer Kurt ber we talk about him all the time on the podcast should get Kurt on here one time just to say hello we
1:36 on here one time just to say hello we need a little we need we need a little cardboard cutout that’s we can bring them up and have them introduced to thecast I’d made I’d make an exception for Kurt normally normally we have a bunch of rules but but we well like they when you get as many EP you have around content come on so Kurt goes through a really article and CH the description of the article or the link to the article will be down in the description of the video below so if you want to go check that out this is an
2:06 want to go check that out this is an interesting article and what sqlbi is communicating here seems to follow a lot of the patterns that come from sqlbi so this is very interesting where they’re going with this and very intrigued to see where they’re going to take this idea of atomic report model development and design any openers do we have any news anything that came out that was interesting since we talked last I feel like we covered a ton in our last episode we went through maybe all of them there was a there was a Blog
2:36 them there was a there was a Blog announcement the July update for powerb desktop there’s a lot of little things that are coming out I haven’t played with every little feature that came out there so I know there’s still probably things that we missed that are good but I don’t think there’s anything worth talking about yet all right that being said let’s jump into the the article I’m going to quickly go through just a little bit of idea here I there’s a video a YouTube video and an article write up that goes through this and basically it’s talking about Atomic design I have you guys heard of atomic design before has that
3:07 heard of atomic design before has that has that been a phrase that you’ve it sounds like this is a common pattern I’ll say that yes no I I don’t know by the name but by other names it like the the design pattern itself is reminded me of like object oriented programming right where you’re you’re reusing things so programming yeah so like right right out of the gate I guess Atomic design methodology from a uiux
3:37 design methodology from a uiux perspective comes from like Brad Frost and Kurt Kurt puts a link into some of the original ideas behind that and on a basic level I Kurt does a fantastic summarizing that in in a little visual right right right up front in the article but essentially you front in the article but essentially the the Brad fost know the the Brad fost description of things aligns with that as well as well yeah and I if you think so there’s there’s this concept you there’s there’s this concept designing things using the atomic
4:07 know designing things using the atomic design method it’s a it’s a play on biology basically right it’s talking about everything is made up of atoms and so if you just rearrange the atoms in a certain way you get different results and so here we are we have the the Known World all built out of atoms another book that I’m reading right now that has really impacted me in general has been the book called Atomic habits very similar concept breaking things down to the most granular actions that you can do and and the concept being many things you want to achieve in
4:38 being many things you want to achieve in life aren’t made up of really big Leaps and Bounds in progress It’s actually made up of very long running consistent small steps that you do and I’m trying to unpack that book and it’s it’s blowing my mind if we if you haven’t read Atomic habits book it’s like a bestseller it is really fundamentally changing and it hits on so many parts of the the human behavior what people behave like it’s just incredible so really really enjoy that that’s another
5:08 really really enjoy that that’s another really good book I’d highly recommend it but this sounds very familiar break things down to the most essential pieces and then start from the very small elements and stack them together and then once you’ve built them up now you have this comprehensive complete design of something and so I like this this is a this is a really interesting concept I like where they’re going with this one yeah it it the I’m going to go down private hole a little a little segue but yeah Atomic habic I don’t know if I’ve read it
5:38 I’ve read it but it it strikes me in the human behaviors realm and it it was always shocking or somewhat irritating right we all we all like to think that we’re extremely unique right your world is your world right yes we’re all individuals but as it turns out in terms of like human behavior right how can they cognitively like bucket us into like these behaviors or thought patterns or so well that’s because like a large portion of humanity like has the same
6:09 portion of humanity like has the same types of behaviors or constructs that you can break down into psychology and different things like that so it is it is it strikes me as this isn’t a unique concept that just only applies here in many ways it it also is fantastic for problem problem solving because big complex problems whether that’s business or personal life and especially in the personal life realm right hit harder because there’s a lot of emotion tied to them
6:40 there’s a lot of emotion tied to them and it’s really important to be able to dissect them down into the dustable pieces yes or things that you can action on right yes and I think that’s what’s the best part about like thinking about the end products right in the same way like how do you build these things it’s all just different pieces right so the the layout of this atomic structure starts with the atom right which is basically just a a core building block
7:12 basically just a a core building block it’s it’s the it it’s a thing and I think even in I don’t know if it’s objectoriented programming but it’s like I’m there there’s a function right there’s some you build something that does something simple then the molecule right like the second layer of this this theory is essentially assembling these atoms together like yes they’re the core building blocks so they’re in in some respects like a widget right you combined a few of these things and it performs this action in some way if you
7:44 performs this action in some way if you combined other atoms in another way like it would do this thing and all of the sudden because you have these core core things and then these groupings that do other things now you have a bunch of things that do things and it doesn’t matter if you’re talking about products now or if you’re talking about something else now like they still perform the same actions which makes scalable programming yes right so then ultimately he lays out the the other three which is
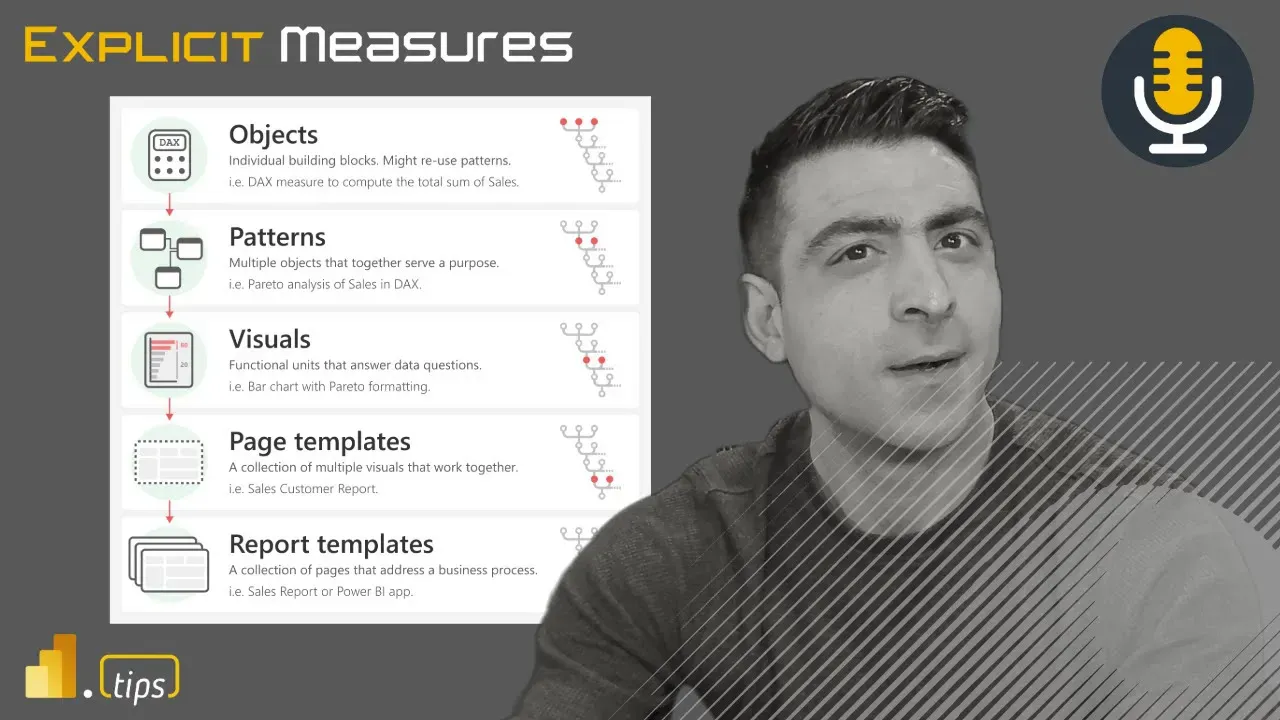
8:14 he lays out the the other three which is organisms functional units together that make up a complete solution right templates conceptual layout that consists of different units put together and then pages are multiple layouts filled with representative content so we’ll talk about each layers of the but I fundamentally I think the structures are really sound obviously because there they’re so many many different aspects of life but yeah it’s I like the structure and and the thought behind applying it here
8:44 and the thought behind applying it here okay I’m gonna I’m G to take a you went on a rabbit Trail for the human Psy a little bit you did but you’ve triggered another thought and I have to IND I want to indulge the thought and then we’ll come back okay so second Rabbit Trail I know this is a rabbit Trail I’m aware a little but your concept around you cannot predict any one individual persons or behaviors but you can predict the masses of behaviors like when you talk about a lot of people grouping together you can more accurately predict what’s going on
9:14 more accurately predict what’s going on this really speaks to Isaac asimov’s book or book series around the foundation have you guys read that or watched the series on Apple TV h a long time ago I think I I feel like Seth you’ve read this one I feel like you you’re much you’re a much better reader than I am so I have not read it I have watched some of the series on it’s probably again the TV series from
9:33 probably again the TV series from Apple’s probably way different than the books I don’t know I can’t speak to it not educated sorry don’t know what’s going on there but I’ve talked about this with my dad a couple times because he’s read them and he’s an Avid Reader on this stuff and the science fiction and things and it was very interesting you cannot predict any one person but as a as you continually collect more and more people together you can now predict the direction of what things may happen in large masses and it’s much more predictive it’s like statistics right if you have if you roll one die you won’t
10:03 you have if you roll one die you won’t be able to know what it is but if you roll it a thousand times you can have a very nice distribution of like what it would what it would roll to so any those things that are very interesting it’s like applying applying statistics and maths to this which is fun anyways that was my other dver diversion of thought there let’s bring it back into to report design and we went psychology to Sociology there maybe I don’t know I don’t know all the allies well this article is talking about biology so keep going oh boy
10:36 so keep going oh boy anyways so what are what are your thoughts do you do you like the analogy of going into so if we talk about objects patterns visuals page templates and Report templates right do you like this ascending version of collection of things measures being the the basis for object or measures and columns basically right that the basis and then you identify patterns which again we know that that exists from a Marco Russo standpoint because SBI is
11:07 Marco Russo standpoint because SBI is all about Dax patterns they’ve built their entire recent career around training and master deck work I it’s all these patterns that appear over and over again which is nice because you don’t see these patterns unless you’ve had a lot of lot of time reviewing and testing and like to me patterns are harder to pick out just because you need a lot of runtime on patterns to know what really does it exist is it is it something you can solve and you can this is I think a challenge for new Dax
11:37 challenge for new Dax users you can solve the currency problem three or four different ways but what is the most efficient way what happens when the data gets really big and have lots of rows does your pattern still hold true to those really large patterns of what you’re doing what do you think I think go ahead because I have something not as positive I think as your going to have to say oh okay so I think to to your point Mike the pattern part is one of the more complex aspects of tabular
12:09 of the more complex aspects of tabular like modeling Dax yes and and I think it separates the novice or not like light light practicing user yes to the practice professional right because you can you can lose this as well right in in comparing the two one is it fumbling around door like in a maze of doors right it’s like oh yeah these are my three options let’s look at
12:40 are my three options let’s look at this door I got this to work I’m going to walk through it right versus others that understand a pattern what doors to open what doors to avoid you doors to open what doors to avoid in C certain situations because know in C certain situations because they’re developing a framework right of calcul ations based on what what is the most efficient and a lot of that comes out of sqlbi right like like guys who know their stuff guys or gals like a lot
13:10 know their stuff guys or gals like a lot of them come out of these patterns of really good practices that have been learned over lifetimes where Marco and Alberto this is this is what they do this is their jam right like and and to share that in the way that they do has really enhanced I think a lot of models that have that are out there I’ve grown from it Professionals for sure yeah I I’ve been so committed to mean I I’ve been so committed to learning what they teach to send my team of people to their Advanced Training in Dax and like we learn a lot so it makes
13:42 Dax and like we learn a lot so it makes such a difference it makes such a difference and you think about things you look at models you build five years ago two years ago and one not many people can speak about models they built 5 years ago cuz some people haven’t been around that long for to do this but like part has only been for 9 years go back five years look at your models and you’re like man what was I doing like I’ve learned so much I have so much more knowledge around what’s going on here and one one thing I think is a detriment to companies I think companies
14:13 to companies I think companies overestimate how unique they think their data is and I I think if you start stepping back and and this is the same thing I I found when I went through Delta training as well there’s this you Delta training as well there’s this market share analysis that we were know market share analysis that we were doing and and we were talking a lot about position and Direction highly impacted my career as far as data and analytics but a lot of companies think that they have to reinvent the wheel every time and and to be honest you don’t need to there’s a lot of things a lot of Standards or things that exist
14:43 lot of Standards or things that exist that are already known you just need to reuse the pattern so sometimes I feel like we try to make these really custom solutions that are really our Edge and what are what are we really doing with our data things and we’re we’re so unique and we don’t have you’re in an industry you’re very similar to somebody else and so what can you learn from the whole phrase there’s nothing new Under the Sun I think really resonates for me in this area maybe we need to just do a little bit more research to figure out okay what can we do and I think these patterns area is a great place for people to sit down and
15:14 great place for people to sit down and do some research because I think patterns really inform the table structure or the design structure of your model as well because I feel like the patterns are you have sales and it has to fit this way with these kinds of tables or here here’s how we do a currency exchange the from and the two there’s actually an example that Kurt does in the video here where he talks about using tabular Editor to build out some of these patterns inside his model I really liked the the hook in this article around using existing tools to
15:44 article around using existing tools to help produce this stuff like fabular editor makes total sense this is really good I want to make sure that as we go through today that we look at this holistically as per the article because I think it’s going to be very easy for us to take a look at just the development side of things and how see how naturally you have the dependencies sound naturally we’re already since kind sound naturally we’re already since creating that framework but this of creating that framework but this article is talking about this whole
16:14 article is talking about this whole atomic structure from data to individual titles in a visual and how they’re all interconnected and I and I want to just make this point because this is where I think personally I’m having a disconnect yes everything that we do with a data model and the dependencies on those tables that’s almost a technical argument because that’s always going to follow those rules I can’t not connect to that table in order to get this the required columns or you’re gonna get
16:46 the required columns or you’re gonna get a error or bug but this atomic structure is really talking about also everything that goes past the measure itself everything after and sense the techn after the data from the individual visuals tied to the tied to those particular data sets or those data points okay this is where I’m feeling a little bit of Separation because as of today I don’t have the ability I can
17:18 today I don’t have the ability I can create a template I can create a theme okay but the level of granular detail I think some of it that’s laid out here I think that it becomes a lot more free form where it’s not gonna it can’t really follow an atomic structure it can follow a a a pattern it could follow a basic template so to speak but to the granularity that that was outlined I want to get your thoughts on that more espe from the design side because again we’re not just talking about the data
17:48 we’re not just talking about the data patterns that we’re doing and how we already have in a sense automation around that when this happens this always happens once we go to the report design side we no longer have any of those guard rails well I think we let me say it this way I think we have a very well-known I think OB I think the objects themselves the measures that we’re building are very well known we really I think we realize and understand that those things are supposed to build upon each other there’s interdependent measures that are going to stack and
18:18 measures that are going to stack and those those make sense those patterns I think are very well defined and they’re very consistent and there’s actually to believe to your point Tommy I think there’s really good tooling to help help you build that that’s where tabular editor I think really shines is and Curt shows this in the video that I really love and it’s a pattern that I I I have used a number of times is when you’re starting a model from scratch you have seven columns eight columns he in his example he has 10 columns he selects all 10 columns and says I’m going to build a
18:49 10 columns and says I’m going to build a measure a sum on top of each of these columns and I’m going to hide all the old columns and I’ll put all the measures in a new folder so basically linking them all together and it’s it’s a there is a reusable pattern of when we talk about best
19:06 pattern of when we talk about best practices that follows one of our patterns make measures not columns put the measures in a folder organize it by The Logical grouping that the users would would understand that’s the pattern and so we have tooling to support that where I think you’re getting some grief Tommy is there is this interesting play around okay what what measures what things should I be dropping onto the visual because that’s more of an unknown it could be more there’s more variety in Solutions around
19:36 there’s more variety in Solutions around that part then when you get over to like the other side of that realm which is okay we know what the style like the title should be centered it should have this color pattern like those are other let’s call them patterns that we have decided to build and establish and desktop does a good job around giving some of those patterns I’d also argue and this is one of the things I don’t like about this article is they’re missing very heavy feature in here there’s no talk of themes powerbi report themes there’s no talk of a theme
20:06 themes there’s no talk of a theme generator there’s no talk of template generation tools so while they call out very clearly at the bottom of the article hey we did we’re doing this amazing thing and hey we have tabular editor and deck and Bravo to do a lot of these core things I think they miss a lot of the other base tools and again this is their article this is their company they’re probably pointing to the tools that they’re most involved with but why not shout out other tools there’s other tools out here that are doing a lot of what they’re describing in this article as well I think they’re doing a disservice by not pointing out some other things in the community that
20:37 some other things in the community that are also helping out with this but to go back to your comment Tommy there’s some of the visual styled things can be brought in as a pattern it’s the Mis it’s the mismatch between the measures and what’s on the visual exactly and I think I think what I’m going to say here is I still think the concept exists to be able to bind random measures to a Visual and have the visual style a certain way I really do like what Kurt said in the article and he talked a little bit around if I want
21:08 talked a little bit around if I want this card visual to look this way I need to be able to build if you think about the styling or the card or where it needs to sit on the page all the measures that make up that card they they should just be variables at this point and I think what you’re finding Tommy is there’s no tooling today that takes a collection of ual from one report and can easily swap it out to a different report because as Kurt specifies in the video they’re in desktop the tool itself the d The Tool we’re talking about when we copy visuals
21:39 we’re talking about when we copy visuals from a template file into an actual file that we’re working on there is no replace columns there’s no replace measures on top of that so the tooling the concept exists the tooling does not and so that’s where maybe you’re going is the mental disconnect for you is there’s no equivalent tooling to actually accomplish this final pattern does that make sense no you’re completely spoton because yeah I may have a great pattern building layouts and themes yes and I
22:09 building layouts and themes yes and I great P pattern building data models and dependent measures but they are not connected at all in terms of they are are just they are I think they’re 100% are like you should be able to and this is I think this is a Miss from Microsoft honestly right or there’s not a tool to get to do it right what you should be able to do is you should be able to copy a visual over from one report to another what should happen is when you land the visual it should come
22:40 when you land the visual it should come up with a dialogue box or if it has the measure that it needs it should just drop it in happy move on right but what should happen is you should copy the visual in and what it should say is look these measures are missing can you please help me map them to measures you already have in the model and you just pick pick pick pick those are the new measures boom visual gets added that’s a to me that’s a Miss from desktop if you’re allowing a copy paste of an object from one report to another you should understand that you’re already going to a different report yeah right
23:10 going to a different report yeah right so so the a dialogue and or the things that are going to fix all of the properties of that visual should be front and center right or like surfaced in such a way that it’s easily like updatable and I I I do agree in that visuals layer that that the implementation is still janky right like but I don’t think it discounts from the standpoint that if you think about uiux development right if I have a
23:42 about uiux development right if I have a figma that shows me the many different ways I can present a card and an i with an icon on it or up down showing whatever if I have 10 different examples of that yeah and that’s what I’m showing to a business user and saying Hey Okay so we’ve got all of these these St these calculations right we know what the requirements for the report are we know what answers we’re trying to drive at it’s a matter of design Andor what we want to represent in this Visual and I also have
24:14 represent in this Visual and I also have that already created that saves a ton of time yes right so yes is it Jinky that I have to like copy and paste the object yeah but at the same time like if it’s in the form format properties are set all that stuff and all I’m doing is taking object and putting it in my new report that’s a that’s what I think this article represents which is reuse things as opposed to every single time you’re building a report build the new things start from scratch yes exactly so
24:44 things start from scratch yes exactly so what what’s funny is Mike as you were explaining how what you wish Microsoft had in terms of from the copy visual I took that a different way when I was reading this article and again this may be Pine the sky but to me this is what I wanted for years and hopefully when then the new metrics feature comes out if I’m adding a measure to my report right now we have the formula we have a description we have obviously the logic sure but why couldn’t there be the to the atomic approach other
25:16 the atomic approach other metadata that would automatically get filled into a visual because that’s one thing and this is where my disconnect is is I can re we can have teams reusing measures but they may use a different title they free to choose any title they want or any descriptive information they want everyone’s probably using a different color or what have you from a visual layout point of view of certain measures what I would love is having certain attributes on that measure and when I add this to the
25:46 measure and when I add this to the report it either adds that to my description page or it adds the appropriate title or subtitle because that becomes that more holistic approach especially when C was talking about the titles and sub titles in here because how they’re all connected well they’re not because I still have to manually write my own ev Everything in power the only thing is the data itself but this is really interesting Tommy that you’re you’re telling me this so let let me yeah and I think I’m out as a well
26:17 yeah and I think I’m out as a well you’re you’re blowing my mind a little bit here to some degree right so to to answer your question directly is there a way for you to be able to add additional metadata to a measure to help it figure out what thing it should be on yes the answer is yes it’s called annotations annotations exist you can it’s a key value pair you say what the name of it is and then you you describe what the the output of it is on The annotation so everything gets annotations columns measures tables the whole things annotations are what Bravo uses to signal to Bravo hey this date table was added by Bravo and therefore
26:49 table was added by Bravo and therefore these measures can automatically be bound to those columns with a holistic pattern so what might what what sqlbi is already doing in the objects and patterns side of things things is they’re saying we’re going to make objects that we know exist and therefore we’ll track them and then we’ll give you these based on the existing objects you’ve added or you’ve already defined in the model and then we’re going to give you a whole bunch of measures that also can be added to that as well extending that thought further using AI using other assumptions here if you
27:20 using other assumptions here if you just look at the pbip format and this is I think this is another area that has been is now opening up a whole new realm of things where if you now open up the pbip format it’s now a very known structured Json thing and so now you can expose this to large language models or generative things and start saying generate me report and then you could also scour all your existing reports with that pbip format and go into them and look at all the items and say which
27:50 and look at all the items and say which measures are most commonly used on these types of charts what categories are most commonly used across your models and potentially from that based on your descriptions based on the annotations based on the things that you’re having I think you you need some level of like sorry too many thoughts are happening at once it’s all colliding you need something that is able to read what’s going on there and push the annotations back into that data so that way when new report Pages or new things are built on top of those objects
28:21 things are built on top of those objects those fundamental patterns or fundamental measures the visuals can be more easily created right so to your point yeah the sum of sales is something that would make sense to have it on a bar chart or a line chart but depending on what it would combined with right so maybe what should be happening
28:39 right so maybe what should be happening here is the AI should go through and look at your model and provide recommended annotations on things and then based on those annotations you can then stub out most of a report and then that can give you like a baseline of where things are coming from is that where is that this is amazing this is a really neat idea you’re unpacking right now I don’t want to go too far because I didn’t want to say pie in the sky stuff but no you’re right with the with the PIP right now there’s there’s a lot a huge world to this there’s a lot
29:11 lot a huge world to this there’s a lot of better ways and I don’t even think you need AI to do this yes you do everything needs AI Tommy when I walk down the street if I’m just taking a walk outside I need AI to help me do that I can’t I can’t do anything without an AI anywhere you at least need a prompt exactly we should at least be prompting things yes which means we need AI this is this is true I can’t even answer an email without AI mean Microsoft has told us you you are nothing without AI That’s that is where we’re at right now Tommy you want AI to summarize what you just wrote yes I need AI to help me
29:42 just wrote yes I need AI to help me build my coffee in the morning the AI tells me how many pumps of of of caramel to put into my coffee just because I need the AI to do that I can’t I’m stupid without ai ai helps us actually go through a ton of articles on a given week too Fu Tommy’s not even real actually Tommy is made up from an AI Tommy is not even here Tommy has been Tommy has been doing other things he’s actually vacationing in Hawaii for the last six months he doesn’t even exist on the podcast we he has a local model it runs
30:12 podcast we he has a local model it runs off his Windows machine we’ve autogenerated Tommy’s he’s not even real Tommy you could probably any there’s enough yeah let’s let’s incorporate some basic llm in here where there’s not even user interface right we don’t to say it’s co-pilot for powerbi it doesn’t have to be that it could be some basic actions that occur like to your point Mike when certain elements exist or are shown to go through a certain workflow this is where we
30:44 a certain workflow this is where we really had this Atomic approach because just like powerb is also hopefully I haven’t heard anything about it the the metrics feature that they demoed at the fabric a conference they’re elevating to me this is just elevation of the metric so there should be a lot more tied of this anyways I think that’s bit of a rabbit hole the the short thing of where I’m going with this is we have a ton of atomic approaches that are seamless and almost required with the
31:14 seamless and almost required with the data development side of things because you have requirements and dependencies oh you don’t have access to this or you didn’t incorporate that column it’s not going to work but we go into but why can’t that stuff be pattern driven right right why can’t why can’t I ask questions to your point Tommy like the business is going to ask questions of this right it’s not the idea of having AI do things for you isn’t necessarily to give you the answer but maybe it’s also maybe what
31:44 answer but maybe it’s also maybe what should be used here is the AI should tell you what’s missing what’s not here right so if you think about the vacuum of things you can’t build Tommy to your point there’s no date table in this you should have a date table like you can’t ask these questions unless you have this right yeah and or make sure include certain descriptions in your dang titles when you use this measure yeah and then it should recommend here’s what I think these descriptions mean can you please review it does this look good to you
32:14 review it does this look good to you like that that’s the stuff where I think we could use a lot of these patterns to help us build like but it should be able to evaluate right these patterns have inputs and the patterns have outputs in all of these items a measure the pattern of objects the the sqlbi why is that not used as a way of evaluating your model there’s the Dax Optimizer I think is that’s another tool from sqlbi where they’re using again they’re evaluating your model for patterns and saying when I see this pattern a a calculate wrapped in
32:45 a a calculate wrapped in something here and this is going to be slow you’re you’re not using treat as you’re using this other pattern that you could use to it knows already based on historical usage of what Dax measures have been doing this is a slow pattern that same thing could be used everywhere else here too yeah I I think what’s interesting to me is the as the more we’re talking we’ve we’ve got and I think Kurt says this in in in the article as well right there there are tools for objects and
33:16 there there are tools for objects and patterns there are tools that we’re we’re expressing that are not expressed in the article for page templates and Report templates it’s our one one that we love obviously is our own where we’re developing a an experience that most business intelligence folks are just concerned about the data right and business users automatically can get value out of in terms of like helping them structure the page make it look greatl looking the visuals part though
33:47 greatl looking the visuals part though where we’re talking about I I think in a lot of respects if somebody solves that tool problem specific today whether it’s AI generated or you whether it’s AI generated or like tool generated is is it drives home the conversation right from the start right so if we think about requirements Gathering questions
34:18 about requirements Gathering questions we’re trying to answer if I have a pattern that I have the visual objects based on a whole series of objects and patterns of data right now when I’m in that conversation how much of that is actually net new right with a business User it’s like hey like how often are you having this so describe to me what it is you’re trying to track well what’s really important for us is we we need to see the number of cases that were
34:48 see the number of cases that were generated over the last month or whatever or etc etc it’s like oh okay well we’re we’re looking at a line chart we have a Time element and then we have whatever the thing is right so how repeatable is that visual in the realm of all the things well it’s very repeatable so if I’m just going through this conversation and I have a library of visuals that also correlate back to patterns and objects and things that I need to go construct that how much of
35:19 need to go construct that how much of like at the end of that conversation if I have all the this framework to build something how much of that is new versus just like plug andplay with the data points and making sure the data types are there right that’s a very interesting like thought around the process of like when we’re doing Discovery when we’re doing the interaction with the business and to your point earlier Mike businesses may
35:49 your point earlier Mike businesses may think their data is so wildly different but it’s not it’s the same it’s the same what in every business we see as consultants you see the same patterns does it start with an oh I was same pattern the same patterns is it slightly different data is did somebody muck up the source systems exponentially yes possible yeah but at the end of the day there’s a lot of similarity in the same things that they can use and as
36:20 the same things that they can use and as powerbi is growing here with the different formats pbip PB pbit right like and the developer tools I think what this article does is it opens like it it’s a refresher to like hey folk hey hardcore bi devs right of the powerbi ecosystem hey practitioners that are developing a lot of solutions all the time we’re now in this realm where maybe we should be thinking about this in a objectoriented framework or in
36:53 this in a objectoriented framework or in this framework of repeatable objects that we can reuse and hey in the future if somebody solves number three I can reading the tea leaves I wonder who but like it’s like the the that piece is missing in this architecture of like hey how if we’re going to develop this whole end to-end process we’ve got four out of the five pieces in different various parts of the
37:24 pieces in different various parts of the parts of a tool but I think that that is very compelling because that would that would definitely drive a lot of ease into just almost figma like plug andplay oh you want this object this is what it’s going to look like here grab that that’s what makes the most sense by the way we’ve already constructed you the way we’ve already constructed a page template right that has know a page template right that has these visuals that produce sales by you these visuals that produce sales by region and here are the most know region and here are the most important things that we found across
37:54 important things that we found across the five customers we’ve been interacting with y y they’re like yeah I love that like give it to me okay print right plug it and then all and then all you would need to do on the back end is prior to object Define what the configuration for data coming in is
38:12 configuration for data coming in is yes and Seth your you’re spot on here with all of this honestly like looking at the article again I would I would argue the tooling exists on the very atom the very small atomic size it’s easy to build tooling there it’s it’s easy to build tooling on the other side the very complete items here’s all the pages here’s all the visuals here’s all the the components that make up the the complete solution what’s missing right now is the tooling that exists to map
38:44 now is the tooling that exists to map the measures into the visuals and produce that as an a complete product on the page so that’s that’s the one thing that I see is missing in this is the tooling does not exist to get from pattern through visuals into page templates yet right but we’re really close to someone’s going to figure this out and start producing this which means then we have complete tooling and then the question will be is who’s going to create the complete tool that starts from objects and builds all the way
39:15 from objects and builds all the way through to report templates because we’ve been doing I’m I’m very proud to say I think we were probably one of the first innovators around report templates and we started very early with theme generation that was where we started cuz all powerbi desktop gave us and as soon as pbip format showed up we’re immediately building you showed up we’re immediately building report templates page templates all know report templates page templates all the templating things we just don’t have the data added to it we’re we’re we’re tackling the problem from the report templates back into the visual side so we wanted to make it this easy so you just pick the visual drop in the
39:46 just pick the visual drop in the measures and that’s where the humans involved because that’s not automated yet yeah it’ll be interesting it’ll be interesting to see just in general whether it’s sqlbi or other like other organizations or people right part of the community that lock into that realm to try to solve a problem because it’s it would be a complex problem too like how how in theory it’s very easy to say like yeah okay I have this visual object and it ties these patterns object but like how many different variations of things would
40:17 different variations of things would break in there right can I go back and just configure something that aligns to all my objects and it’s as easy as I describe it to be well we all know you’d have to do complete data validation you’re not doing it like as opposed to when you’re developing these things you’re incrementally validating that all the checks and balances are are tying out and I suppose you wouldn’t have to do that if you concretely knew some of the the core op like
40:47 knew some of the the core op like objects would always produce the the correct results but there’s a lot of ambiguity in Dax too right like in a lot of those things that you’re creating so like double validation like are you creating more work for yourself by trying to do a standard or does the standard get you 70% of the way there and then you always have the 30% custom well how does that work with visuals if and not breaking them or not having all the objects within them to go backwards what I’m saying so like in theory hey yeah it’d be a perfect world
41:17 theory hey yeah it’d be a perfect world but maybe AI fills in the other 30% I don’t don’t know man I guess I keep thinking about like this I’m really I’m getting hung up on a lot of this visuals and page template pieces none of this exists today it just doesn’t exist like what I today it just doesn’t exist like what what by that is you need a mean what by that is you need a definition of a visual and then you need to have these are the measures that this visual would expect or these are the the it’s not even it’s not even the measure name it doesn’t the measure name is almost Irrelevant in this conversation
41:48 almost Irrelevant in this conversation it’s more about what does this visual show what’s the like what are we trying to accomplish with that and then inject into that is okay these are the input properties these are the inputs required to build said visual doesn’t matter what those are and those could be bound to anything that’s in the model so like it’s this it’s a very like abstract version of like to your point it’s building object oriented programming it’s an object that is now a visual the visual gets some input parameters into it and the output is this this pattern
42:18 it and the output is this this pattern how you style it how you change the title like those are those are remedial things but like that’s just changing the the style side and that’s something that’s already built in the tools today so what what is also interesting is like page template and Report template kind page template and Report template divert I think a little bit in their of divert I think a little bit in their description of like how we would would view that like like if I’m building a theme right or a template tized theme looking feel right it can include visual objects but it doesn’t necessarily it
42:48 objects but it doesn’t necessarily it doesn’t include the data itself correct I to some degree I wonder if this this approach and this view of the world is too sanitized you view of the world is too sanitized what I’m saying and and if know what I’m saying and and if Marco and and Alberto’s content in C it is very structured it is it 100% makes sense and there is a reason why they are the formost experts in Dax however I think some of their ideas butt up against Real World business scenarios
43:20 against Real World business scenarios and the ugliness that exists within powerbi from a yes it’s not a perfect semantic model yes people build stuff that is way wrong but it’s still very useful and I like in the page and Report template it definitely reads like there’s a Str there’s a perfect structured way to do this we’re going to deploy it in this fashion we’re going to build these page and Report templates and then the output of this is what everybody would use and that’s not the case agree somebody’s want to customize
43:51 case agree somebody’s want to customize it right so what happens when I have to customize it what if I want to build a different visual what if I want to do something that isn’t necessarily part of a template do I have like is does that break the construct completely or is that an acceptable like diversion or and and that conflict back and forth will be interesting if if a complete solution is the byproduct of all this or if this was just a hey like we have this this methodology by which we go and go build things that’s interesting you say that
44:21 things that’s interesting you say that because I I look at the objects and the patterns those two items that that sqlbi has developed are very sanitized it’s very these are the patterns this is how you follow it this is the measure that they build because they’re able to test various patterns and say this is the best pattern to use in these situations or these kinds of situations and I feel like that is a very interesting your observation on four and five section four page templates and five report templates maybe there’s a
44:51 five report templates maybe there’s a bit more of a a human factor on there that it wants to style it their way get more of that creativity in into that that design model but we know that you’re gonna have to look at all the reports Mike to get the average right you’re going to do that you can’t look at one individual so what what do you mean I’m not sure I follow your comment I was trying to make that a tie back to the beginning’s talk about you can you can find out what they’re all doing I know how all the reports are look at it any you can’t ever look at one report and know what’s going on you have to look at the collection of all
45:21 have to look at the collection of all the sum of all reports and then you’ll know how to how to build things there’s a lot of pie charts well what what feedback is missing in this right so to your point there Tommy like they’re all pie charts what if what if that I to me at the end of the day it’s whether or not these reports deliver value to people it it’s at the end of the day it’s whether or not these reports can give people the information they need and do their job so if we don’t have some feedback loop on
45:51 don’t have some feedback loop on if we’re trying to autogenerate these things if we’re trying to like there this is why the report design process exists to your point Seth right you get a first swing it here it is the faster I can get to the first swing or the first product I can then spend more time okay here you go business look at it check it out oh that’s not what you wanted okay let’s talk let’s talk about what was missing here what did we what do we not quite get right and then add to that report a couple other visuals maybe it’s another page maybe some other things in it so this is not a to your point I think earlier what you’re
46:22 your point I think earlier what you’re alluding to is this is not a one and done this is not a a formula I can follow and just get done I I think there is needing to be some iterative processing and building on top of this but there but there is there is common patterns that could be applied here and I think about all the what I get very Not Bent about but I what I have trouble with is the the collection of knowledge of all the people on YouTube showing you how to build like one guy I love is BOS BOS is doing an amazing job of like here’s how to build this amazing visual click all
46:52 to build this amazing visual click all these buttons on one hand I love learning it on the other hand I’m going I don’t want to spend a lot of time clicking these buttons every single time I want this visual to look this way like I want it to be like this is the what I want the visual to look like keep it save it hang on to it like I I think about all these really neat people I I did a great thing save all my work yes yes that’s I I think there’s no there’s no good medium by which
47:23 no there’s no good medium by which really good designers and this is what we said Seth in the past with report design there’s going to be a handful of really awesome report designers who going to make stunning incredible looking reports the broadest largest part of the community is not going to have the time or the skills to get to that level all the time so what we need is we need to take the smartest people that are building the best looking visual thought out design things and package them and give them out and
47:45 package them and give them out and distribute them as easily as we can that’s the value of spending time at the at doing those really intricate one visual design things because now you can just reuse it this is the same same thing with denb this is why denb galleries of things are amazing like it’s great there’s a spec that defines the visual Styles and all like that’s awesome that’s very easy to repeat and replace and to me to be honest what denb has done is what powerbi should be doing not not the
48:15 powerbi should be doing not not the visual as code but when you take a denb template and load it into your model it knows you’re bringing a new denb template to your model and it knows if the measure exists I replace it with already with is already there if the measure does not exist that says wait a minute I can’t find this measure please go find me a new one to replace this value and there’s a description of it this measure should be a categorical value of something that is against this numerical value like it it show it you can tell the user how to build the visual that’s what you want that’s that
48:46 visual that’s what you want that’s that is the experience that’s the part that solves this problem sorry I’m getting really excited about this anyways anything else you want to I think we’re getting close on time here do you want to start wrapping and get some final thoughts on this yeah I I think we touched on maybe a paragraph overall of the article in terms of what else it describes but I think that really goes to show I think us and really where our conversation
49:16 us and really where our conversation went that my my quick recap is going to be on and I think this whole episode felt like on a hot take so we we’ll pause there because I don’t know if I want to go any hotter than what we’re at now we’re we’re already on fire we’re already boiling okay but I just want to my hot take is look back what we the main items that we discussed today and it was really a consens more or less consensus or excuse me an agreement that my poy p pig moment around hey we
49:49 that my poy p pig moment around hey we love all the tooling out there we have a great workflow with powerbi we have a great workflow with design but if we’re going to do this we got to do it holistically and we’ve all talked about that and what our dream is and I think that goes to show for the three of us going on this call these are things that we are dealing with because we know that I can have the best development design process in the world but at the end of the day the end user doesn’t care about that how they’re going to trust
50:19 about that how they’re going to trust that connecting this in really streamlining this looking forward to what this brings my final thought is I disagree with you I think we did a pretty comprehensive overview of the entire article but that love it I guess is subjective but yeah I I think what this what this reinforces and outlines is having a process is going to help you regardless in in anything to speed up the next time you have to do it and this
50:50 the next time you have to do it and this is an approach that if you invest the time in a wellth thought out methodical way to build reusable things the next time you have to go build the thing it’s a lot faster the next time you have to reference something it’s a lot faster and there’s always value in that because then you scale up yourself and the work you can create create and the impact you can make in an organization as opposed to believing that you have to start from
51:22 to believing that you have to start from scratch every single time and when you start to think in those pattern ways your your your architectures and the way you build reports and all of those things start to change and become much more reusable and more valuable to the organization so it’s definitely worthwhile to dive in here maybe even further and deeper look at some of the the different tools the different formats that you might not be familiar with in the powerbi ecosystem start to familiarize yourself because I think as the tool
51:54 yourself because I think as the tool matures especially in the fabric ecosystem and with all of these other methods by which third parties can integrate with that ecosystem Etc I I think we solve this problem in in the next few years where a lot of the conversation points that are potential pain points today are part of a process or part of a tooling tool sets that make it a methodology that we consistently reuse and
52:24 that we consistently reuse and it fits into the a fabric ecosystem where hey the way we used to do things is now faster in the same way with report builds and the things hey the way we used to do things is now way faster because we’ve solved a lot of these pain points across the the the methodology I agree with that Seth I think and again Tommy to your point there around earlier I think a lot of the article does go through a lot of explaining how to do a lot of these Atomic habits and how to use tools to build that so I
52:54 use tools to build that so I think the main part of the me the article here is the top portion I think when we covered that very well I don’t think we really need to go into like how to click the buttons and a lot of that latter part of the article is around that so I do feel like we’ve covered a lot of this what I’m excited about is there is some fundamental concepts here that are not yet being addressed by either the community or have not been addressed by the tools that have been made today I’m looking forward to seeing where that completes the full circle and Things become more relevant in that that broader ecosystem how does that tooling
53:25 broader ecosystem how does that tooling continue to mature over time time I would really if if I had to be pointed about this one I really wish Microsoft would pay attention to this article and this might be part of the reason why sqlbi is doing it because Microsoft’s not paying attention here but if you could give us some very simple ease of use features around copying visuals from one model to another where you will give me a Minimum a dialogue box of these columns these measures do not exist and allowing that
53:56 measures do not exist and allowing that to be more of a transferable item or object I think that would be very beneficial to the powerbi product and Tool so something has to be there or imagine clicking on visuals in existing reports and saying make a template right click make template about it and it gives you a little bit of information about how you make this a template and then you becomes part of your library that you have in powerbi to me there’s something very powerful with that and and that to be honest that would be a major speed Improvement on many reports
54:27 major speed Improvement on many reports being able to make your own visuals that are templates themes that are templates and then being able to reuse those objects anywhere you want on any report which makes a lot of sense so anyways I think there’s something there there’s an idea there that needs to be refined maybe we’ll be able to produce it and figure it out at some point but you never know we’ll see who comes out with it you heard it here first when it when this so we’re claiming it now we’re just claiming it now when the idea comes out and there’s a tool that does this we’re like this is the idea initiated from this and from
54:57 the idea initiated from this and from this podcast so whatever day this thing comes out on we’re going to Mark mark my words in a year from now we’re going to have a tool that does exactly what we described here on this canot wait cannot wait and and then we’ll finally have Tommy come back and we’ll we’ll get rid of his large language model it could just it could just be simple too right just replace with measure replace with because like have have all of the the the understanding of how that measure is used in the visual yep just be replaced
55:27 used in the visual yep just be replaced right it doesn’t have to be every like simplify it doesn’t have to be every single property all the different places all the configuration just replace this with this this with this this with this it works the definition of the measure is now an easy object we can extract in Json form directly from the model and if you have a pbip format we know exactly where to go get the single object that is the visual that is the Json it’s readable it’s it’s it’s Prime for a tool so let’s see what I can get my developers to start working on
56:03 today thanks guys weekend so thank you so much we really appreciate your ears on this one this is a great article highly recommend this read U really trying to unpack the the way to speed up your development this is really good love the article very well written thank you Kurt again for producing such a great work of art and thought provoking art article I’m not a deep thinker but this one helps me really think through what’s what’s the next thing and how to make things amazing here so really really appreciate it thank you very much where else can you find the podcast you can find us on Apple and Spotify or wherever you get your podcast make sure to subscribe and leave a rating it helps out a ton you
56:35 leave a rating it helps out a ton you have a question an idea or a topic that you want us to talk about in a future episode head over to power. podcast leave your name and a great question finally join us live every Tuesday and Thursday A. M Central and join the conversation all of power. tips social media channels excellent thank you all so much and we’ll see you next time [Music]
57:18 [Music] out