Category: PowerBI.Tips Tools

  • Power BI Version Control – Ready to use solution

    Power BI Version Control – Ready to use solution

    Power BI Version Control is a free, fully-packaged solution that lets users apply version control, local editing, and manage PBIX or PBIT files. The solution runs entirely on Power Apps (Power Platform) and SharePoint. Power BI Version Control can give business users or smaller organizations the ability to easily implement and utilize version control for their Power BI projects.

    Note: updating the app version will require you to re-import the SharePoint connection and folders.


    DOWNLOAD HERE

    The latest version is 2.0.1


    In this Article


    What is Power BI Version Control?

    In most version control systems, branching is a method to make edits to code in a safe and reliable way. Typically, users “branch”, or copy, the code to their local machine to make edits. They can then “merge” the code back to the master code, adding comments of what has changed and who changed it. Each change is saved as a different version, with the ability to go back to any version. Small, frequent changes are helpful, making it easy to undo any errors. This type of version control requires that every file be saved in a plain text format, so the differences between two versions of the same file can be easily identified, cherry-picked, merged, etc.

    However, unlike pure source code, Power BI reports are packaged into PBIX or PBIT files, which cannot be compared against each other in the way we just described. This makes it much harder for multiple users to work on the same set of files simultaneously. While it is possible to use Azure DevOps, GitHub, etc. as a version control solution for Power BI reports, it’s difficult to setup and use (especially for non-technical business users). The Power BI Version Control solution bridges that gap by harnessing SharePoint’s built-in file versioning and the user-friendly UI/UX of Power Apps.


    Why use Power BI Version Control?

    Single shared location for reports (no emailing files!)​

    Keeping all of your Power BI report files in SharePoint means that you’ll always know where to find them, and that they’ll always be the latest versions of those files.

    Keep all versions of the report (no adding numbers to file names!)​

    We often want to keep files from the past in case we need to roll back changes. Instead of adding version numbers or initials to the file names (like Sales_Report_v2.5_Final(1)(1).pbix), SharePoint will keep all versions of your report files automatically. Additionally, by using this Power BI version control method, it is possible to roll back to any of these versions whenever needed.

    Ability to check out files exclusively, like a library – only one person can make changes at a time

    When working in teams, you may have multiple people working on a project (see this post on Power BI team members). If you have more than one person who may edit a file, we want to make sure they are not trying to do it at the same time. Power BI Version Control ensures that only one person can check out any given file at once. As a result, nobody else can make edits to a file that you are working on. No more conflicts or working on outdated versions of files!

    Ability to check-in files – add comments describing changes made since the last check-in

    ​After making edits, we want to be able to keep comments about what was changed. With each version we are able to add a description of what has changed since the last version.

    Work locally – make all changes on copies, so we do not edit our files directly

    Another important benefit of Power BI Version Control is that we always work on copies of our reports. We can save and experiment as we work on the files, knowing that we will not accidentally damage a live report. We do all work locally on our machine and separate to our production or live reports. If needed, we can discard all changes and start again.


    How to use Power BI Version Control

    Power BI Version Control – Installation Instructions (YouTube)

    Installing the App

    • Download the Power BI Version Control app solution file (from the link near the top of this page)
    • Navigate to https://make.powerapps.com/
    • Ensure the correct environment is selected
    • On the left menu bar, navigate to Solutions
    • Select Import on the top menu bar
    • Select browse and chose the PowerBIVersionControl_2_0_1.zip file you just downloaded
    • Click Next and Next again until you reach the Connections screen
    • If you have existing SharePoint connections you wish to use (recommended), you can select them from the drop-down list. If not:
      • select + New Connection.
      • Select how to connect (usually recommended to Connect Directly)
      • In the new page that opens, click create and sign in if prompted
      • Once created, you can close the current tab and navigate back to the import screen
      • Click refresh then select the new connection from the drop-down list
    • Click Import. This step may take a few minutes to complete

    Configuring the App

    • Navigate to https://make.powerapps.com/
    • Ensure the correct environment is selected
    • On the left menu bar, navigate to Solutions
    • In the list of Solutions, find Power BI Version Control
    • Click the ellipsis and select edit
    • The app will now open in edit mode
    • Add the SharePoint folder by following the following steps:
      1. Open the data sources tab
      2. Select Add data
      3. Type “SharePoint” in the search bar
      4. Select SharePoint (note: be careful not to select “SharePoint Sites”)
      5. Choose the SharePoint connection you selected earlier
      6. In the pane that opens, enter the URL of the SharePoint site. This should be in the format:
        https://DOMAIN.sharepoint.com/sites/SITENAME
      7. Click Connect
      8. Choose the correct Document Library and click Connect
    • Select the tree view and navigate to the Settings Screen
    • Fix any red X marks on the page by updating the settings to match your folder structure (as described in the next section). If you used the default folder and document library names you should not need to update any settings

    Setting the connections

    • There are four numbered blue boxes that may require updating. If you see any red X marks next to any of the following boxes, click on that box and update the required property.

    1.

    Click this box and make sure Items is selected. Update the text to match the document library name (this is also the name of the data source you imported earlier). Use the IntelliSense (auto-complete) to ensure the correct value is selected. The text should turn green when correct, and the red X should disappear.

    2.

    Click this box and make sure OnSelect is selected. The formula should read Refresh(‘[Your Document Library]’). Update the text to match the document library name (this is also the name of the data source you imported earlier). Use the IntelliSense so ensure the correct value is selected. The text should turn green when correct, and the red X should disappear.

    3.

    Click this blue box (not the label) and make sure Text is selected. Update this to the checked out folder name, surrounded by double quotation marks.

    Note: if you add a forward slash to the end of the folder name, this will add all checked out folders to the same folder. Otherwise, a sub-folder will be created for each user based on their user ID.

    4.

    Click this blue box (not the label) and make sure Text is selected. Update this to the published reports folder name, surrounded by double quotation marks (e.g. “Published Reports”).

    • Check that there are no red X marks. A red error message will also show at the bottom of the screen if there were any errors in setup. Resolve all errors before publishing.
    • Click File then Save
    • After the app has saved, click Publish to ensure all changes are deployed

    Using the App

    Power BI Version Control – User Instructions (YouTube)

    We recommend embedding the Power BI Version Control app in a Teams channel. Additionally, the SharePoint site can be added to the Files section in Teams. This will allow all appropriate members to access the Power BI Version Control app and report files in one place.

    Check Out

    • Open the Power BI Version Control app 
    • Click the Check Reports Out button on the Home Screen 
    • The Check Out Screen will list all PBIX and PBIT files in the Published Reports folder. Select the reports you wish to modify in the Check Out Reports column. You will only be able to check out reports that are not already checked out
    • Click Check Out Reports button
    • Wait a few moments for the reports to process. It may take longer if using large files

    Editing the files

    • Navigate to the OneDrive folder on your local machine. The selected reports will appear in the synced folder Checked Out Reports (or sub-folder)
    • You can now open and edit these files. If using live connections, consider using the Hot Swap Connections Tool
    • If you want to save copies, you can do so in a sub-folder or elsewhere on your local machine. Avoid this when possible. We recommended to make small and frequent updates / check-ins
    • When ready, make sure only the files that are ready for check-in are saved in Checked Out Reports (or sub-folder). Make sure the names of files have not been altered
    • If you manually publish reports, publish immediately before closing and checking in

    Check In

    Once edits are done, Check In the reports from the Checked Out Reports folder to the Published Reports folder. Alternatively, you may wish to discard your work. As a result, this will release the file and ignore any changes you have made. Next, it will delete the file from the Checked Out Reports folder.

    Commit changes:
    • Open the Power BI Version Control app 
    • Click the Check Reports Out button on the Home Screen 
    • This will list all PBIX and PBIT files in the Checked Out Reports folder. Select the reports you wish to Check In in the Check Out Reports column. You will only be able to check in reports that are checked out to you
    • Make sure to add comments. Include details on changes you made. If using Azure DevOps, Planner, or some other project management tool, include the relevant ticket/task number(s) in your comments whenever possible
    • Click the Check in reports button
    Discard changes:
    • Navigate to the Check In page by the button on the main page
    • This will list all PBIX and PBIT files in the Checked Out Reports folder. Next, select the reports with changes that you wish to discard in the Discard Report column. You will only be able to discard reports that are checked out to you
    • Confirm Discard

    Helpful Tips

    Also included in the app is a flow called Initial Step: Create Power BI Reports Library with Folders.

    • Open the flow and select Run
    • Paste in your SharePoint site where you wish to create the folders, site e.g. https://powerbitips.sharepoint.com/sites/powerbi

    Running this will automatically create a library and folders in your desired site. It will use default names, which means you will not need to configure the app in the settings page after connecting to the data source.

    Sync Folders

    You should sync the Checked Out Reports (or sub-folder) that was created to your local machine’s OneDrive, allowing for local edits. If using sub-folders, you must check out a file once to create the folder.

    Ensure to sync only the Checked Out Reports folder (or sub-folder).

    You can sync either through SharePoint or through Microsoft Teams.

    From SharePoint:
    • Navigate to the correct SharePoint site
    • Select Documents and navigate to the Checked Out Reports (or sub-folder)
    • In the toolbar, select Sync
    From Teams:
    • Open the Teams channel
    • In the toolbar, select Files and navigate to the Checked Out Reports (or sub-folder)
    • Select Sync

    You can also add the files to an existing team by selecting Add Cloud Storage.
    Note: See more info on syncing here.

    You can now access the files in this directory from the local machine.


    Limitations and Scope

    Known issues:

    The app will fail if the internal SharePoint name and the Display name do not match. This happens when a SharePoint site is created, and the display name is manually changed later. We are working on a patch for this.

    If you have a very large number of reports, the app may not display all of them. We are working on a patch for this.

    Design:

    This solution is designed to handle thin report files, and not large models. The solution will copy and publish to one single folder, and is not intended to manage environments (e.g. dev / test / prod). It should be connected to a Development environment, we recommend using Power BI Deployment Pipelines to deploy reports from Dev to Test, and from Test to Prod.

    The Power BI Version Control app solution performs these main tasks:

    • Check out and lock editing to a single user
    • Copy files to a local synced folder for safe editing
    • Keep version history and enforce developer comments on each check-in

    If you like the content from PowerBI.Tips please follow us on all the social outlets. Stay up to date on all the latest features and free tutorials.  Subscribe to our YouTube Channel.  Or follow us on the social channels, Twitter and LinkedIn where we will post all the announcements for new tutorials and content.

    Introducing our PowerBI.tips SWAG store. Check out all the fun PowerBI.tips clothing and products:

    Check out the new Merch!

    Hasta La Vista Data
    Go Ahead Make My Data
    PBIX Hat


  • Power BI Field Finder V2

    Power BI Field Finder V2

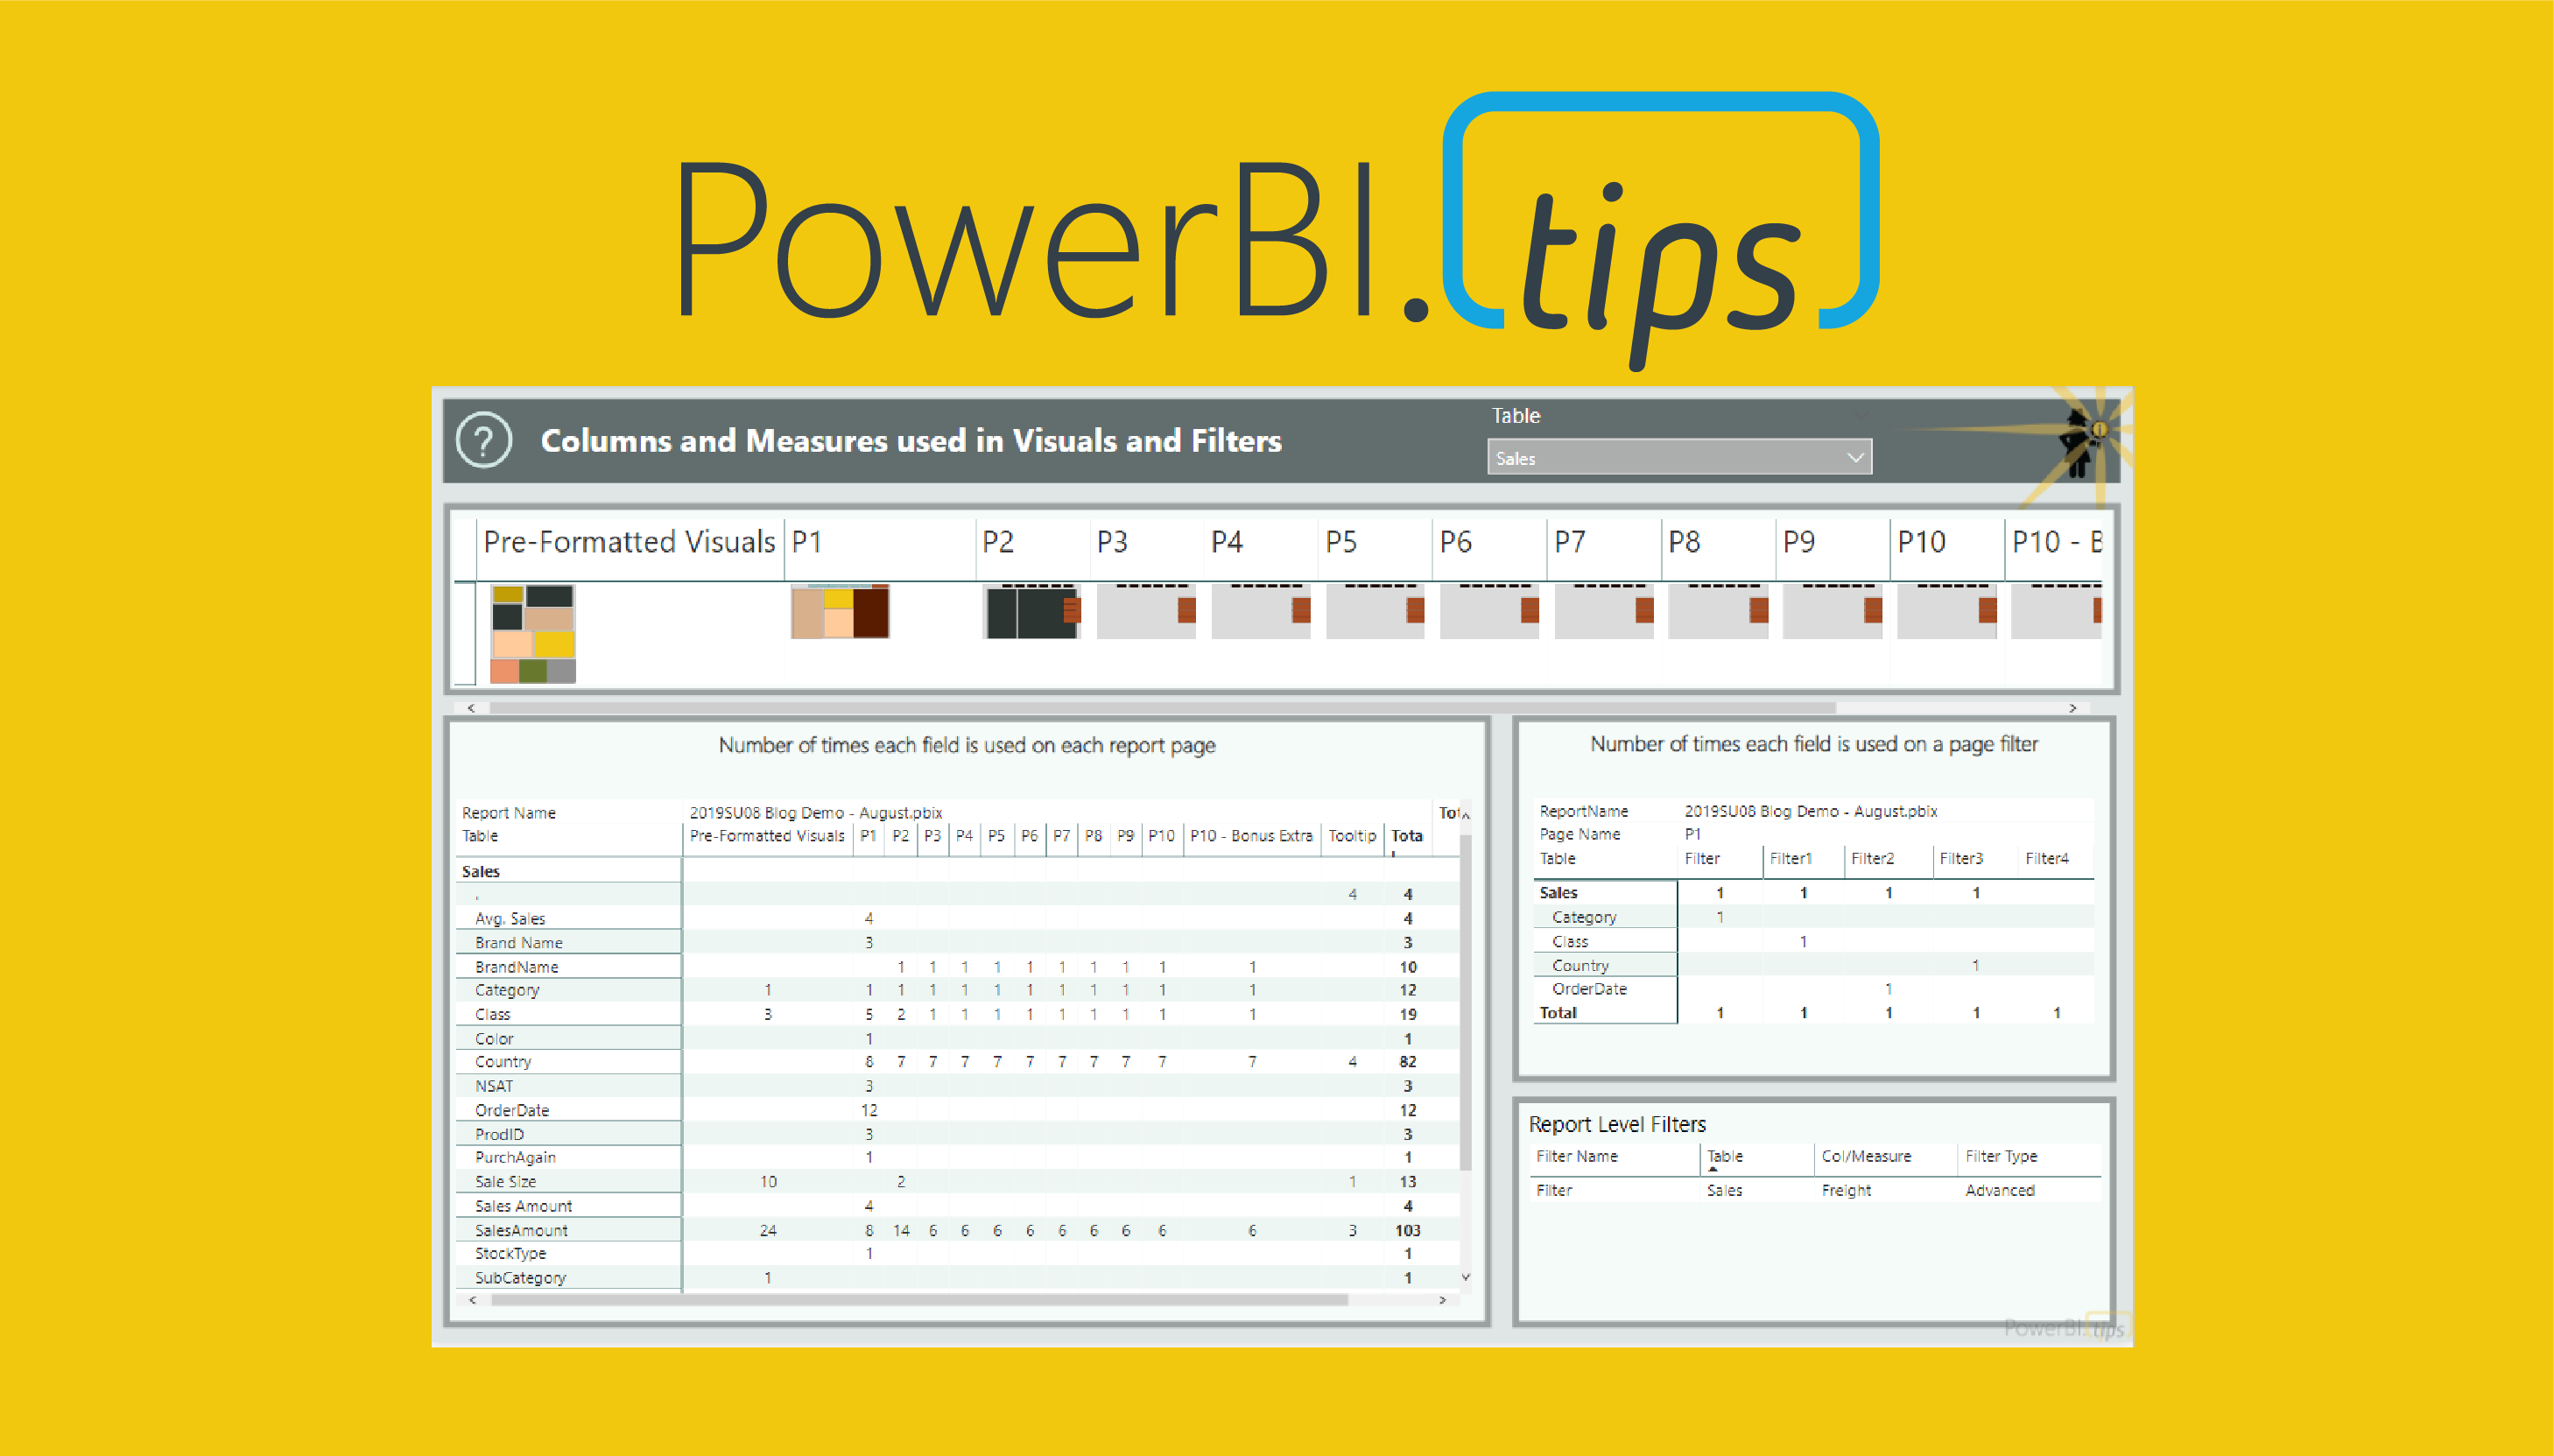
    The Power BI Field Finder created by Stephanie Bruno was just updated. In this recent update the HTML viewer has been updated since the old custom visual has been deprecated.

    What is Field Finder?

    We are glad you asked. The Power BI Field finder is a tool that can be used to review all the relevant connections between tables, measures and visuals within a report. This solution is easy to use and very informative. Simply point the Field Finder at a PBIX file. Then the Field Finder tool will de-construct all the visual elements of the report and digest them in to one complete data set.

    Why do I need it?

    If you have done any Power BI development over the years, you will notice a pattern.

    • Start building a report
    • Create some measures for a visual
    • Measures don’t work or report needs changes
    • Make more measures
    • Delete and replace visuals
    • Add visual styles and elements requiring additional measures
    • Finally publish report

    After completing this process, which could be over the span of days to months. You will likely have a Power BI report with extra measures or un-needed calculated columns.

    Then you are introduced with a problem, How do I go through and clean up the entire report? Do I need to click on every single visual to see which measures are used?

    Doing this for a page or two you quickly are overwhelmed with tracking all that information. This is where Power BI Field Finder really shines. It handles all of that for you with a couple button clicks.

    Download Power BI Field Finder

    Be sure to download field finder for yourself.

    If you like the content from PowerBI.Tips please follow us on all the social outlets. Stay up to date on all the latest features and free tutorials.  Subscribe to our YouTube Channel.  Or follow us on the social channels, Twitter and LinkedIn where we will post all the announcements for new tutorials and content.

    Introducing our PowerBI.tips SWAG store. Check out all the fun PowerBI.tips clothing and products:

    Check out the new Merch!
    Hasta La Vista Data
    Go Ahead Make My Data
    PBIX Hat


  • One Tool to Install them ALL

    One Tool to Install them ALL

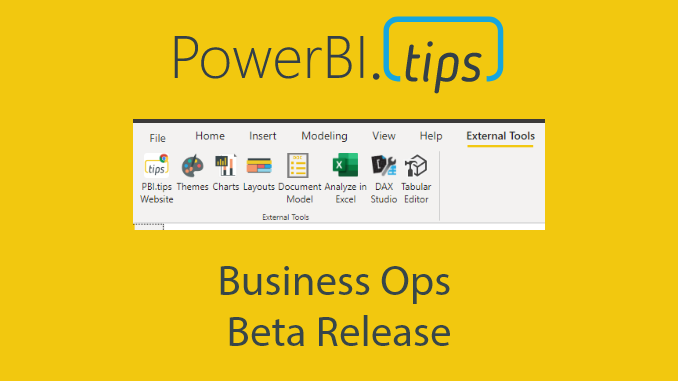
    We are excited to announce a new tool from PowerBI.tips The Business Ops tool. To get this tool Download it here.

    For the Full Story Read on..

    There are many exciting features that we love to see and share when it comes to monthly Power BI releases! The continual improvements still inspire and provide a deeper and richer experience for us all to WOW our report consumers. There are some periodic major changes that come, and we think one of those has arrived with the latest announcement of 3rd party tool integration.

    Add PowerBI.tips Front End tools

    After the great news above, we had our heads down looking at the documentation and were very interested in how we could add our own tools to the External Tools section. After some digging, and reviewing a fantastic blog by Eric Svensen we locked in on how we could our tools even more accessible for you!

    We want to help you get to your favorite PowerBI.tips tools quickly and easily. What follows is what each of these tools offers, and how to easily connect one or all into your Power BI Desktop files for quick connection and use.

    I don’t see “External Tools”

    The first requirement to see the External Tools section is that you must be on July 2020 Desktop. You will NOT see the External Tools section right after you open it. The reason for that is varied, but suffice to say, you need a specific JSON folder created in your Power BI folder structure and an executable to run.
    We’ve made this easy for you, so just read through our choices of tools and we’ll walk you through how to get these buttons created and working for you in no time!

    Tool Choices

    PowerBI.tips – Part of staying engaged is staying current. What better way to do that then start everyday with a link to your favorite site – Power BI.Tips

    Themes – Need to take the general settings you can do in the Desktop to the next level? Adding our Themes capability into your reports gives you full control over the customization of color, font and properties.

    Charts – Utilizing the amazing work from MSFT research in Charticulator, we’ve created a version called Charts. This tool lets you build no code custom visuals that work right alongside the out of the box one’s. Check out our videos if this is new to you!

    Themes Gallery – Sometimes you just need to find a little inspiration. Look no further than our extensive gallery of color themes. Easily pick and download any color theme you find.

    Themes Gallery

    Charts Gallery – Learning how to build the custom visuals in Charts takes a little bit of time, but while you are learning that craft, or are looking for a unique visual check out the gallery of already built custom visuals you can integrate into your reports.

    ChartsGallery

    Layouts – Need to take your report look and feel to the next level? Our Layouts provide some of the best looking backgrounds tailored specifically to Power BI. We use pop up dialogues for contextual explanation, page navigation and hidden slicer functionality to amaze your end users.

    Scrims – Backgrounds for Power BI. We take all the principles we’ve learned in visual design to create amazing visual canvases that don’t distract from the data. Using these single images reduces the need to render all the different shapes and objects on your page making it a faster/better option.

    Model – Are you a data focused individual? Have you played with Power BI dataflows? Use our Model tool to create the metadata objects you want to utilize in your Common Data Model.

    Connections – Streamline your report files for other report authors by pre-configuring the data source connection. Not familiar with how you create PBIDS files? Check out our tutorial.

    Lingo – In 2018 Power Bi introduced the ability to edit the linguistics schema for enhancing your Q&A experience. This tool gives you a clean and simple interface to create and modify your schema.

    Pick Your Browser

    We know our favorites, but you probably have yours as well. Throw in a dash of IT security and you might not have the best experience with a chosen browser. As we know that is the case, you can choose one of our 3 options for kicking off these tools from the Desktop and opening the right browser.

    Install Your Favorites!

    Featured External tool tutorials

    Want to know more about the featured tools in the MSFT blog? We had the chance to welcome the creators of those tools to tell us all about them. Be sure to check out the webinars for all the details on how to get started with them and all the capabilities they offer.

    ALM Toolkit – Schema compare and deployment tool. Fantastic for Application Lifecycle Management (ALM). How to use ALM Toolkit.

    DAX Studio – The only DAX authoring tool you will ever need. 5 part series that explains it all.

    Tabular Editor – An amazing modeling tool that makes working with your model a breeze. 4 part series.

    If you like the content from PowerBI.Tips please follow us on all the social outlets. Stay up to date on all the latest features and free tutorials.  Subscribe to our YouTube Channel.  Or follow us on the social channels, Twitter and LinkedIn where we will post all the announcements for new tutorials and content.

    Introducing our PowerBI.tips SWAG store. Check out all the fun PowerBI.tips clothing and products:

    Check out the new Merch!

    Hasta La Vista Data
    Go Ahead Make My Data
    PBIX Hat


  • Monkey Tools are AWESOME

    Monkey Tools are AWESOME

    The Monkey Tools add-in for excel is really amazing. As a developer for Power BI for many years I’ve learn a ton of tips and tricks while working with Power Query. Watching Ken demo the high level of automation that Monkey Tools really blew my mind. How did I not know about this tool earlier?! My development patterns have now forever changed.

    This presentation for Monkey Tools is presented by it’s developer MVP Ken Puls. Ken is a staple and expert in the Excel community. Not to mention, he is an incredible presenter. You will enjoy this session from Ken.

    What are Monkey Tools?

    Monkey tools in short is a simple way to automate data modeling within Excel. There are some incredibly helpful portions such as making date calendars, changing how data is handled during Power Query loading process and many more.

    Ken gives us a great overview and starts digging into the amazing features of this tool in this two part series about this tool.

    Download Monkey Tools Here

    Intro to Monkey Tools – Part 1

    Intro to Monkey Tools – Part 2

    Follow Ken

    Blog: https://xlguru.ca/blog
    Facebook: https://facebook.com/xlguru
    Twitter: https://twitter.com/kpuls
    Linkedin: https://linkedin.com/in/kenpuls

    Training

    Online Training: https://Skillwave.training

    Book by Ken

    Master Your Data with Excel and Power BI: https://amzn.to/2PyheVm
    M is for (Data) Monkey: https://amzn.to/30BElov
    RibbonX: Customizing the Office 2007 Ribbon: https://amzn.to/3fzPDh1

    Download Monkey Tools

    https://xlguru.ca/monkeytools

    If you like the content from PowerBI.Tips please follow us on all the social outlets. Stay up to date on all the latest features and free tutorials.  Subscribe to our YouTube Channel.  Or follow us on the social channels, Twitter and LinkedIn where we will post all the announcements for new tutorials and content.

    Introducing our PowerBI.tips SWAG store. Check out all the fun PowerBI.tips clothing and products:

    Check out the new Merch!

    Hasta La Vista Data
    Go Ahead Make My Data
    PBIX Hat


  • No Code Custom Visuals – Webinar

    No Code Custom Visuals – Webinar

    This month we did a webinar with the Microsoft team on how to build different custom visuals in Charts.PowerBI.Tips a version of Charticulator.

    If you haven’t seen Charts.PowerBI.Tips this video explains the program, all the functions of each button and building demos. We walk through all the buttons on the tool bar and what they do. Finally we build multiple different charts. Check out this webinar if your curious about building custom visuals with no code.

    I want to give a super big thank you to the Microsoft team especially Kelly Kaye for making this video happen.

    Thanks for watching and have a Wonderful Day!

    If you like the content from PowerBI.Tips please follow us on all the social outlets. Stay up to date on all the latest features and free tutorials.  Subscribe to our YouTube Channel.  Or follow us on the social channels, Twitter and LinkedIn where we will post all the announcements for new tutorials and content.

    Introducing our PowerBI.tips SWAG store. Check out all the fun PowerBI.tips clothing and products:

    Check out the new Merch!

    Hasta La Vista Data
    Go Ahead Make My Data
    PBIX Hat


  • Introducing Scrims

    Introducing Scrims

    PowerBI.tips is excited to announce our new tool to help you build the best looking reports, Scrims.

    We’ve built out a fast and easy solution for snapping visualizations into place while giving your reports the extra special look and feel that allows your audiences to be impressed without losing focus on the important stuff. We developed Scrims to give you this shortcut to amazing looking reports

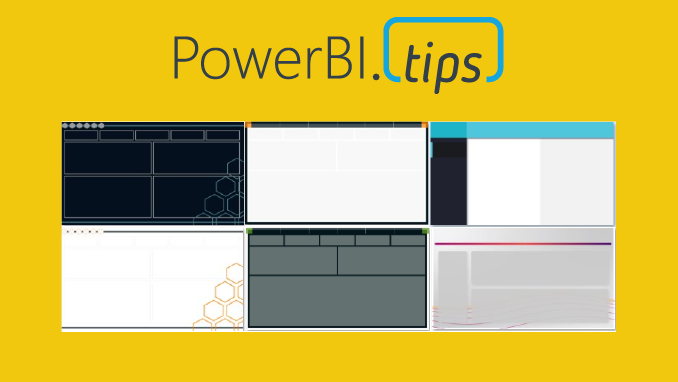
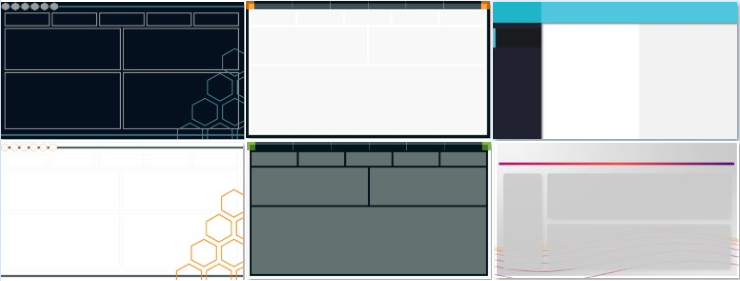
    16:9 (1280 x 720) examples

    What are Scrims?

    A Scrim is a background image that you would use on your Power BI Report pages. Why the name Scrim? The term scrim is used in theater productions. It is a backdrop that is placed on the stage behind the actors. It adds context & engages the audience with the production. We thought this idea crosses over well with Power BI.

    A scrim can change the mood of a theater just like a well designed background image in your report. Scrims were developed to be easily adaptable to different color themes and in each set of offerings we release we’ll be providing you with as many color options as possible.

    Why Do I need One?

    Scrims solve several problems.

    1. The most important problem it solves is time. As BI practitioners ourselves we know the demands that are placed on you. More often then not the visual look and feel gets the least amount of attention due to deadlines. We want all the time you invest in the data and building visuals to impress your audiences by being presented in a beautiful way.
    2. Scrims are designed the same way we developed Layouts. By emphasizing proper design focused on the Gestalt design principles to ensure the end users experience enjoyable and non-distracting reports.
    3. Using a Scrim you will reduce the number of objects on the page. Less elements means faster rendering reports. Here is a blog that tests this by adding more visuals to a page “More Visuals Mo Problems”. Scrims add the illusion of a very large number of objects without a negative impact.

    Scrims come in a Bundle

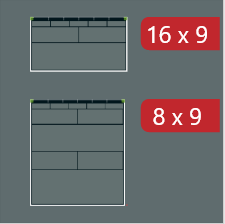
    A Scrim bundle contains a series of images that you can use in any way you want in your Power BI file. Each Scrim will have different page sizes to best suit your report needs. Every Scrim will contain a default 16 x 9 (1280 x 720) aspect ratio. Most Scrim bundles will have additional ratios such as 8 x 9 (1280 x 1440) or 4:3 (960 x 720). You will see the sizes prominently displayed for each bundle with the red tags.

    8:9 (1280 x 1440) examples

    Each bundle contains 6 pages minimum for each size, which means on average you will receive at least 12 pages in each bundle. Each Scrim bundle also includes the color theme that corresponds with it in JSON format to easily upload into your Power BI Report.

    Theme Color example
  • Scrims Instructions

    Scrims Instructions

    Thanks for your interest in our product Scrims. For more details on what is a scrim click this link to Learn More.

    Download a scrim from the products page. You can access all the available scrims here.

    Instructions

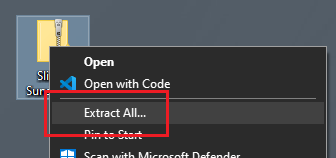
    After downloading, you will have a Zip file stored on your computer. Right Click on the zip file and Select the option Extract All from the drop down menu.

    Right click menu option Extract All

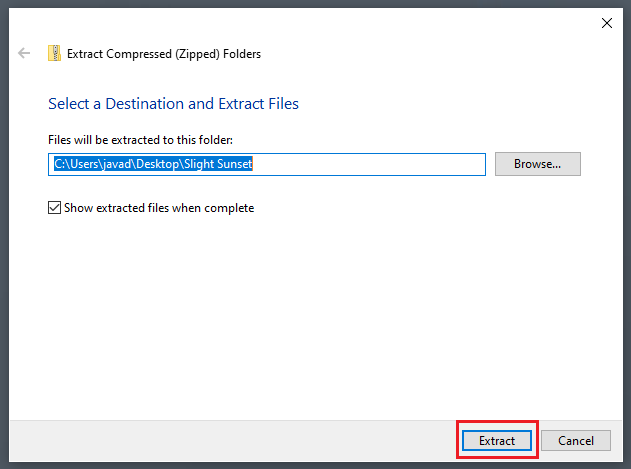
    The extract compressed folder menu will appear. Click on the Extract button found in the bottom right corner of the menu.

    Extract Compressed folder dialog box.

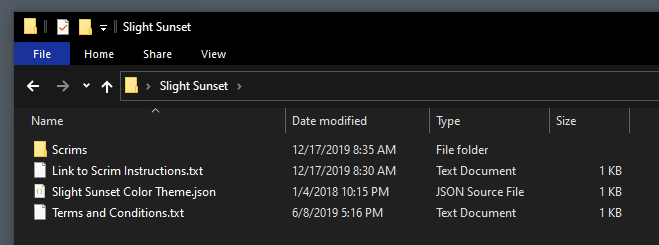
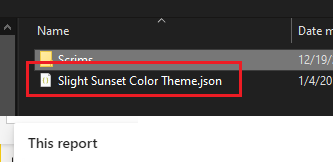
    A new folder will be extracted to the location noted in the previous menu screen. Open the newly created folder. Within this folder you will find all the images for the Scrims and a JSON theme file to use within your report.

    Folder contents, Scrims images, links to instructions, terms & conditions, and color theme file.

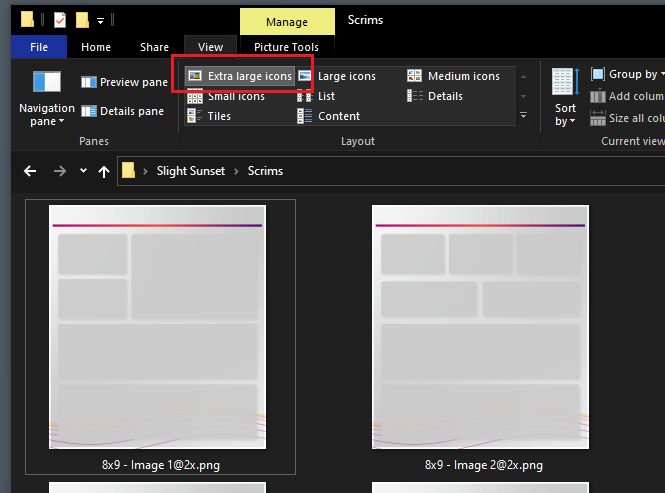
    When working with scrims it is helpful to see which image contains the the correct background layout for each of your pages. I find that it is helpful when reviewing images as Extra large icons. To turn this on, Open the View ribbon in the File Explorer. Then in the Layout window select the option titled Extra large icons.

    Change view of File Explorer to Extra Large Icons

    Add Scrims to Report

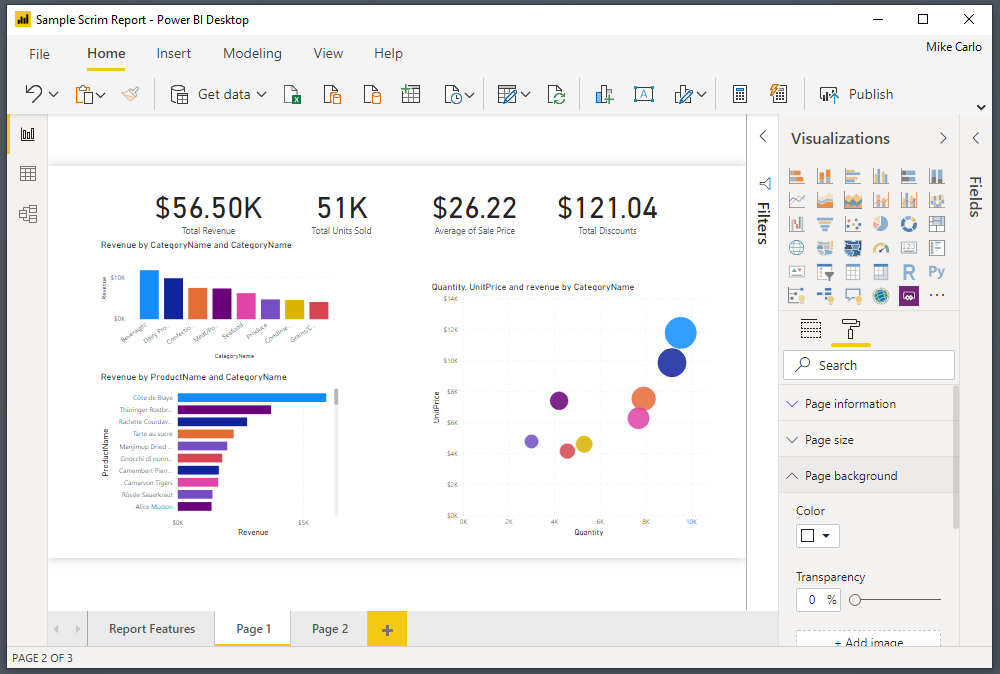
    Open a Power BI report in the Power BI Desktop application.

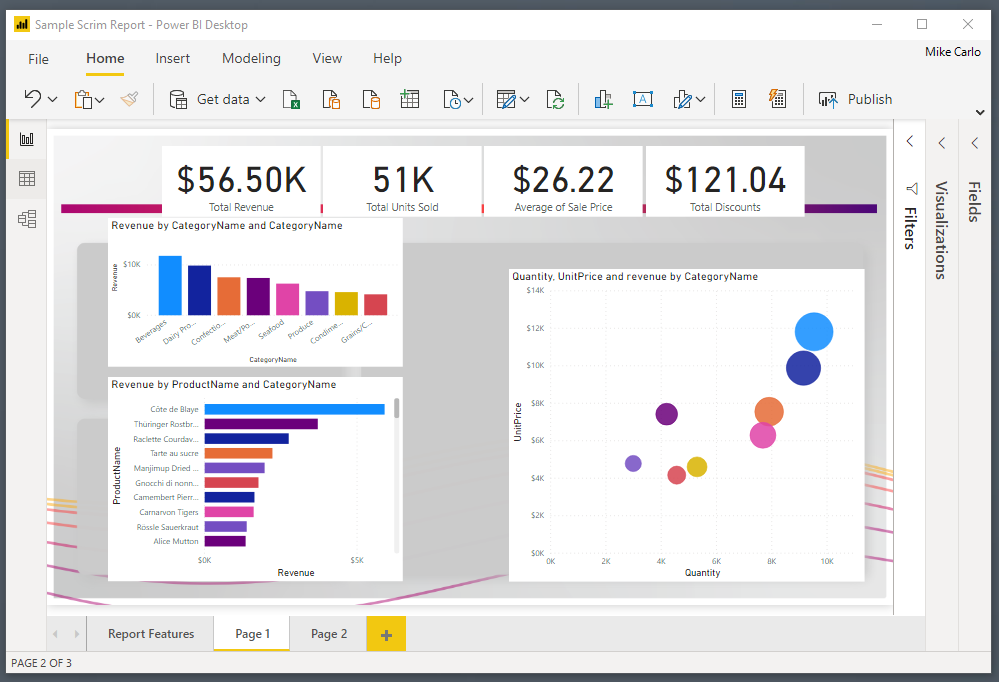
    Image of a Power BI report in Power bi desktop

    Note: Reports do not necessary have to be brand new. You can use scrims on existing reports. For illustration purposes an existing report was opened with only visuals. The remainder of this tutorial will show you how to add scrims to a pre-developed report.

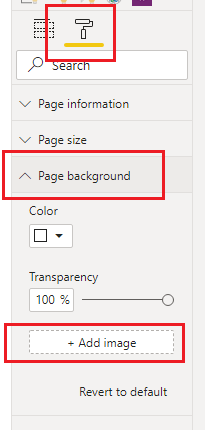
    Click on the Paint Roller button. Then Open up the Page background item in the menu options. Click on the option labeled Add image.

    Note: for these options to appear you have to have a report open and none of the visuals selected on the page.

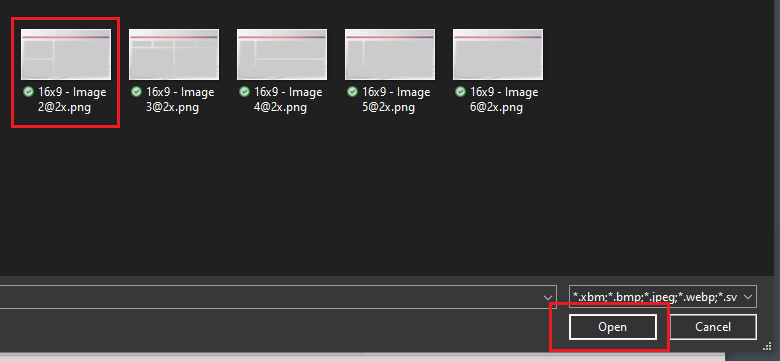
    In the open file selection dialog box pick the scrim that you want to load. Click on Open to load the image to the report page.

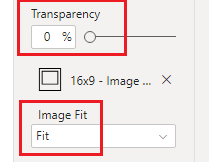
    The image will not initially appear. This is because the default settings for background are set incorrectly for this feature. Change the transparency to 0% and adjust the Image Fit to the drop down option of Fit.

    Note: Images provided in scrims are larger than the report page pixel size. This is because in order for the images to not look blurry we have to supply a larger image. The Fit feature then scales the image back down to the report canvas size but retains a crisp and clean look.

    Our report should now look similar to the following:

    Add JSON Themes

    Initially the visuals will not be formatted for the style of the report. We can control this by using a JSON theme file to pre-format some options for the visuals.

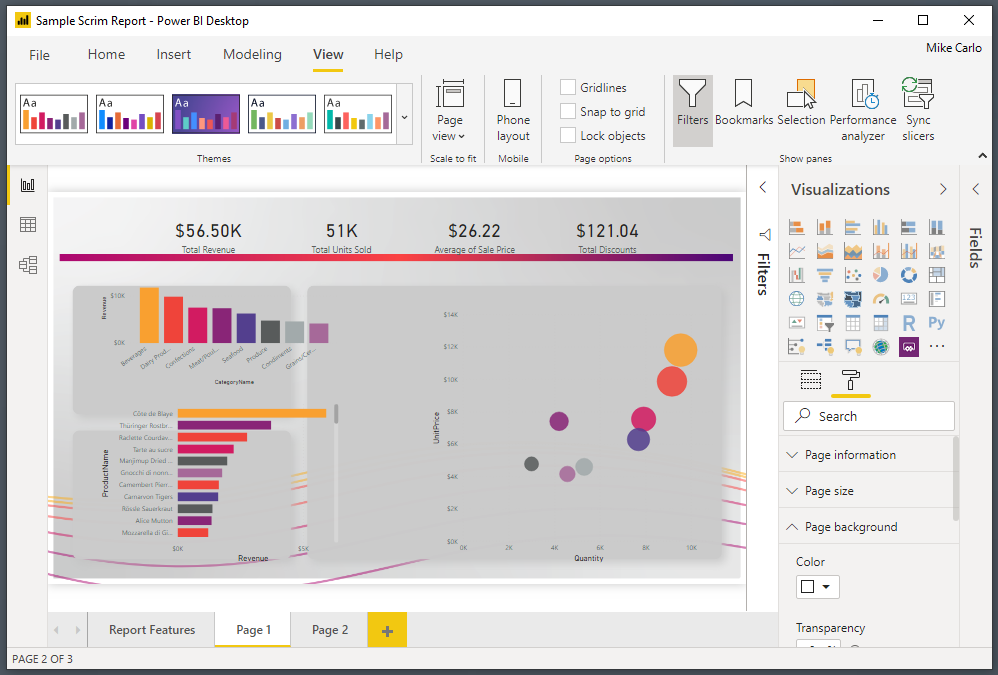
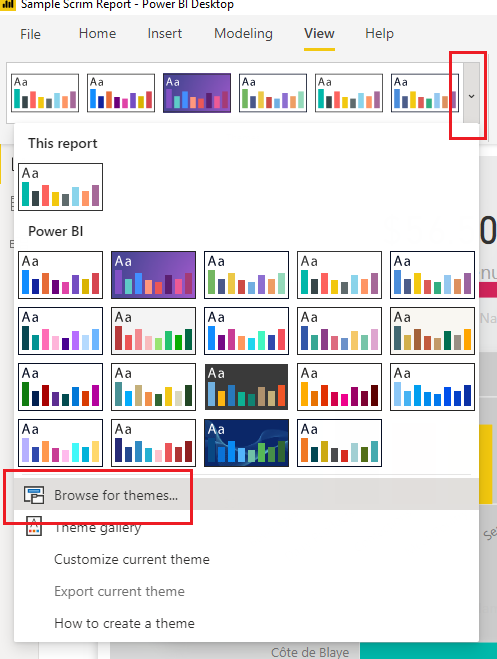
    On the View ribbon, select the Drop Down Arrow icon. Then Select the option at the bottom of the menu titled Browse for themes…

    Navigate to the scrims download folder and add the supplied theme with scrim download.

    This will apply formatting for the colors and some Visual style properties.

    Clean up Visuals

    Next Select individual visuals and Align them to the defined areas within the scrim.

    See sample image below with visuals aligned to the scrim.

    Finalize Report

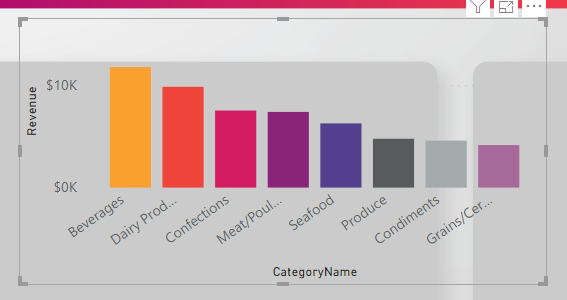
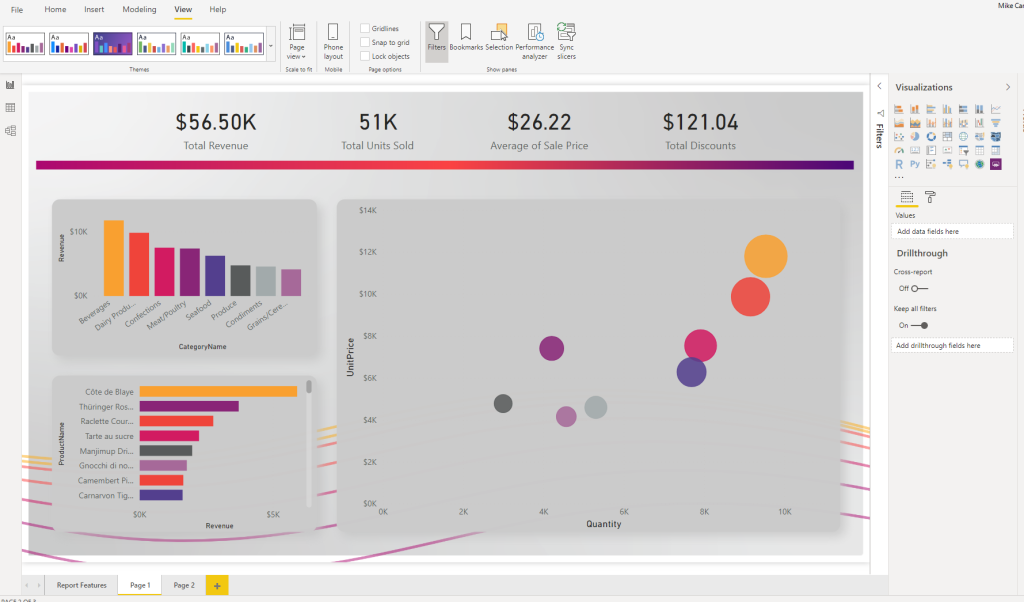
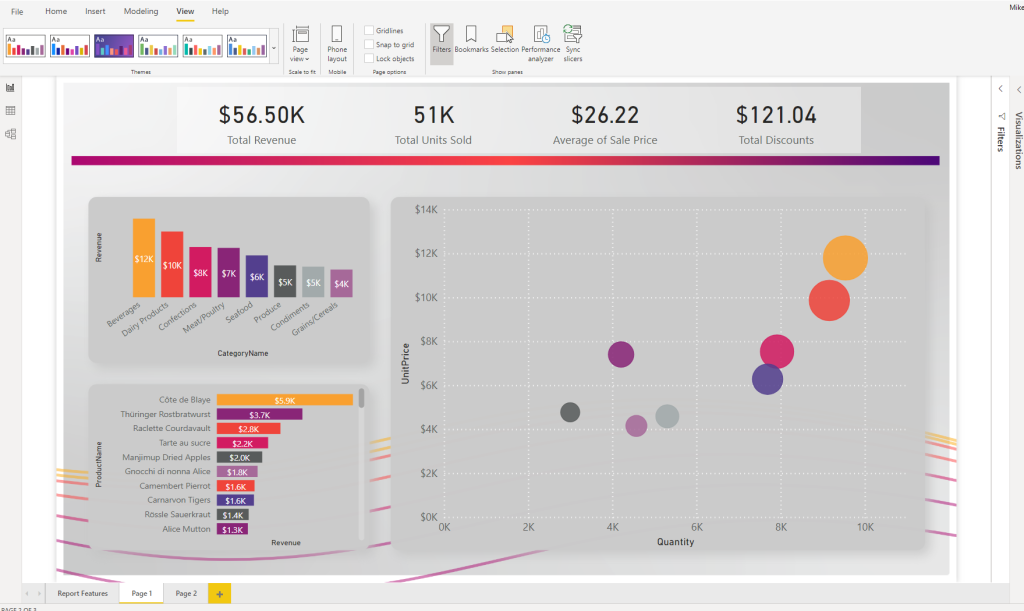
    Apply any additional style properties for your visuals. In the below image the following settings are added for reference:

    • The top 4 cards are grouped and the group
    • The Grouped cards were applied a background of white @ 40% transparency
    • Labels were added to the bar charts
    • Unneeded axis were removed from the bar charts for clarity
    • White lines were added to the scatter chart for x and y axis

    Then rinse wash and repeat for every other page you need to develop.

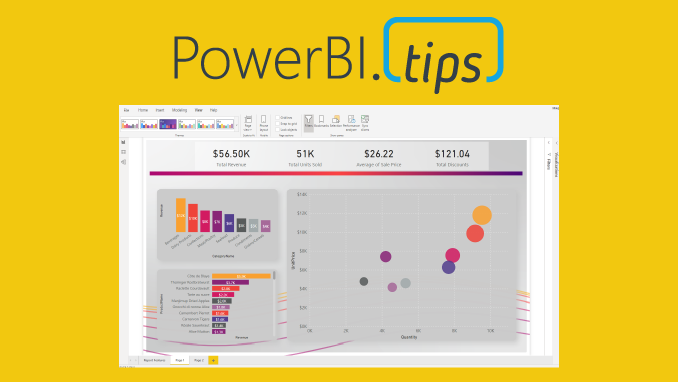
    Here is a completed sample of this report:

    Check out scrims today

  • New Layout – One

    New Layout – One

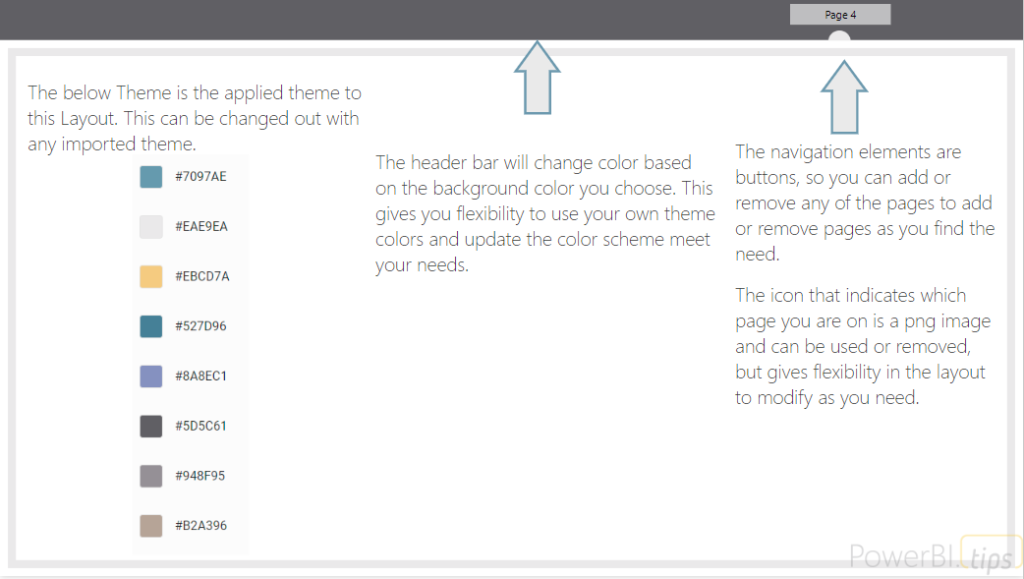
    This layout continues to deliver fantastic visual guides to make your reports look top notch. This layout utilizes buttons for navigation without locking in the position in the layout background. We also really like how this layout uses the theme templates to change the background header color to anything you would want. The semi-circle that indicates which page you are on is a free form image and can be changed around if you want to re-arrange the pages. Our branded layout gives you 5 pages of fun, while our unbranded version throws in 10 pages and includes all 10 background .png image files to make your report building even easier.

    Features of this report

    • Free documentation provided by PowerBI.Tips included on the Report Features page
    • 10 pages of different layouts – Unbranded
    • 5 pages with navigation built with buttons in the report (Easily swap out a different background)
    • 10 PNG images of all the backgrounds to use in this report or others – Unbranded
    • Navigation dot – included icon image for complete flexibility
    • Customizable top ribbon (color of buttons and background header are can be altered with themes)
    • No PowerBI.Tips Branding on any of the main report pages – Unbranded
    One – Capabilities

    Get a feel for all the page layouts and interactions available in this report by using the below example we’ve embedded via Power BI.

    Sample of report

  • New Layout – Square One

    New Layout – Square One

    “Square One” utilizes the color theme as a background component that adds a pop of accent color only. This gives you the end user the maximum flexibility to incorporate color themes that match your needs without drawing to much attention on the main part of the page. Click here to download

    The icons are part of the background so that the colors come through with the icons, but this also keeps the same flexibility in that if you have different icons, you can always place those behind the clear buttons placed on the report. We’ve only tied in 3 of the icons to buttons and bookmarks as the others can be added by you as you develop and build out the report.

    The idea behind the icons on the right follow two different thought patterns.

    First, a Summary, more granular, and then table views of data. In this vein, you would create a clear bookmark to re-direct to the different pages showing that level of information.

    Second, would be to create toggles on each page to view visuals in current state vs. over time and use the icons to flip between the two.

    Let us know your thoughts on this new layout idea, we hope you get a lot of use out of it!
    Sample of Report:

  • New Layout – Smooth Operator

    New Layout – Smooth Operator

    Hey everyone! We’re excited to release our latest layout “Smooth Operator”. Click here to download.  We’ve gotten some great feedback from our users and the previous layouts were a bit heavy handed as we tried to create a perfect experience with adding visuals. The difficulty of trying to link up a dataset to the x/y axis made some of those a bit burdensome. As a result, we’re going to streamline the layouts to be super easy to use but yet still providing as much enhanced value with bookmarks, areas for visuals, and using json themes to change look and feel of background and visual elements.

    We’re interested in your thoughts on this streamlined approach, so please let us know how you like the new layout – and expect more like it in the future!

    Sample of Report: