PowerBI.tips

New Layout – Square One

May 1, 2019 By Seth Bauer
New Layout – Square One

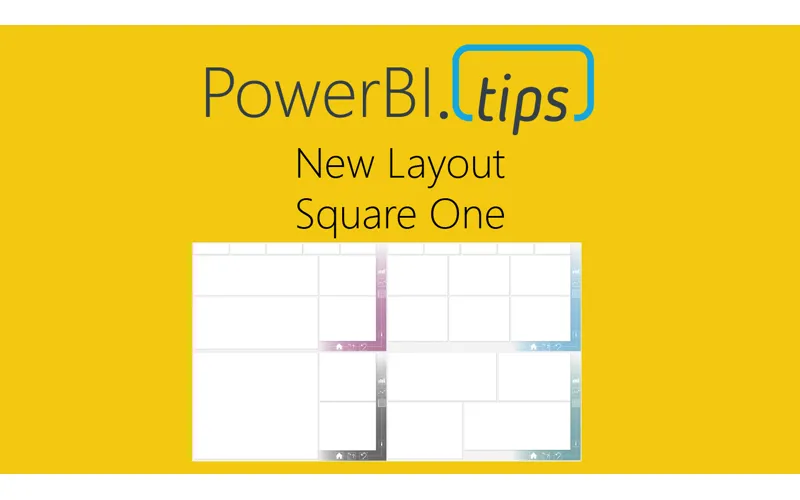
“Square One” utilizes the color theme as a background component that adds a pop of accent color only. This gives you the end user the maximum flexibility to incorporate color themes that match your needs without drawing to much attention on the main part of the page. Click here to download

The icons are part of the background so that the colors come through with the icons, but this also keeps the same flexibility in that if you have different icons, you can always place those behind the clear buttons placed on the report. We’ve only tied in 3 of the icons to buttons and bookmarks as the others can be added by you as you develop and build out the report.

The idea behind the icons on the right follow two different thought patterns.

First, a Summary, more granular, and then table views of data. In this vein, you would create a clear bookmark to re-direct to the different pages showing that level of information.

Second, would be to create toggles on each page to view visuals in current state vs. over time and use the icons to flip between the two.

Let us know your thoughts on this new layout idea, we hope you get a lot of use out of it!

Sample of Report:

Previous

New Layout - Smooth Operator

More Posts

Jun 10, 2026

Microsoft Build Recap – Ep.535

Mike and Tommy recap Microsoft Build 2026 through a Power BI and Fabric lens, focusing on the announcements that matter most for report builders, semantic models, and agent-driven app development. They unpack why Rayfin, Replit integration, OneLake, and new Fabric skills signal a shift from asking AI for answers toward using agents to create real production artifacts.

Jun 5, 2026

CI/CD Automation with Agents – Ep.534

Mike and Tommy explore how agents can simplify CI/CD in Fabric by helping teams work through Git workflows, merge conflicts, validation, and deployment automation. They also compare deployment pipelines with Git-based approaches and explain why small, testable automations are the safest way to start.

Jun 3, 2026

Claude Design & Power BI Embedded – Ep.533

Mike and Tommy explore how Claude Design, agentic workflows, and HTML wireframes could reshape report prototyping for Power BI teams. They also debate where today’s tooling still falls short, especially for Power BI Desktop users who need practical ways to turn context, design ideas, and embedded experiences into working reports.