The Impact of Explore (Preview) – Ep. 276
Power BI is great at guided consumption (reports and apps), but teams still need a safe way to answer the inevitable ad-hoc questions without turning every request into a new page in a report. The new Explore experience (public preview) is Microsoft’s attempt to offer that middle ground: quick, focused analysis on top of a governed semantic model.
In Episode 276, Mike, Tommy, and Seth react to Explore from an adoption and governance angle—where it fits, what it enables, and what has to be true (permissions, performance guardrails, and a clear UI workflow) for business users to actually succeed with it.
News & Announcements
- Introducing Explore (public preview) — The official announcement with screenshots, scenarios, and notes on how Explore works in the Power BI service.
- Submit a topic idea (Explicit Measures Podcast) — Tell the crew what situation you want them to unpack next.
- PowerBI.tips Podcast — Subscribe and explore the back catalog of Explicit Measures episodes.
- Power BI Theme Generator (Tips+) — Generate report themes that are consistent, brand-friendly, and easy to reuse.
- Mike Carlo (LinkedIn) — Follow Mike for Fabric + Power BI implementation insights.
- Seth Bauer (LinkedIn) — Follow Seth for engineering and platform operations learnings.
- Tommy Puglia (LinkedIn) — Follow Tommy for analytics patterns and Power BI content.
Main Discussion
Explore is described as a lightweight, focused experience for users to ask one-off questions against a published semantic model: pick fields/measures, build a quick table or visual, filter, then save/share the result as an exploration (not a full report). The crew likes the direction—especially for business users who need fast answers—but they also call out how much of Explore’s success depends on the details around permissions and workflow.
Key takeaways:
- Model curation is non-negotiable: Explore assumes your semantic model is already user-ready (measures, display folders, friendly names, and hidden technical columns).
- The artifact type changes the conversation: because an exploration isn’t a report, you immediately get questions about ownership, where it lives, and when it should be promoted into the official report/app experience.
- Permissioning must be realistic: if Explore effectively requires broad build permissions, many governed environments won’t adopt it; if it can safely operate with viewer-style access, it becomes far more practical.
- Explore overlaps existing concepts: it feels adjacent to personalized visuals and other “quick analysis” workflows—so the UI placement and how you enter Explore will matter.
- Users will still want export-like outcomes: even if Explore keeps people in Power BI, the product needs a clear answer for saving, sharing, and reusing results without encouraging unmanaged copies of data.
- Guardrails should steer users toward measures first: exploration should default to aggregated, model-approved metrics so performance and usability don’t collapse on large datasets.
- Use explorations as demand telemetry: repeated patterns in what users explore can be the fastest way to discover what the official report/app is missing.
Looking Forward
If Explore becomes easier to launch from reports/apps and comes with a clear, governed permission story, it could be the missing bridge between curated reporting and the real-world need for ad-hoc discovery.
Episode Transcript
0:28 good morning everyone welcome back to the explicit measures podcast with Tommy Seth and Seth and Mike good morning gentlemen good morning guys today’s main topic will’ll be talking about the newly released feature from powerbi desktop called explore it’s their new interaction or experience around getting into the data and seeing what’s being built there so this is their new experience that they’ve kind their new experience that they’ve built out here just react to of built out here just react to it think through what it means how would
0:58 it think through what it means how would we use this and maybe talk about some limitations that we see with it so any that’s our main topic for today Tommy do you have a I think you had an intro that you were talking to me about initially here so let’s talk about maybe an intro topic yeah we’ll do some news and intro and then we’ll jump into the main topic yeah I have a scenario that I’ve been playing around with and it’s obviously led me to think about how can this play in a wider organization or from an adoption standpoint been playing a lot with notebooks and all the conversations been around notebooks for
1:29 conversations been around notebooks for two purposes is currently data scientist and for data engineering but I feel like there’s another part here for the quick insights or even just to give me the quick numbers that are not necessarily in either of those camps and I’ll give an example I’m doing some projects I need to to get some quick numbers both from my own consulting firm on how many hours for this and yes I could have the report but if it’s connected the notebook’s connected
1:59 connected the notebook’s connected directly to equal and I’ve been actually creating this notebook to say hey how many unbuild hours for such and such and I already have a cell and I already have the cell that’s I’m not editing it anymore it’s meant for I need to see this quick view and it’s been really helpful so this has led me to think about man is this something that we introduced to Consumers not necessarily them building the notebook but notebooks that are quick and easy views into some
2:29 that are quick and easy views into some of our data the data Wrangler is already there but is there another camp that I think notebooks can play in Microsoft fabric at an organization to share with who share with consumers or share with collaborators to get some quick numbers what’s the difference between that a prean query outputting a number and giving you a number a visual and not being able to do that in paginated or a powerbi report it’s it’s another Avenue
3:01 report it’s it’s another Avenue if you’re not especially if you’re not updating it right well this so my notebook’s actually connected to SQL it’s disconnect to some quick tables so rather than having to refresh my powerbi data set I’m already connected directly to the to the source so there’s a there’s a couple advantages with the notebooks right you they’re a scrollable list of n number of steps which you can add syntax you can add some charts in there
3:32 can add some charts in there to me it feels more like hey I’m going to integrate some white paper esque type things I’m going to write you esque type things I’m going to write here I’m going to start this cell know here I’m going to start this cell with markdown I’m going to write some observations I’m going to document some things okay and here’s a chart that might support that and then the next visual you see is the SQL query and then the chart beneath it and then okay digging further I found that if I did this and you can keep explaining so it’s more of like like here’s my line of thinking with a series
4:03 here’s my line of thinking with a series of text and or visuals in a line versus okay here’s just a can report or a cube or model that’s already built for you so I I think that’s the story that people are telling me that they want to use with the notebook experience in practice I don’t think people want that in general I I think that’s only like a conversation between between very technical people about the context of the data I don’t think this
4:35 of the data I don’t think this helps further the there’s let me say it this way you need more control around what you can do and not do in the notebook to be able to share it correctly right it needs to be something like hey you can run this notebook it’s a readon notebook here here’s the information you just read through it so think think about like a powerbi app right I have the report I have I have paginated reports I’ve got maybe a link to a PDF and then I have a notebook attached to it maybe
5:05 have a notebook attached to it maybe there’s a notebook in there that that is a readon notebook and you just scroll through the information maybe the notebook becomes the data quality report I don’t know like here’s here’s the data that came out of this part of the model and you ran a couple queries and you can prove that it’s there I don’t know I’m just not quite sure I understand exactly like the utility of it if I stretch some of my user stories maybe I can make it fit I’m just not loving it what like that’s where I’m going with
5:35 that’s where I’m going with this it’s ironic that we talk about tech like when all the episodes we’ve had about story story not framing storyboarding or or storytelling in data visualization it we’ve read a lot about it’s a lot of text and the visuals support the text more when story framing is different but storytelling is the text and then visual supporting that it’s almost the I don’t want
6:05 that it’s almost the I don’t want to say it’s the best case but when you think about what product right now in powerbi allows you to in a sense do that interactivity of here’s some text we’ve supported this we looked into this run this here’s a visual supporting that text it almost reads like an article so you can I don’t know I I feel like there’s so so but that’s that your description of things to me is two different different users it’s it’s not the end user yes and that’s where I’m going I’m a time where I do agree yeah is are are
6:36 time where I do agree yeah is are are notebooks I think successful in this in this mode albe it I think your use case is slightly different but you’re you’re the analyst here you created these queries you were trying to like drive down to a number and you’ve got yourselves and like your path to how you got there because you’re creating the narrative to produce an output just because that output now lives still in in the notebook instead of somewhere I I think you’re the Creator and the consumer so it makes sense to
7:06 and the consumer so it makes sense to you so where I where I see notebooks being successful are in what you describe for maybe it’s your analysis and you’re passing that to another analyst who’s creating their own story or needs to look at meaningful data right because curating these sorts of like top- down cell by cell first we look here then we look here we also had I’ve also had like a lot of success in troubleshooting right bug bug solving like through the ETL
7:37 bug bug solving like through the ETL pipeline so it’s like cell one stage one two three four because I’m I’m checking for the validity of the data as I go through things but that that’s not an end user that’s an analyst or a Dev right and then like so there’s 100% I love that use case the second one is building building out I think templates or notebooks as templates for data access potentially where hey in your business unit here
8:07 where hey in your business unit here are the tables and the things that we’ve created for you here’s examples of the data that comes out of that so it’s like just a quick reference and it’s fantastic because like once you run it it stays instantiated right so each one of those cells is like if they’re looking for a column or you can add in describe and like what what the schema of the table is etc etc but that’s build stuff it’s the people still working with the data and I still think it’s there yeah because once I get out of that realm I want to
8:39 of that realm I want to simplify like the presentation to the end user and the contextual text on an enduser report is still valid it’s just extremely simplified to the point in scope of what that report should be generating well here’s the what the notebook can do that none of the right now other products too the art of anticipating imagine you have this notebook we’ve done this extensive research and we found this is the way to go and this is what we found what did you find you have to run it and you have to wait because the visual is not there yet there’s no
9:10 the visual is not there yet there’s no other product in powerbi that has that art of climactic wait oh oh yes there is get enough data it’s a spinning it’s a spinning called it’s called direct query direct query has the suspense I clicked it I don’t know what it’s doing it’s just spinning the text load too what happens it’s is it is it going to give an answer or is it not going to give me an answer I don’t know it’s direct query I don’t know yeah that’s the game you play is it going to break or not will not a memory or not I don’t know you have reached you have exceeded 1 million
9:40 have reached you have exceeded 1 million row so to your point Tommy there around like where I could see this being used I’m I do not love the idea of giving someone a notebook and saying okay now run spark against the raw tables I just don’t love the idea of like letting users ad hoc do that kind like letting users ad hoc do that stuff and to your point Seth I really of stuff and to your point Seth I really really resonated with your point right debugging debugging troubleshooting verifying something’s right I think works really well in a notebook notebooks are great for that step one run something from bronze step
10:11 step one run something from bronze step two check things in silver step three check things in Gold what what where in the pipeline of things did I break something and I and I and I do really believe here I saw a tweet from Marco Russo talking about does anyone really even need Medallion is this just a madeup thing and and I I resonated with his statement because on some on some level I was like yeah no one really needs Medallion what’s that really there for I don’t really understand like it’s just a madeup thing but then I really thought about like the
10:42 but then I really thought about like the processes that I run and you really do need like named areas or regions of when we do these kinds of Transformations it happens in this layer of the data so that way when there’s a problem where to go start looking because you start with you don’t always go back to oh we have a problem with data let’s always go back immediately to Raw data and say what happened there that do not necessarily always the use case
11:09 not necessarily always the use case right sometimes you’re trying to compare I need to go back to the silver layer and compare what happened to Gold maybe I miss something there maybe I filtered something out that I shouldn’t have anyways that’s another that’s another whole tangent but it it would be and I like I think Medallion architecture makes a lot more sense with unstructured data than structured I would totally I would totally agree with you yes 100% so and there like it it’s not a broad swath like with structured data like you could be applying a whole bunch of business logic
11:39 applying a whole bunch of business logic to make it meaningful Etc and it’s a different layer or something but in the unstructured realm each one of those layers is like contains different structs of the data not like one’s absolutely just everything in historical but do you need to do you need to rip it all apart in that layer no then the next layer is like well give me the the most recent thing and that could apply start applying business logic and you could start just ripping out more of the data from the unstructured and then your final layer is well now you need to
12:11 your final layer is well now you need to apply a lot of transformation and like blow out everything into the final product or whatever the case may be and I think that’s where it makes a ton of sense in these ecosystems where I think they originated right this this honestly is just going to I think a lot of our processes and the tooling that we’ve used we’re going to have to really rethink in 12 months where it’s like oh well Jupiter notebooks were the best for data engineering and that’s how we’re going to run things and I’ve done a bunch of things where I’m doing it in a jupyter notebook I’m like I could turn this out in five minutes in power query
12:43 this out in five minutes in power query because I know how but it’s already available in the service now it’s in the same platform I think Medallion The Medallion architecture is probably going to be refined a bit in fabric because you have other tooling there too just like the data engineering tools just just like the reporting tools that we have we’re going to have to really rethink just like this has happened in the history of business intelligence like well no you need ssis and jobs to run you cannot run business intelligence without that we’ve changed from that well no you need analysis
13:14 from that well no you need analysis services to run you can’t run without that that’s changed too we’re going to find oursel with a lot of these rethinking the I don’t want to say the platform but the pl the the process where things live and I think the workflow that those go into because the products are being elevated yeah yes I’m going to agree with you slightly there but but I also I also think there are some I think there are some things that are very much Staples in the data engineering world that will not change now the technology under the hood may
13:46 now the technology under the hood may change I think people love their SQL way too much to give it up so whatever the tool is I don’t really care what it is it’s going to be a SQL Server it’s going to be spark I don’t care what you build it’s there’s always going to be SQL on top of everything so Bar None I think that’s going to be a thing this whole concept of paret and a metadata layer I’m going to say it’s Delta but I’m not sure Microsoft is going to stay very strongly to this Delta format long term but they’re I
14:16 Delta format long term but they’re I could I could see Microsoft taking Delta formatting and mutating it in a way that best serves their needs for what they want to build and then it other tools I I Microsoft they don’t like having a lot of open- source data storage don’t know I don’t know I think I think they’re going to tweak it to make it serve their purposes and they’re going to add oh if you do it this way it’s slightly more well here’s let let say this way Microsoft usually comes in late to the
14:47 Microsoft usually comes in late to the game to these technology things and they copy and or optimize the system to make it perform at lower cost than their competitors so I think what they’re going to do is they’re going to take Delta format they’re going to look at it like yeah this is good because they they I don’t they haven’t even embraced Delta 3. 0 which is a better format than what they’re on right now so I don’t know when they’re going to get to Delta 3. 0 I hope they support it long term because there’s a lot of other interesting things that go along with it but I think Microsoft is going to continue to you
15:18 Microsoft is going to continue to you Microsoft is going to continue to they’ve already added the ordering know they’ve already added the ordering which is not an open source thing which is a way of packing the the paret files differently than what you would do in data bricks so I don’t know I think they’re going to continue to go down that path and make very efficient patterns in reading and accessing data but they’re going to do it their way and it’s not going to be like an open- Source Delta format moving forward they’re going to have a little bit of a a flavor change on that for certain scenarios yes probably yes and it’ll
15:48 scenarios yes probably yes and it’ll probably be still Interpol with hey I’m going to bring over table like I think there my hesitation there is if if we’ve seen anything in the shift in Microsoft like they’re reaching out to their largest competitors across multiple different Technologies right like to integrate to like hey see how we can collaborate together how does this work in a larger ecosystem which is really just a benefit for the consumer oh totally if you think about like if you’ve been building Delta tables for the longest time in in data
16:19 tables for the longest time in in data bricks pads into fabric are really easy right like a lot of the things are still connecting really like so it’s easy for the consumer and adopting the things that are the most popular in the market or the new directions where you can scale and build yes so I don’t I I I agree I see them doing their thing their flavor of something but I do also see them staying W as wide open as they can especially from the data structure sides in collaborating with other
16:50 sides in collaborating with other systems or making that back and forth is as mutually beneficial as possible is what I guess what I’m saying and I would I would also Echo that too like I wouldn’t say they’re going to abandon that and not say oh we’re never going to be able to read Delta tables anymore I think their tools internally like when you have power Cory write stuff down I’m not sure it will always be in the Delta format forever it may be something different in the future I don’t know I yeah we’ll see we’ll see where this is one I’m a little bit more skeptical about but I we’ll see where it
17:20 skeptical about but I we’ll see where it lands and the last thing I’ll say I’m gonna end with the Seth type question where the answer is apparent and if you don’t get the answer right I’ll hammer you so I don’t do is process defined by the technology or dictated by the technology or the other way around was process def by the techology technology or the technology Define the process right yeah yes ah I’m gonna answer yes I think it go I think it goes both ways I think part of your process
17:51 both ways I think part of your process is defined by the technology and part of the technology defines what process you can do you may have the this is this is why I think organizations struggle a lot to migrate between different solutions or tool like you’ve got a homegrown tool that does something and then you move on to another technology thing and that’s why there’s so much resistance to like we have to customize it we got to change it it doesn’t fit our process all these things I’m like you’re you’re telling me that sap doesn’t have an approval
18:21 that sap doesn’t have an approval process to get something out the door and approve things the right way and you and you the company know better than this massive integr company that has all the dads in the world like it does like it runs massive companies and you’re telling me our company is smarter than sap to figure out how to release products I’m going to say BS because I’m pretty sure that this massive company that has done yes we can customize it to our needs to our process but that’s where they make all their money let’s let’s just learn the tool and conform
18:52 let’s just learn the tool and conform our process to the tool so let’s let the Technology Drive our process your your statement right there just told me that no matter what technology is going to define the process eventually it’s a it’s a give and take right so there’s there’s a certain amount of process that you require that has to Define what the technology does but then on the other hand if you want to again you can make your technology do whatever you want but at some point you have to figure out the like so Kimble star schema things right that
19:24 Kimble star schema things right that stuff didn’t exist until you had you stuff didn’t exist until you had servers that could handle limited know servers that could handle limited amounts of data but had computes so you’d had to like someone had to figure out like what’s the best way to play with the technology so then that defined the process and you use the technology because that’s the process that works with it but I think it it goes hand inand it goes both ways I will put this as a topic which came first chicken or the egg oh well the process the process course the chicken I’ll put this as a mailbag
19:54 chicken I’ll put this as a mailbag or as a topic if you’re listening and that sounds like a really great topic process technology which comes first let us know and we’ll elevate it in our whatever thing we use for that anything any thoughts on yours on your P set do you have any bent one way or the or the other I I I see both sides and I stay in the middle because I haven’t really thought about it
20:29 friend one yeah actually I’m going to comment here Enterprise AR has a really funny comment here it goes you really funny comment here it goes this is like a scenario one day know this is like a scenario one day Mike’s walking around the Microsoft campus campus he sees a curtain and behind it says Delta storage he peers behind the curtain and sees only CSV files laying all over the floor who knows I don’t know what they’re doing back there it’s like it’s that was that was funny that’s maybe yeah turns around throws out all of everything he’s worked on on go back to excel exactly behind the
21:02 go back to excel exactly behind the curtain he sees Excel databases surprise the entire Delta format is built on Excel sponsored by VB more funny if it was access yeah yeah access databases anyways access all the things let’s move on to our main topic for today so I think I misspoke in the intro so just I’ll clarify again the introduction for today is talking about the exploring the explore feature in par. com the service is now in public preview so there there there’s a new feature inside the service called explore and there’s an article
21:34 called explore and there’s an article about it I’ll put that in the chat as well so we’re going to talk more about what does explore mean not just the word but the feature inside powerbi service and what how do we think we’re going to use it this is this is an interesting new feature that came out I’m not sure how I feel about it yet but it’s interesting Tommy why don’t you break down the article for us yeah man and so we have had features in the powerbi service already that have allowed us to somewhat view the backend
22:07 allowed us to somewhat view the backend of a semantic model whether going to the semantic model viewing the tables you can create a pated report from there there’s been the insights feature there’s been autoc creative report all
22:18 there’s been autoc creative report all those features were fine but they were components that did not really have a holistic view or holistic experience that I think users enjoyed what we now have is basically the train built if we had the wheels and the tracks and and the engine we now I think have a full product that allows a user and the user story to go want to learn more about a semantic model and really get a holistic view of some of the data quickly but
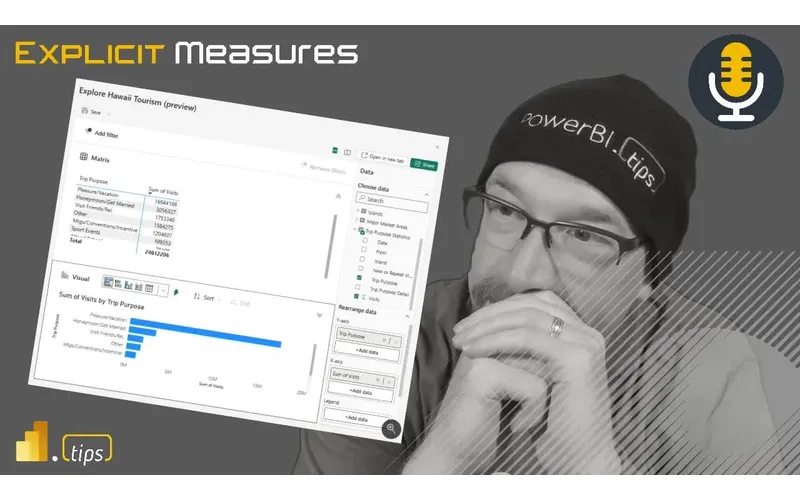
22:49 view of some of the data quickly but more importantly this becomes its own artifact that can be shared the explore feature in powerbi public preview simply allows the user to go through create a pivot table a normal table or a visual add filters and then even share that it’s not a report so it’s a single Viewpoint and that’s an important distinction here this is not a report even though it may smell or look like one but it’s not considered a powerbi report any consumer I believe can do this I don’t think they even need build access and I need to verify that
23:19 build access and I need to verify that one more time I think they do I think they do need build after they do okay that’s the one that does need to be there yep okay so we do need build access you need a pro propi per user license oh yeah and they need to Grant build permissions to the underlying semantic model this is one of the first things I look for when I go see a new feature I go you have to go like right to the like this you taught me Seth you Seth you say first when a new features release go right to the limitations and read the
23:49 right to the limitations and read the limitations first because that defines the scope of what they what you can and cannot do with this and like oh that’s a that’s a really good idea even more I don’t want to say concerning is also the exploration offer will need to Grant build permissions to the underlying model to the recipient so even the viewer the one who’s looking at this needs build permissions all right so so you want to start off with the the limitations or should we talk about the benefits we’ll get to Let’s we get to the limitations
24:19 get to Let’s we get to the limitations later we’re positive people right I think realistic pessimists yeah maybe I I think this is we what we’ve had before this is obviously an upgrade to me this is obviously a next a good step forward to I think really something what’s needed in powerbi for quicker adoption for data literacy and for data for trusting data so one of the I I’ll just nod my head I’ll nod my
24:50 the I I’ll just nod my head I’ll nod my head in agreement the what was what was interesting to me is after I read through the article I went I had to go back and and and identify what are the personas that they outlined for the use cases for this and even based on this conversation and to add to it I it it is very apparent to me that you have been assimilated already by Microsoft because their two different personas are the analyst and I think this this
25:23 are the analyst and I think this this new new feature is aligned to that role 100% that persona but it also outlines that this would be for the business user and in that one I think it breaks down a little bit and we can talk about that a little like a little while but it’s surprising to me I guess my so in those two personas I think it fits very well and in another I I don’t think it does but I it ironically enough the outputs are a table and a
25:56 outputs are a table and a visual and Tommy I’m a little flued because you You intro with saying notebooks and the cellbell experience was a great one for business users and that they should use it but in this one if this isn’t a report this is exactly the same thing as that like they we can share and create these these Explorations so it’s a report in of itself that can be shared across different users how is that any different well the big difference is
26:27 different well the big difference is this requires a semantic Model A Jupiter notebook if already built can be to lake house it’s data data but okay I’ve made enough calls there’s a difference how that output is generated how that data is generated doesn’t matter my friend one has relationships the other is lonely okay that’s not true at all a lak house you’re joining data together in a lake house okay one is that not a relationship is that not a relationship
26:58 relationship is that not a relationship are we arguing over raw data and a semantic model right now relationships between tables that’s what you said and my metrics the dynamic Nature by which we can extend breakout filter data is absolutely something that you can do in a model and not quickly in raw data forms but you I’ll further your situation my friend with notebooks you literally said the best case scenario for a notebook is checking the validity as you go through each part of the data Engineering Process this is not possible is a particular use case yes it’s a
27:29 is a particular use case yes it’s a great use case and I’m going to lean on that one because that works in my favor right now but that’s perfect for the notebook that does not work with the explore feature this is already a predefined semantic model that we’re using to do explore correct I have cre my measures I’ve organized hopefully into display folders or my measure tables I have my relationships I’ve hidden and shown the right rows and columns so from a user point of view I columns so from a user point of view this is like the this is like the mean this is like the this is like the diet version or your driver’s ed
27:59 diet version or your driver’s ed license if the notebook is your car where again everything’s already in a sense almost predefine for you you can explore it but it’s only what’s been given to you honestly when you think about I I’m agreeing with you I think a bit here where if you were to take notebooks and you were take the explore feature yeah choose the explore feature man like that’s a lot easier for doing doesn’t give you the anticipation or the text again telling a story but if I want
28:29 text again telling a story but if I want to get quick insights this explore feature like I said this is a really positive step forward to what I think is very needed for adoption I’m for the business user now that I I want it to be it’s a step forward I didn’t say It’s the final product well okay go Ahad so I I’m gonna I I get there’s there’s let me let’s talk about the feature like in
28:59 let’s talk about the feature like in general right so the idea here where my mind initially goes on this one and this could be totally wrong I could be totally off based on this one it feels like this is a feature ripped straight out of Click when I look at click click has this ability to like make a visual and then at the top of the page it shows you here’s the filter that you would apply to the page and then you keep teeing up filters the filters go across the top of the page and you have potentially a
29:30 the page and you have potentially a series of videos so one hand of this this feels like a a fancy way of users to like use this in a way to start generating like a single Visual and helping them get to like a very click- like experience so it feels and also I feel like another another reaction to this I have is Microsoft said hey look we’re going to try and do this on visual editing and and users are asking for I just need to exp I don’t trust the data yet I just want to pick some stuff up
30:01 yet I just want to pick some stuff up and just make a matrix or a table I could see that I feel like that’s part of this but things hidden in this tool that are there’s a couple things that that rub me the wrong way and there’s a couple things I’m like what are we doing here like you’re making a single it says you’re building the Matrix you can grab the data fields there it autop populates the fields no you’re building the table it’s a matrix visual it’s a table but it’s it’s a matrix visual the the the the limitations section points out that the
30:33 limitations section points out that the Matrix visual is not supported not in the visual section but in the top section where they have like the TCH like there’s literally like there’s like a matrix section which is literally The Matrix where it’s just building a matrix of like the Matrix visual but the bottom visual section does not support another Matrix it just supports your point the table below because you already have the Matrix in above the above portion gotcha okay but you’re right the the visual portion doesn’t support it so so that’s it’s interesting to see how
31:04 so so that’s it’s interesting to see how that works there’s you can use it you can you can arrange the visual left and right you can see the table left or right I think it’s a good exploration tool to like look at the data I feel like what they want from this as well is someone was going to need the export feature from this because they’re going to they’re pushing you to create the visual and then if you want to get the data out of it you got to push it to a report it also feels like a I don’t know it I don’t know how to use it yet I understand the purpose of it but I why
31:34 understand the purpose of it but I why would I do it all the design work in the simple UI and why wouldn’t I just go to a page and a report and just do the discovery there because it’s already in the report I’ve already got the things I need it’s already on the page I’m going to shape it like that to me feels more natural to me than trying to build just a single Visual and explore with what’s going on in the in the The Matrix version of the table versus the visual table but it’s not trying to be that so the tagine I so the tagline here is literally like
32:07 I so the tagline here is literally like verbatim the lightweight and focused experience for users to explore their data it’s taking out of the article right fine it’s not trying to be a report that’s not ever going to be the intention of this or the end can’t you save this as a report you can save it as Explorer not as a it’s a new artifact it’s a new artifact which is right which goes back to here here’s where I get confused as I play with this feature as I’m
32:37 play with this feature as I’m interacting with it I I didn’t have any expectations but then I did Fair because this is why I went back and I who is this for because we’re talking about analysts this makes perfect sense like nothing about this I don’t think I would change because as an analyst they would probably have access to edit the semantic model like they they may add a calculation into this that they would need to see quick
33:07 that they would need to see quick analysis quick exploration adding like having the table and a visual they’re interrogating things not in a scoped view or potentially in a hey do we have this in in the model can we can we view it could we create a report page around these things I’m going to vet the
33:25 around these things I’m going to vet the data set before we go down there route whatever the case may be right or tee up all of the things that I need that somebody else needs to go Implement makes total sense but where it falls apart for me is the business user Persona right because to Mike’s to Mike’s Point why why doesn’t this live next to or replace personalized visualizations and maybe the the Persona is slightly different
33:55 the the Persona is slightly different from the standpoint that I have a report and I just hate your your pie chart so I’m going to change it to a bar chart and I have my own version but typically the reason somebody wants to personalize their visuals and the the functionality of that allows somebody to swap something out on an access right I W I don’t want to look at by this but I know I want to look at by manager or I want to look at by salesperson or whatever the case may be because it’s not easily accessible to me in that case I say well if it lived
34:27 me in that case I say well if it lived next to personalized visualization and this is just an exploration man like I could have said okay actually I want to explore and instead of building my own stuff now I can pre-populate the table and the visual with the visual that’s on the report page and then give me the the slide out right because now then I have a crossover if I’m an analyst I’m going and looking at report Pages it’s scoped for this thing I want to build out where I want to interrogate that further I’m gonna pop this open and
34:58 that further I’m gonna pop this open and I’m going to explore it I’m G to add more data so that I get this View and be oh okay now dump it out so I guess like that’s what’s the disconnect for me right now I’d love to talk through it like whether or not you guys agree or disagree but the the report layer seems like a much better spot for me because you’ve you’ve already built that in almost in personalized visualizations unless I’m missing that context context and we could just launch from the same
35:30 and we could just launch from the same spots when we want to do something different than whatever the scoped presentation is in the report because I’m not gonna I’m not the other part of this is I’m not giving business users access to my semantic model to edit it right no no and I actually I love your point because you talked about the two personas and there should be a primary Persona here and this does feel like it should be the business user ideally not necessarily the analyst I love your point and I’m going to agree 100% with
36:02 point and I’m going to agree 100% with you that this should probably live in the report view if anything take the place of the personalized visuals I have personalized my own visuals in my own reports and changed everything because I wanted I had another thought another view and I’ve had other users whove done the same they’re like I didn’t just change this from a line chart to a bar chart I wanted a whole other view of this because I had a thought had an interest this makes a lot of sense where I don’t have to give the users the build
36:32 I don’t have to give the users the build permissions because when I do personaliz visuals you can see the whole semantic model anyways what’s hidden what’s shown but that’s like that’s to Mike’s Point too even the click experience yeah click isn’t click you’re not forcing somebody you to go back into the model or even understand where the model is from a report you would have to know and have access to the workspace in order to instantiate this thing that’s not not a business user like use case to me I don’t yes yes and even even just so even
37:03 don’t yes yes and even even just so even looking at this so interesting feature on this one is it’s really focusing your attention on building a single Visual and there are some things here that is different than what you would look at when you look at a normal so I’m going to talk about the Matrix visual specifically so I’m plain while you guys have been talking there is more clearly designations at the top of this around how to sort the visual there’s actually a physical button for it that stays there the entire time with the full words of sort descending ascending and sort by so from that perspective it’s much clearer as to what you’re doing on the Sorting method also those funny
37:35 the Sorting method also those funny little icons that you have like The Arrow up drill up drill down drill down mode go to the next level and expand one level below they actually have the icons easily accessible and there’s words next to each one of them so what the heck it’s doing like in desktop or in any other report those are so complicated and I never know when I’m communicating or teaching people about those buttons I can never get the dog on words right on what they actually mean because I forget it I’m like it’s the
38:05 because I forget it I’m like it’s the arrow that splits in half it’s the the two the two sidebyside arrows pointing down like I describe what the icon yeah exactly I describe what the icon is as opposed to what the feature of the icon is so I don’t I don’t necessarily know the icons actually represent what they do but what they do is important you you do need to use them so in that respect I think it’s good I keep looking for okay even if I have an exploratory view on something I still feel like people are
38:35 something I still feel like people are going to want to export this there’s nothing to export here I think that’s good I you’re probably right but I think if I’m if I am a business user they’re going to ask for 100% how can I export this table I’ve explored the data I found what I want and I want to save it meaning I’m going to come back so the idea is like I’m I have this experience where I have potentially even a huge huge amount of data that’s potentially behind this data model right I want to say this is
39:08 model right I want to say this is this is me as the report Creator right users want to see I want these Columns of data I want these filters pre-applied or I want to require these three or four filters before any data is shown because the model’s too big to see it all so really what I I love this experience I really what I I love this experience from from that standpoint but mean from from that standpoint but there’s to me there’s like three or four missing features here that would really make it useful to me where I could say hey business unit here’s a model pick
39:38 hey business unit here’s a model pick the columns you care about here’s the filter criteria at the top pick what you want done and like and if I had a couple more feature controls around this one I think I could really get behind this and use it I could I could really see people saying yeah this is impactful for me and all this has to work to me this is a fancy data dump tool is what I see this as I don’t see a ton of value from making anything other than the table but but think about that though like this is
40:08 but think about that though like this is like and they even they even address that in here which is I think part of the problem with some of the reporting or reports right now is they are dumping the data out into Excel to go do the this expiration and I think there’s they’re trying to stem the tide of saying okay we’re going to give you the capability to go do that analysis here and if you want to see it in the Matrix form or the table like a a visual we’ll provide both of those to you so hopefully you get your answer right away you don’t need to export it and do your
40:39 you don’t need to export it and do your own analysis because we’ll we’ll do this for you in in this interactive like exploration tool and so I don’t I agree I don’t think it’s gonna I don’t think it’s going to C like I don’t think it’s going to be cover every use case right because if I need to start well it maybe it is I can filter out data here I can like what can’t I do from a quick exploration standpoint here that you could by exporting it all so why would I want to export it to that point is hold
41:10 want to export it to that point is hold on Tommy let me answer questions Tomy Seth’s question because he asked to me the question first let me answer hang on to your comment just let me answer Seth real quick and then I’ll let you go so why would you want to export the data I think the reason the export exists is because there’s other data I can’t join to this so the only thing I find this weakness of is this requires the model to have all the data you would ever need to use it would and so understand the use case and cool but I still think people are going to say I need to
41:40 think people are going to say I need to join this other data to it because I’m getting the the the sales numbers that I need but I need to do this other thing to enhance it so that’s part that’s that’s you can’t do that okay that’s all I wanted to make Tommy go ahead sorry no no no no no yeah it was my fault but I think the important part of that story that we’re telling now guess where it lives there’s not 18 Excel documents on my computer that like oh boss let me show you what I did it lives in the powerbi service and again that’s the goal we’re trying to push people there yeah the limitation is I can’t add it to another
42:10 limitation is I can’t add it to another semantic model but at the same time we’re to the point we said earlier you’re already dealing with hopefully a pretty comprehensive semantic model even if this is a live report if it lived in the report area it should have the majority of what you need to do that analysis right like unless you’re combining with something completely irrelevant which then you’re utiliz you irrelevant which then you’re utiliz depending on the business user to know depending on the business user to do that do that correctly this is pushing people back to powerbi and if you’re doing that
42:40 powerbi and if you’re doing that analysis with all the capabilities we’ve talked about in The Matrix in the powerbi service now you’re going to tell your executive or your boss or your team hey here’s the exploration in powerbi here’s the report or reports that support it rather rather than once it becomes exported it’s detached it’s where did we get that from all those questions going come up well what did you do to that what filters did you add and there’s no longer that lineage if we push people to powerbi and if they wait if we push people to
43:12 if they wait if we push people to powerbi you can see the exactly okay what filters did you add where is this coming from who created that there still part of that the road the road has not been broken the bridge has not been broken more importantly if they really want that other feature or table added because they want to do well this doesn’t have Finance cost we’ll build you a semantic model do so because that’s apparently a use case that you need for reporting and I agree I think that’s that’s a great Point yeah I love that point because that’s that’s
43:42 I love that point because that’s that’s where our effort should be made is our effort should be made on what is missing from the model that you need that we don’t have today and exactly in in some cases like there’s good consistent data that we can just lock down and say it is what it is but in other situations especially when you’re doing data cleaning type exercises it’s I would love it for it to be this nice pretty world we like hey we’re just missing 10 things we’ll just add 10 things good move on we have everything we need but I have to be realist here there’s going to be junk data that makes
44:13 there’s going to be junk data that makes it through through the to the system and there’s going to be someone writes a new name in the Erp system and then there’s not enough controls Upstream to clean the data so therefore it comes into our report and it’s just wrong and so someone’s trying to fix it it’s going to happen so I don’t know I I like this feature I think there’s a lot of good things there’s one
44:33 there’s a lot of good things there’s one major bug I do want to point out if you’re in an Explorer I guess it would be an exploratory report or exploration I don’t know what you would call it but if you’re in an exploration and you have the data tab on the right hand side there’s a little double arrow on the right hand side to minimize the data tab just the data things if you click it po poof it’s gone no way yes poof it’s gone try to get it back I’ve been trying to literally for the last 10 minutes I’ve
45:03 literally for the last 10 minutes I’ve been trying to figure out how to make preview I was trying feedback live feedback live feedback poit gone so if you want the little data tab thingy back apparently you have to you have to go into the report and you can there’s a little toggle in the upper right hand corner that goes from View mode to edit mode if you toggle that button one time then it reappears yes so I’m like okay you can get it back but it’s like you have to like know to toggle this little button to then have it appear again so I
45:33 button to then have it appear again so I feel like you should just minimize it it should still say data on the right hand side and then when you actually need it back you should be able to click it again and it reappears public preview I know they’re working out the Kinks so yes it’s but I don’t know I I see some very strong use cases around this one and that’s there’s I don’t know I’m not sure how I feel about it yet I’m not sure if it’s so widely going to be adopted I not how I access but the experience I do like
46:03 access but the experience I do like because Mike I agree from from a you because Mike I agree from from a other tool know other tool perspective if this feature popped up and allowed me to do ad hoc analysis because I I was reading a report right and I could prompt this thing to get other additional information I think it extends the power of of the reports themselves because we we we all know that we have a lot of these challenges where we are trying to create
46:33 challenges where we are trying to create scoped scoped reports answer questions Etc sure but there is a wide swath of people that want to just analyze Access Data like and if we’ve gone through all the the work to create relationships I me that’s for you that’s go for them for them then this is a fantastic way for them to do that exploration mhm where I get confused and there’s been some chatter like hey awesome new feature boy it’s
47:03 like hey awesome new feature boy it’s really similar to personalized visuals which I don’t like right I I think is still very limiting outside of like just very like you can choose this stuff because a lot of the descriptions even in the technical like documentation around personalized visuals are like the exact same things that we’re solving here mhm and I think better because it’s got the the matrix it’s got the the ability to drag and drop add filtering do a bunch
47:33 drag and drop add filtering do a bunch of extra things I just don’t like where it it lives for for a business user right because I see the application of like this in that interface where I’m the business user I you’re absolutely answering my questions or but I’m the new person and I want to explore the data a little more what do you have for me oh my goodness like you have this and this now I can see hey snapshot can you build me a page that said like around the scope of this information because I don’t see this in the report this would be extremely valuable to me now I have a
48:04 be extremely valuable to me now I have a dialogue going for end users as opposed to the the experiences I have now so right now I have two features within the tool and maybe they’re for completely different personas where one is obviously the business user as they’re consuming a report to make their own version of things and I’ll just say this one’s for the analysts even though it says for the business users but like man I I personally would have loved to have seen like Hey we’re we’re changing
48:34 like Hey we’re we’re changing personalized visuals into Explorer because bam because no one uses personalized visuals and I don’t know that right but I don’t know so so it’ll be interesting to see like maybe these are completely two different things but to me there’s ton so much crossover and I would have seen I see the value in having that from a business perspective where I’m not giving them full access to my models and where I’m not going to give them access to my workspaces so they’re not going to be able to use it because they would have to generate it off a data set I know I agree if from a
49:04 off a data set I know I agree if from a business user right now personally it’s a nonstarter because you’re right you’re not just going to give this access to because how many people are going to give this access to If This Were to live in the report View and I think that discussion that we’re having if this was in part of the repute the report view just like the automated insights or personalized visual which to your point Seth is the same thing because you get the same columns and the same selections to choose just a much better interface in the explore feature
49:34 interface in the explore feature this solves again two really large aspects allows the user to trust the data and then I think Mike you made a really good point if people have other ideas of how they want to use that that just becomes another scenario and I’ve try I’ve tried to hack powerbi or utilize those features to learn what people really need what they don’t know how to say it like with comments and bookmarks we’re like oh why are you creating all those bookmarks like oh we’re trying to get this metric and it’s like okay we’ll build you that we can build that people don’t
50:04 we can build that people don’t know how to verbalize it so we’re actually gonna see based on their actions what are they needing and oh my gosh this is the best version of that yeah yeah I agree and and again if if you think about when I when I step back and look at like what’s going on inside the data model to me there’s still there’s still a story around again I like this experience I think this is potentially a good way to go this definitely is hitting some use cases where people are just trying to explore the information learn the data what’s in the model how does it work if as me as a
50:37 the model how does it work if as me as a I’m putting my business user head on to some degree right if I don’t have a very clean Dimension and fact model it’s almost impossible for any business user to understand the relationships between various tables they just try random things until something filters the way they expected to filter so I I understand what’s going on here I still really feel that you on here I still really feel that Microsoft needs a better way of know Microsoft needs a better way of descri like in in my mind’s eye if I had
51:07 descri like in in my mind’s eye if I had to look at this it’d be amazing if we could have if I have a dimension table and I bring the dimension field into the the visual it’d be really nice if that visual actually had like a graphical outlay here’s the measure in this model here’s the related Dimension tables and here’s the highlighted cells you picked from the model shown in a little mini map diagram something that I could see like I’m grabbing these dimensions and I could literally see here’s the dimension
51:37 literally see here’s the dimension tables you just picked from table table table here’s the measure where you added it from the measure lives here and you could see the relationships between those tables there has to be something that that articulates where those dimensions and facts come from in a very simple and again I’m thinking in my mind here like there’s that tool that mermaid tool that’s in Python where you can like visualize using mermaid it uses Json syntax and it simplifies hey here’s related things it can show you a tree diagram like real time render you a tree
52:09 diagram like real time render you a tree that’s the stuff that should be here what should be here is I should be able to articulate grabbing these random Fields throwing them down on a table and I need a way to visualize what tables am I touching and how is it relating the data together now the reason think this is important is because when I’m building the Excel document this is the exact same mental model I’m going through I’m doing I’m making various tables of data and I’m using the lookup to go grab this value from that table and join it with values
52:39 from that table and join it with values from that I have in front of me it’s the same concept it’s just two tables that are made made together by a relationship so to me this would be something that would be extremely helpful for us as the modelers and data engine engers of the system here’s the model this is what we think works for our business your business user you can grab and drag any Fields you want here and as you use these fields to make these tables of data you’re now getting a mental picture of actually how the model works and a
53:10 actually how the model works and a simplified view because it would be overwhelming them to give them the entire data model that would be amazing on top of this so I think I think that is a feature that’s required and then the other feature I would say i’ really need here I love the adding filters the top I think Microsoft may borrow that language and move that to other places inside powerbi potentially so I think I think they’re testing this add a filter remove a filter experience because it’s going to show up other places I do really like
53:40 to show up other places I do really like it my only hiccup here with this particular tool or this you explore feature is I need some before I start rendering data on the visual because I look at a data model that’s a million records in size you don’t don’t need a million records you don’t you’re going to use some measure to aggregate something there’s a handful of Records in that table that you actually care about it’s the sales on that product yeah it’s it’s it’s the sales on that product for that month of time why
54:12 that product for that month of time why are they down let’s go figure out like there’s there’s a smaller subset of information that I really care about so because of that especially when you have direct lake or Big Data models occurring here I don’t want users making a random t t and trying to roll up hundreds of millions of rows of data here I want them to pick what’s your geographical region what’s the product you care about what’s the product line you care about like to me there’s there’s a series of required filters and there’s a series of whatever you want filters so to me I
54:43 whatever you want filters so to me I think that would be another option here is especially if I’m creating this experience for business users to go use I want to have these are three filters that are required and then here’s the other filter you can use that but that that also reinforces the point that this belongs in personalized visuals area because like you have the report scope you have the filters that already applied so it’s like apply those when somebody opens this up and it’s like oh okay well I didn’t really pay attention and I didn’t know that I’m already in this region I’m already
55:13 already in this region I’m already looking at that person blah blah blah and then I can modify and do that like extend or manipulate that correct I like that that point sorry I got on a really long I do I do want to address and and talk about like the experience that you were talking about with relationship and model and and I I think it probably delves into like it’s probably more complicated it is to to because we’re creating our own measure tables we’re we’re we’re breaking the bounds of
55:42 we’re we’re breaking the bounds of relationship sometimes in the measures and how we calculate things but at the same time like I I agree even from the simple standpoint that if somebody’s dropping a column from a dimension gray out and make the the other dimensions inaccessible oh my gosh that would be awesome do what like right don’t even show them the model like which would raise the next question of like hey if you did show them the model you would see that these are no longer relevant because they’re they’re not going to make sense like the dimensions yeah you couldn’t do that all the way down the stream to measures or
56:12 the way down the stream to measures or whatever so you could still get yourself in trouble but if you had a large model two fact tables in 18 Dimensions like graying out 17 other tables would be very easy for an end user to be like oh I guess I can’t I can’t add all of this stuff into the same table man give me perspectives give me the option to choose a perspective and and to your point Seth as well right yeah the measures would get complicated because you can have a measure that lives in a table where it’s calculating
56:42 lives in a table where it’s calculating things from other tables right so I think a a good best practice here is you making measured tables or tables that are just dedicated for the measures I think is helpful to a degree but again it skates another layer away from okay where did that calculation come from what are we doing on top of it and typically and if you’re thinking about Kimble’s star schema stuff right the measures live in the fact table that’s what you should be counting now there are occasions where you need measures that live in dimension tables for whatever reason they they happen you can
57:13 whatever reason they they happen you can do it not saying you shouldn’t but I’m just saying you you probably need to put the measure where the columns are being touched by that measure and I think that would would inform the data modeler a bit more and give them a bit more rigor around what they’re doing because again we’re already as data modelers trying to design a model that many people business users can learn and consume how can you make this experience easier for people to learn and consume the model that I produced that’s the
57:45 the model that I produced that’s the real value here there need and and this is a Miss in my point there needs to be more diagramming around if I click this measure what does it like it there should be like it should be a no-brainer I should be able to click on a measure and not see the formula or maybe even see this formula I don’t even know I should be able to click on measure and I should be able to see all the columns that it touches across the different tables and the relationships it links to like it’s known we know the names of the columns and the tables across to all the model pieces I should be able to click on a measure and it should show me
58:16 on a measure and it should show me here’s here’s how this measure relates to other things in the model boom I don’t know what that looks like but to me that there’s something there I I agree it’s it’s I think as simple as you’re saying because there’s more configuration need to do there’s what it actually touches in a formula and then what also the other columns are I think we’re it’s like two elements here there’s explore the data and you’re speaking more of a feature called like explore the model where it is more the DI should they be different and I would argue no okay yes I’m probably am describing a brand new thing that’s like
58:46 describing a brand new thing that’s like explore explore the model but if I see where people struggle the most I think people struggle the most especially when I give out models to a business they even even internal to the analytics team right if one person’s great at data modeling and you give an a data model that’s been very heavily modeled to another analyst in the analyst team it takes them some time to figure out what what’s going on so what can we do to reduce that mental load what can we do to make it easier for people to learn how the model operates or how it’s designed to operate and go from there
59:18 designed to operate and go from there well let me ask you guys a question it’ll be my last thing but I want to really gauge your interest from an adoption point of view let’s say this lives in the report it has all the features that we are looking for that we’ve talked about already it that’s what the product is now you are in charge of adoption of powerbi at your organization where does this live in terms of how much are you promoting and communicating this feature again if it is the ideal State where’s this part of your communication how early are you
59:49 your communication how early are you talking about this how much are you talking about this feature yeah Frank to be perfectly honest I’m not really even if it’s already living in the the report if it’s what we’ve talk what we wanted it to be not what it is right now but if it is the things that we said that if it lived in an area where somebody could open it and instantiate this from the rep like personalized visuals yeah can you drop is this thing is this a item that you can drop into the app is this an appable thing can I
60:20 the app is this an appable thing can I put this into an app yes yes in our let’s say in our state this is something we would drop to the app well okay you’re you’re making things up versus like what does it do right now you like right now does it well yeah crew I’m saying like right now my question is not what it could do more about what does it do right now it go into the app yeah we’re not promoting it right now okay so but you think it would go in the app eventually yeah you can look at a report and now I want to explore it in the any report on
60:50 report on them interesting I didn’t think about that so I’ll talking about yeah did I just miss an entire half of the the conversation my whole point was hey Mike when you’re talking about click the experience where report is displayed to a business user yeah it and same thing in powerbi when I share something via an app and somebody wants to interrogate or look at a visual and and blow it out yeah and get do some ad hoc things I’m saying that’s where this belongs right
61:21 saying that’s where this belongs right start me there yeah then let me then let me do what I want and if I want to share some insights now I have a communicable thing with somebody else or back to the team saying I’d really like it if you would build me this and I’ll be dead serious Microsoft if you’re listening if I’m introduc listen to this I know I know but if you are part this part important next that I’m gonna say if I am adop if I’m in charge of adoption of powerbi and this is the feature that we said within the report within the app this is right after I explain what a
61:51 this is right after I explain what a report is and I demonstrate how to click on a visual i showing them this feature this is integral to me to getting consumers trusting the data this not only that it’s a it’s a trust thing too yeah right like you want to see the data like bam here here’s the table and the visual you want to see it with other data here here’s another table and how that looks my promotions are going to be all around this feature I I would I would absolutely tell people about this and enable it I’m I’m I’m blowing my mind here
62:22 it I’m I’m I’m blowing my mind here about putting this inside of an app I think to the conversation it’s you can’t there’s no included in that button today but that single page experience would make sense in an app I think that does make sense if you give me the export option no export to PowerPoint yeah or or export this table to excel like it’s got it’s got to be there right it’s got to direct live connect
62:52 it’s got to direct live connect to this table in Excel even better export to a lake house you create a lake house and two data flows yeah export to PDF I would like to PDF everything here so it’s super static and you can never touch it still a feature in power either either way I do like the feature I I do like the way I I think it it’s it serves the purpose that it’s trying to do for additional analytics analysis I think where it is is good for analysts people that are helping out with like interrogating a model because that’s
63:22 interrogating a model because that’s what’s being shared with them I did I I think I’d love to see it in the report layer for business user business case because I think it’s also applicable there yep without sharing my semantic model I’m gonna I’m gonna I’m literally writing a feedback item right now Microsoft you want to do that after the I’m in I’m in the data exploration from EMP from the EMP here are two they’re like what the heck’s EMP three idiots
63:53 like what the heck’s EMP three idiots three ding dong pound EMP find us on X you can listen to us on Spotify we like the teach and click better thanks that idea is brought to you every day at Tuesdays Thursdays at A. M interesting all right so I’ll say I’m unde I’m going to be I’m going to be very undecided on the feature I think it Ser I think it with some more refinement I think it becomes something we can use I’m still going to lean on I’d like
64:24 use I’m still going to lean on I’d like it to help users understand the model more it’s it’s a good step in the right direction there’s a lot of things are doing right I like the filtering that’s smart I like the be the ability to you smart I like the be the ability to quickly add fields to the visual know quickly add fields to the visual that’s that makes sense there is a new user experience here that is creating visuals on top of tables of data to understand how it works it is a great tool to help you understand okay if I add these data columns to the table here’s what the table will look like and here’s how I would relate that to a visual visual this is also feels very
64:56 visual visual this is also feels very much like Tableau to some degree because Tableau does a build a single visual then add it to a page this is more like a build a single Visual and now add it to the page stuff yeah so interesting with that I hope you enjoyed this conversation maybe this was a feature you haven’t tried out before share it with somebody else maybe there’s some other good feedback here for this feature go out try out this new feature go into powerbi. com try out the data exploration feature yourself and get your feeling for it how do you
65:26 and get your feeling for it how do you want to use it in your business so hopefully we gave you a couple good ideas here just don’t try to export it to excel you can’t do it with that we appreciate your listenership and we would love it if you would recommend this podcast to somebody else please let somebody else know either on social medias or if you’re at work or if you even go into buildings anymore I don’t know what people do anymore these days but if you go into a building maybe talk to a cooworker and and talk about the the podcast that you found here maybe you found some additional value here as well Tommy where else can you find the podcast you can find us an Apple Spotify wherever you get your
65:56 Apple Spotify wherever you get your podcast make sure to subscribe and leave a rating it helps us out a ton do you have a question an idea or a topic that you want us to talk about in a future episode head head over to power. tisp podcast leave your name and a great question join us live every Tuesday Thursday a. Central and join the conversation on all powerbi tips social media channels awesome thank you all so much and we appreciate your time we’ll see you next time
66:50 [Music] n
Thank You
Thanks for listening! If you enjoyed this episode, consider subscribing and sharing it with a teammate—and send us your topic ideas for future shows.