1-Click Notebooks – Ep. 485
Mike and Tommy unpack the new 1-click notebook feature that lets you launch a Fabric notebook directly from a Power BI semantic model—bridging the gap between traditional BI development and Python/Spark workflows. They also geek out over Fabric’s proactive resource provisioning system that makes Spark notebooks start almost instantly.
News & Announcements
-
How Does Fabric Make Spark Notebooks Instant? — Microsoft revealed the Fabric Forecasting Service, which keeps a small fleet of Spark clusters pre-warmed for near-instant starts. When a cluster is used, a new one is created to refill the pool. Time-series forecasting predicts demand per region, so your Spark notebook spins up in seconds instead of minutes. The caveat: this works best with starter pools, not custom Spark pools.
-
Using Notebooks with Your Semantic Model (Preview) — Deep dive into the new notebook integration for semantic models in Power BI. This enables 1-click notebook creation directly from a semantic model, pre-connected with Semantic Link for immediate Python-based analysis.
-
Semantic Link Overview — Microsoft Learn — Documentation for Semantic Link, the library that connects Fabric notebooks to Power BI semantic models, enabling Python-based querying of DAX, model metadata, and evaluation.
Main Discussion: 1-Click Notebooks
What Are 1-Click Notebooks?
The new feature adds a notebook button directly on semantic models in the Fabric service. One click creates a new notebook pre-connected to that specific semantic model via Semantic Link. No manual connection strings, no boilerplate setup—just instant access to your model from Python.
Mike and Tommy see this as a critical bridge: BI developers who live in DAX and Power BI now have a frictionless on-ramp to Python and Spark without leaving their semantic model context.
Semantic Link: The Connector
Semantic Link is the library that makes this work. It provides:
- DAX query execution from Python — run DAX against your semantic model and get DataFrames back
- Model metadata access — inspect tables, columns, measures, relationships programmatically
- Evaluation capabilities — test and validate model behavior from notebooks
Tommy highlights Semantic Link Labs (the community-extended version) as particularly powerful, adding capabilities beyond the core library.
Why This Matters for BI Teams
The 1-click experience lowers the barrier for BI developers to:
- Automate model analysis — BPA checks, VertiPaq stats, model documentation
- Run Python alongside DAX — Statistical analysis, ML, data science on top of semantic models
- Integrate with Spark — Scale out to distributed processing when needed
- Prototype faster — Quick exploration without setting up infrastructure
The Friction Points
Both note some friction that still exists:
- Every 1-click creates a new notebook artifact (cluttering the workspace)
- No “temporary notebook” concept yet (this connects to Tommy’s Secret Santa wish in Ep. 488)
- Custom Spark pools don’t benefit from the instant-start forecasting service
- The learning curve from DAX to Python is still real for traditional BI developers
Looking Forward
Mike and Tommy see 1-click notebooks as the beginning of a deeper integration between semantic models and data science workflows. The vision: semantic models become the hub, with notebooks, reports, and AI agents all connecting through them. Combined with Semantic Link and the instant Spark experience, the notebook is becoming a first-class tool for BI developers—not just data engineers.
Episode Transcript
Full verbatim transcript — click any timestamp to jump to that moment:
0:00 Hello everyone and welcome back to the
0:32 Explicit measures podcast. Explicit measures podcast. Trying to say it right there. A little bit of a tongue tw tongue tying. Oh my goodness. I’m already I’m already off my I’m offkilter this morning. welcome everyone. Welcome. We’re glad to have you back on this chilly morning here out of Milwaukee and Chicago. Hey Tommy. How’s it going? I’m doing excellent Mike. How you doing? I’m doing well. , and we’re going to talk about some of our favorite things today. , so very quickly, let’s get into our our main topic. What we’re going to talk about, our main topic today will be oneclick notebooks. Maybe
1:05 This is a clickbait title, Tommy. I don’t know. Sounds like it. Sounds like it. So, we’re we’re going to talk about oneclick notebooks today, and we’ll unpack what those mean. What are we talking about here for our main topic? But before we get into our main topic, Tommy, you have found a really interesting news article that I think we have to share with our community. This is impressive. What’s going on here? Tommy, what did you find? So, this is an article by Canel on the Fabric blog. How does Fabric make Spark notebooks instant? And we know that if you ever done Spark before in Fabric,
1:40 That it takes a little time, few minutes to start, slowing down. and you’re just if you want to test anything out and that pre-warming ways also compute as well. however there’s a solution now with a fabric for what’s called the fabric forecasting service which keeps a small fleet of spark clusters pre-warmed for near instant starts. each time a cluster is used, a new one is created to refill the pool. And there’s some things to with time series forecasting to predict when their demand is going to
2:14 Be. So this is pretty crazy, Mike, because this actually allows us with to treat the Spark engine just like you would if you were running a Python notebook. Just get it done and start running. This is impressive to me, Tommy. So like just in just in the first paragraph they’re talking about here, think about what’s happening here. Like I’m again my mind goes toward the architect side of this thing, right Tommy? You and I what what region are you in in PowerBI? Are you in the north region? No, I East two because that’s where I created my tenant years ago. Oh, okay. So your tenant for PowerBI is
2:49 In East two. So think about this this keeping this cluster of fabric enabled spark machines warm how many regions are there all these regions have to have some forecasting per region as to what’s going on with each of these models so Mike’s over here in north central that’s my my region north central US and when I get close to warming up that that spark cluster it’s got to know hey these are the tenants this is the traditional usage here’s where they ramp up and start using notebooks And so they can get you that
3:21 Sub, , couple minute, , couple second load up time for these spark clusters. This is amazing. I’m very impressed by this architecture and I’m happy Microsoft is sharing this because this is a really neat way of thinking about like what’s being built behind the scenes to make your experience fast and efficient and and about I’m not sure if this is something they just worked on or they’re letting us know that they’ve been like , hey, we’ve been doing this the whole time. you just didn’t know. But this is always a problem I would spark, especially for
3:52 Someone who’s a tester, wants to test things out or is dumb as I am, where it’s like, I just want to figure this out, see if it works, and then go from there. But the Spark again would take a while. This is pretty cool. Yeah, let’s let’s pull this down here a little bit. So, there’s a couple caveats here that I do want to point out, right? If you’re using the starter pool, right, the pools that Microsoft recommends you use or the ones that come out of the box, right? the starter pool sessions are faster to start because those are the ones that Microsoft is warming up. Note here in the documentation it talks
4:25 About like if you have like custom libraries, , a typical cold start, which means you have custom libraries, you’re going to cold start the VMs, turn them on, get them going, you’re waiting anywhere between two and five minutes plus any time to install the libraries. So, anytime you’re doing things like that, that’s that’s a very slow experience for you to get those VMs up and running. So, that’s one area that I’m thinking to myself like, wow, you’re taking things that used to take two to five minutes to run and you’re making them instantly available for me. That’s
4:56 A huge win because I don’t want to wait for two to five minutes to have something work or go do something. That makes a lot of sense. Thousand%. , they have a really interesting diagram here as well. They have like users and then user jobs and then a pool of clusters. So they actually have a really interesting diagram here about like which pools are low lat low latency and they’re fast and which ones need a little bit more time to run up. really like that as well. So I I’m very pleased here. I think this is a very forward way of thinking about Microsoft providing like the fabric and the spark experience as a a very easy to
5:28 Use service. So very much enjoyed this. I thought this was a really very detailed article and there’s a lot more in there that you can read too as well. The link for this article will be in the description down below. Any other comments on that one? Any other No, this is something and just a quick note, this is using works best with the default starter pool. So if you have your own pool or your own environment where you have your own libraries that you’ve added or spark properties it can take a few minutes longer or a
6:02 Few moments longer rather but the fast start by default is with the starter pool no extra libraries starts in a few seconds. Yeah it’s a big win. I don’t like waiting around first and foremost for just to turn on. I’m I’m just I I want to click that button I want the cluster to turn on. If I hit the notebook, I need the notebook to be on right away. I also I also have to imagine too, Tommy, there’s two parts of this world, right? There’s the world of Tommy, you’re the one inside fabric building a notebook. And then there’s another side of the
6:33 World, which is these are all the scheduled jobs that we have, right? These are jobs that are running a pipeline that contains a notebook in them. And so therefore you can basically predict very reliably how many clusters do you need on and running at what time so that those can turn on very quickly. So this I like this idea. I think this is really good. Dude, I love this and I’m I think a lot of people aren’t even aware this happens. So this is there’s nothing to turn on I believe. Correct. There’s no setting. This is just again I think this is more of like anformational piece, right? This is a discovery
7:05 Article that talks about how Microsoft is actively using predictions, forecasting to help the system build the right machines to turn them on and use them before users actually turn on those machines. So, I I think this is a great idea. I love it. Love it. Again, this is one of the things you get with an as an advantage with going mega scale with Microsoft. They can just build this stuff behind the scenes and then it just makes your experience just that much easier to use. So, I love it. All right, that being said, I don’t have any other news items. Tommy, let’s go into our actual topic of the day. Let’s talk about one-click notebooks if you
7:38 Don’t mind. Oh, I think I would love to. Ah, we have a caller on the line here. Let’s bring in our caller. , I’d like to bring back to our callers area, Emily. Welcome back to the show. We’re very happy to have you back on the show today and talking about this feature called one nick oneclick notebooks inside Microsoft semantic models. Awesome. Thank you so much for having me back on the podcast. super excited to be here. So, let’s frame out like what these things are. So, how do we get to them? I think the, , for our audience who who may have used them or may not, this is really centered around
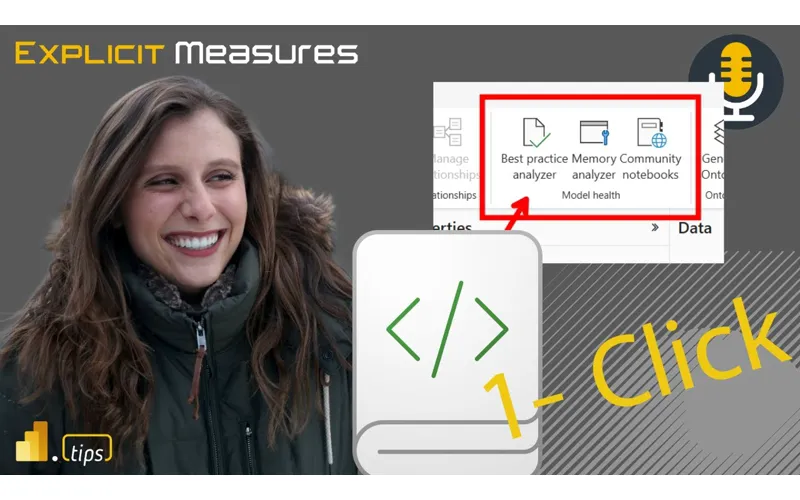
8:11 Modeling for the web. So, inside modeling for the web, you can go to this the powerbay.com service, click on edit model or click on assemic model. You’re then immediately taken into the semantic model editing window. And you’ll notice on the home ribbon about halfway down there’s model health. And so these notebooks that we’re seeing appear here are in the model health section of the home ribbon. And so Emily, what where did this come from? Is this a feature that was like highly demanded? Did the community ask this? What was going on here to like make this like part of like the modeling for web experience?
8:43 Yeah, great question. So I think there’s really two reasons why this came to be this feature. , one is because we just hear time and time again that having your model get in a good state, following best practices, having good performance is a pretty like time inensive process. So any additional tools that can help get your model in a good state and like learn what you can do to improve your model is really helpful. And like I think a lot of the work that’s been done for these notebooks is just thanks to community member involvement, especially folks like Daniel Uliker with his work on best
9:15 Practice analyzer and Marco Russo with Vertipac Analyzer. , so we’ve seen the community love those tools. We wanted to bring those functionality to in a more discoverable way for those users. So that’s part one. And then part two is we just wanted more people to become aware of the power of using semantic link and notebooks with PowerBI scenarios and make it easier than ever to get started using them. increase awareness that like hey this can really help you bring your semantic models and your different PowerBI solutions to the next level with even
9:47 More flexibility. , so that was the second part is helping make it clear like look with like notebooks and semantic link as the way to connect to your semantic models you can do amazing things like best practice analyzer like memory analyzer and I think a lot of that really stemmed from Michael Kolski’s work with semantic link labs helping show like with helper notebooks amazing things you could do with your models and the power of notebooks. So I really like these features. Let’s let’s talk about how how do we get these things actioned like so what happens you go into the semantic modeler when you click on these buttons it’s actually
10:19 Taking you out of the edit semantic model experience and it’s building you a brand new clean notebook and I’m assuming Emily you’re storing these somewhere on the Microsoft side of like keeping these updated and anything that Michael Kvolski updates like they’re already using semantic link again that’s what using the import semant senpai fabric as a fabric experience but it’s also doing more than just running the notebook. It’s running the notebook. It’s writing its own command cells. It’s automatically adding the data set the workspace and automatically
10:52 Putting them into the notebook for you. There’s instructions, there’s like details it has with that you can actually do the view experience and you have a table of contents. There’s a very lightweight table of contents that comes with this as well. So just that one click gets you into a space where you can start using performance analyzer or best practice analyzer on top of the semantic model. And I got to give a major shout out to your point as well here, Emily. Michael Kowalsski has like spearheaded this whole like Microsoft’s version of a best practice analyzer. I will give clear shout out. This came from tabular
11:24 Editor. Tabular editor was the original best practice analyzer idea. but Michael Kvasi took it to this next level making custom rules, defining rules, actually having a git repo where all the custom rules exist. all those things that he’s building out as well. And I’m going to go kick those over to Tommy. Tommy to you like you use I think best practice analyzer out of all of my friends who do this stuff probably the most like give us some vibe here Tommy Brown how BPA is important like why do we care about this stuff so best practice analyzer one from an
11:56 Individual point of view just to optimize your model and make sure you’re doing the right things from an accuracy point of view it from I call it the Indiana Jones of your semantic model and if you remember in the movies where whenever he went farther down the cave he always left a little device or symbol to know where he was and the rope to get back and a lot of times when we develop our semantic models they can get a little convoluted. So, can you find your way back to the source, back outside the cave? And best practice analyzer is a great part of that. Even better with
12:29 That, , you can use best practice analyzer across your tenant and in a sense get a rating to see , from an admin point of view, from an adoption point of view, hey, what if what semantic models in our tenant are not, , , adhering to explicit measures, not adhering to certain , factors? And we actually had a rating system around those best practice rules and we would say like okay who’s doing quality who needs work and it was all using scanner API and the best practice analyzers and this was before
13:01 Fabric so this was a lot of powershell and now that’s gone like so again it’s using a function so let me let me talk through a little bit of the notebook here I’m going to gush about the notebook here slightly like the notebook is two cells deep import the semantic link library so it’s going to install all semantic link labs directly on your cluster on the that notebook that you’re building there. And then right behind it, it’s going to run the BPA analyzer. So it’s going to be run model BPA. It’s going to pass in the data set and then the workspace. And what that does is it it combs through
13:32 That. And there’s a whole bunch of documentation around what BPA does. there’s a number of rules. Let’s see if I can pull the documentation here. let’s see here. Does it have where does Michael Kolski list all of his rules? Do where that is, Tommy? That’s actually a file. So it’s not like a markdown at all. So it’s actually a file that you download from the one of the tablet editor sites. So it’s very convoluted, but there’s a lot to it. But when you run the notebook though inside of BPA, where do those rules come from? Aren’t those just already built
14:04 Into BPA inside the fabric notebook? I think there it’s coming from a GitHub URL, a GitHub link. Yeah, I’m not sure about that one, Tommy, because I believe that the semantic link labs actually has the run BPM model. There’s like there’s like a standard set of like default rules that he’s applying. For example, let’s give let me let me give you a rule. , in a relationship between two different tables, right? I have a fact table and a dimension. You don’t need the columns shown in both directions, right? So, , the dimension is having a relationship and the fact table and one
14:38 Of the rules that applies is, hey, you don’t need to have those both shown. You might want to hide one of them. Typically, you would hide the one in the dimension t or in the fact table and maybe expose the one in the dimension table. That’s usually what you would build when you’re working across relationships. , another rule that the best practice analyzer goes after is birectional relationships. It discourages them. It’ll identify where you it finds birectional relationship and says look is there any way you can build your report. So you don’t have a birectional relationship. You should really go for a one to many type
15:10 Relationships. Again semantic models are flexible. You can build what you need to based on your use case. But there are best practices that don’t really fit that and you want to move away from that. Does that make sense? No 100%. I’m trying to pull up where this that’s actually coming from some of the rules, but those are all, like I said, there’s ones based on formatting, performance, and just optimization. Emily, any thoughts from your side around, , do you use , , you’re at Microsoft, you’re building a lot of new features. Do you use BPA on top of models? , I’m sure you probably like play with it a
15:42 Couple times. Anything you found there on the BPA side of things? Yeah. No, I definitely use it, especially like now that it’s easier than ever. , we do call it one-click notebooks, but I will admit it’s actually two clicks. It’s one to create the notebook for you with everything. Then you you have to click run all. So, there’s a second click. That’s true. That’s true. But it’s it is so helpful with getting your models in a good state. , it was something that like Zoe and I demoed throughout our FabCon session where we were getting competitive to see who could get their models into a state with less of the like warnings and like issues that were called out in best
16:15 Practice analyzer. So, it was really fun and helpful to use. for things like that. But yeah, I think it’s a really good tool and I would highly recommend that people try it out for their semantic models. I do agree there and and again again I’ll go back to like the the litany of things that Michael Koski has like built into this best practice analyzer already. It’s really useful to go look at what he’s building here and seeing again the rules that he’s supplying. we’ll also make sure we put in the description here, Tommy. I’ll have you put it in our in our notes here so we can make sure we put it in the
16:46 Description as well. will be make sure you go look at Michael Kowalsski’s git repo around best business practice analyzer items. There’s a lot of really rich materials there. Semantic link labs. There’s a couple other things that that are in play here for this particular notebook. Semantic link is by default built into notebooks. And so the reason why this is so nice is you can handle all the authorization of the notebook connecting to fabric. So to do what the BPA practice best practice analyzer is doing, you need to be able to authorize does Michael have access to
17:19 This semantic model. And the nice part about semantic link labs or semantic link is it handles that for you. It already authorizes me. It knows who I am and it can run all the APIs directly talking to the models and things and use that all behind the scenes inside semantic link. So that’s another advantage why you’d want to use these one-click notebooks is because you don’t have to write any extra code. It just works out of the box. Yeah, and that was the goal of the one-click notebooks is to make it work out of the box, easy to get started. , it really though is like just the launching point is just for your one
17:50 Semantic model you clicked from in that workspace. But Michael Kvolski semantic link labs has a lot of other rich capabilities and other helper notebooks you can bring in from there if you want to do things like what we talked about earlier like look across your full tenant at best practices across all of them. like there’s so many rich capabilities and flexibility that you can take these notebooks with and do even more than what was provided out of the box. So, correct me if I’m wrong here, Emily. Is is this run BPA function that’s using the notebook? And again, this may be just we’ll have to go do a little homework on this one. Is that running
18:22 Inside Semantic link labs or is it running in just semantic link? Was this a feature that actually got moved to semantic link? Yes. Yeah, that’s a great question. So we did bring the run BPA function and the one used for memory analyzer to semantic link but there’s a wealth of things in just semantic link labs which is more of the open-source like more experimental type environment that I would recommend checking out like in addition to the ones that we brought over to semantic link. Okay. And that’s let me give some other context here. This is more of like a little rabbit trail here slightly is
18:54 Michael Kowalsski has been building this thing called semantic link labs which is like the early prototype of features that may make themselves into semantic link. Both of these two features work really well together. and one of the things that’s out of the box when you’re using notebooks inside Microsoft fabric is you have to install something. If you’re doing semantic link already installed by default, it’s already there. There’s no there’s no Tommy, we’ve done a couple things back in in fabric days where
19:25 We’re working with notebooks. If you’re going to use semantic link labs, you use this this feature called pip install. So you do a pip and you install and it’s basically a command line that you’re running to install the semantic link labs feature into your model. And so you need to run that in order to install semantic link labs. for semantic link you do not already installed by default. another couple so let me just pause right there. Any any comments Tommy around what we’re talking about so far? No honestly right now there’s a question for you in terms of when we look at the
19:58 Community notebooks as well. One of the big things that Yeah. Yeah. BPA BPA. We’re going to get there. Let’s start. Let’s do BPA first. Any more thoughts around BPA before you skip to the new thought? No, I think we’re we’re great on BPA. Okay. The last thing I’ll just point out here as well with the BPA notebook is Michael Kolski has built inside this BPA piece, it’s actually building HTML, like an HTML section of the page here for you. And so he has features of the best p best business
20:31 Practice analyzer by formatting, maintenance options, and performance options. So even when you run these one-click notebooks, you’re getting the ability to see, are there formatting issues? Do we have maintenance level problems or is there potentially performance related issues? He’s categorized all the tests against the model to say if it’s good or not. And so look, for example, I just ran one on a model that I have here. , , I have a date table in my model, but I did not mark it as a date table. So it’s not marked as a date table, it’s just there.
21:05 And so one of the rules goes into your model and says, “Hey, I’m going to test your model and see if you have a date table or if there’s a date like table in there named dim date. Should you mark it as the date table?” So best practice would be mark that as your date table and then it will help the model a little bit. , another couple warnings it gave me here on my model, do not use floatingoint data types. So it’s actually checking the different datas on each column and making sure like it understands how it stores it. And then there’s recommendations as to not do that. I have a couple other here. there’s another couple performance
21:40 Improvements here. When you’re working with Excel, the the property around is set is available in MDX to false on nonattributed columns. Again, very nuanced, but like now you can check for that. And so this is just one model. Imagine running this over like hundreds, thousands, like across your tenant. Every time you’re doing a deployment, should you be running some of these checks? Yeah, I probably think so. So, I really like these notebooks from a from a clear starting up point. You can easily start with what it’s what it’s
22:13 Building here and expand and take it from there. [snorts] Any other thoughts around this particular notebook and then we’ll move on to the next one. I think it’s time because the a lot of people are used to or at least somewhat familiar with the best practice analyzer. But the next one, Mike. Yeah, let’s go. This has been new. Okay. So, Tommy, you want to talk about this next one? Yeah. So the model memory analyzer is another one of the buttons on the UI which actually shows you not just the what you’re doing right in terms of performance optimization your formatting but actually just simple statistics
22:46 Around your memory in the storage and around the objects in that semantic model such as what are the table names columns hierarchies and relationships. the statistics statistics run the memory can be used to look at basically your performance look at where you can reduce memory and really just almost close to the Vertipac analyzer I would say as the closest thing you’d think of so more or less the Vertipac analyzer without calling it the Vertipac analyzer so allowing you to simply see the data size your dictionary size if you’ve ever
23:18 Run the Vertipac analyzer whether in Excel or DAX Studio or in Tableau Editor being able to see where from a column table or relationships where your biggest bloat is. I think this is incredible. I’ve been in a couple classes from Maricuso in the past where he says he helps people optimize. So one of the things he does is consulting and Marco will go into a class and say look I don’t even need to see actual data in your model. all you need to send me is the Vertipac thing. And he’ll he’ll immediately know, oh
23:50 Yeah, the cardality in this column is too high. you’ve got relationships in a weird place here that’s going to cause performing issues. He knows already what that looks like. And I think as you get when your models are small, you have a lot of flexibility in making weird stuff maybe, right? Birectional relationships. your your data isn’t large enough to really cause it to slow down. So I think the semantic model is so fast that in those smaller models you don’t really recognize a performance
24:22 Hit. The larger you get the more you have to be careful around speed and performance and building good DAXs. And I think this is where when you start increasing the size of your models and things start returning very slowly that’s when I want to start applying the memory analyzer. What do you think Emily? What’s your thoughts on this one? Have you have you seen that it like that pattern as well? Yeah. No, I’ve definitely seen that pattern and I think that we’ve just heard so many people across the community finding so much value in having this data available about their
24:55 Like memory and performance statistics of their model. So that was the goal is just to make it easier than ever to get started and seeing that especially in the web. And just again, huge thank you to folks in the community, especially Marco Russo on this one of helping pave the way to giving people access to this information. Column statistics is a major win. Tommy, do you have any examples of like models that you’ve seen where you like what did you find and how did you fix the size of the
25:26 Model? Almost cheating here, Mike, because most models [laughter] Okay, go ahead. It’s allowed. No. Yeah. So honestly, one of the easiest ways on any model, especially if I was taking it over, was looking at the Vertipac analyzer and looking at the column and table. In most cases, the usual suspects was someone was using they had an email column or date time and it was not being used anywhere in the model. They weren’t using it for relationships. They weren’t using it for any DAX statements. It was just date
25:58 And time that was just being run there. And a lot of times that can a few of those columns can run up 40% of the entire model’s dictionary size just that one column. And so once you remove that, you remove some of those unnecessary text columns like URL if you’re not using it or email address if you’re not using it. it saves a ton of space. So that’s one of the things I look at anytime I would take a new model or even on my I’m actually have a model I’m going to look at today and just take a look
26:30 And see okay what can we do what is really unnecessary that’s the biggest thing is to take a look at do I really need that column especially since it’s 25% of my entire semantic models data dictionary size so it’s a really important and that’s a big thing for me so I’m going to give you one other example that I’ve used in the asked that I have found not it’s not a bad thing. It’s just people are just unaware I guess would be more of what it is. Have you ever seen the temporary tables for date time columns or date columns? So
27:04 When you have auto date time turned on. Yeah. Oh yeah. Well that’s right. Okay. So in a smaller going back to like my analogy of like the smaller models in smaller models when you have just a handful of columns and a handful of tables like there’s maybe like maybe two or three date columns in there. When your model gets larger and there’s a lot more date columns, especially if you’re talking like manufacturing or shipping or logistics, right? There’s going to be a order on date, there’s going to be a shipped on date, there’s going to be order received date. Like one one fact table could have three or four date tables in it. When auto date time is turned on, every single additional date
27:38 Column gets its whole brand new date table, which is not bad. It just exists. But you’re not exposed to that in like PowerBI desktop. like desktop doesn’t show you all the hidden tables that are there but they do come out when you have the memory analyzer you can see those tables appearing now having more data tables I’m not too worried about not a problem however people are tricky and data systems are sneaky so and what by this is I’ve experienced models where data was being loaded from
28:10 A source system and sometimes there’s not a date for something but the system requires a date to be populated ated in the field. And so sometimes you’ll see 1 1900 or you’ll see one 999999, right, as as the year. So what’s happening in these data columns is the semantic model is grabbing the smallest date and the largest date and building a date calendar for every single day that it finds between that min and max date. nice that it does it for you
28:42 Automatically. But if you bring in bad data inside the date column, right, you now have built a date calendar that has like hundreds of thousands of dates in it without without even really knowing, right? And so it’s it’s that type of like that’s where I’ve seen to your point Tommy I’ve seen 30 40 50% of a model just taken up by date calendars because we had a lot of date fields and we’re now building these monolithic date tables that we really don’t need. Right? If instead we want to build like metered
29:14 Tables of what we really want to have from the data model. So that’s one big example here of in making a model easy for you to build as a developer. calendar auto on you actually make it very expensive and very bloated. It could be really large. there’s there’s gigabytes maybe megabytes hundreds of megabytes maybe taken up by these data tables that could be removed from there as well. All right Emily any examples that you’ve seen where where you like to see business practice analyzer do some
29:47 Helpful things or what have you identified in some models that maybe BPA helped you out with? Yeah, I think that the date table one is probably one of the most common ones we hear. [laughter] So, I was very unsurprised to hear that one. , yeah, I think there’s like a wealth of a lot of different pieces both in the memory analyzer, best practice analyzer. I think a lot of formatting things also is one I see all the time in best practice analyzer specifically. That’s true too. Yeah, I’d agree with that one. Formatting incorrectly with the wrong data columns. That’s another big one.
30:19 Exactly. Another one that I think I see a lot of is high cardality columns. Have you seen that one’s okay? Yeah, you’re not you’re good. [laughter] I think that one comes up pretty often all the time. So for those who are not familiar with when I say high cardality columns, right? So you imagine a dimension table and we have let’s say products right in our dimension table maybe we have a thousand products. When you flip over to your factual table, the one that has the relationship through to your fact table, you have product, date, time, dut, like all these different things. So, the more
30:55 Dimensional pieces you supply to that main table, the more information that’s going to be supplied to it, it’s going to be this larger, , more intense table. and so when you have so much granularity you can step back and say what is really what are we trying to analyze here right so another example would be is like time ranges right I’ve had a customer say we need 10 years of data okay all right fine happy to supply you with 10 years of data in your semantic models let’s talk about the granularity of the data
31:28 And so initially the customer had built like all the way down to like the minute transaction level of like what stuff was being sold are being bought by. So 10 years of data down to the minute level by products with all these other dimensions, it caused the fact table to get like extremely large with really high cardality columns. , and so what we found is we needed to reduce some cardality in those main tables and even producing some shortcuts, maybe aggregation tables to some degree to
32:00 Like really help you. Like if I want to look at data, I’m not going to go back and look at every single minute for 10 years, right? I’m going to look at monthly sales, right? Weekly sales by product. So you can drop the granularity of your tables down to something that’s much higher like day level. let’s count all let’s sum up all the items that were sold on this day and that makes a big difference which can really reduce your model and I think my first time interacting with this one time do you remember when we saw I think you were there with me at the time we were we were at a Microsoft fabric maybe it was
32:33 Data insight summit something way back in the day and Christian Wade was talking about let me show you a query that can handle a billion rows yeah the taxi right yeah the data taxi tables So Christian shows up and says, “Hey, let me show you a query that will run across a billion rows of data.” And what they were doing, there’s this auto aggregation experience that was like building tables and aggregating them up. And so even though I was showing lots of data for like a billion rows, you could actually aggregate that information up and group
33:05 It by month or by year and it made it a lot easier to to digest. So these are I think tricks of the trade that we have to really know like what our audience is doing. But that’s where the memory analyzer comes in as well. Any other thing, Tommy, that you’d want to point out here about memory analyzer? , like I said is really the Vertipac analyzer that you used to in the external tools. For me, Mike, it is a pretty essential part that I love actually now having in fabric. And Mike is one of the ideas here too and
33:36 Actually I’ll I’ll pose this to both of you. One of the ideas here not just for this to be for the individual where I’m viewing my semantic model on the web but also from a collaborative point of view because really anything that is in fabric becomes much more or the potential for something to have a process or work in a team like best practice before if I want wanted to really run anything I had to deal with my own machine but is one of the ideas to add this as a semantic link labs for it to be
34:08 Either a easier to access or b more from a community or team point of view. I’m not sure if I understand where you’re going, Tommy. If you’re saying like the one click notebooks like what’s the need here? Is that what you’re going Yeah. The big the bigger need like is there is one of the opportunities here? One of the reasons why it’s actually built right as a button into the semantic model is we actually want to build this for teams to go through rather than just an like for myself I can easily go and open tablet editor on my computer but that’s me as an individual. There’s no me
34:41 Reviewing my Yeah. Yeah. Okay. I think I get where you’re coming with this Tommy. One thing that I’ve seen and again maybe Emily you’ve seen this this feedback as well is okay Tommy you’re an expert you’re a prodeveloper on top of semantic models think about what tools you’re allowed to use as your organization Tommy you’re a professional you got your own computer you have access like you can install anything you want on your machine some customers don’t allow them to install like DA studio right so some so when you when you remove that away from
35:13 Prodevelopers I think there’s an argument to say here. Microsoft should be providing all the tooling we need to do all the performance things. And again, I know totally agree with that. Your te your team is only so big, right? There’s only so many features we can focus on, right? Some of this is entry level people starting with a beginner experience, but also there’s some prodev prodev experiences as well. So, , Microsoft, this is why some of these tools evolved as ALM toolkit, DAX studio, tabular editor, right? There’s some these tools enrich the experience we already have with fabric.
35:45 Nothing wrong with that. But some organizations say, “Look, we’re not going to let you install anything. If it doesn’t come from fabric, if it’s not in the the existing ecosystem, we’re not going to let you do it.” And so, Tommy, this is where I would say, yeah, the semantic link makes a lot of sense here is because it’s already built in. It’s a single one-click notebook. And then I don’t have to install any new tools. It’s already available to me. So internally, Tommy, like you as the expert, I would work with our team and say, “Let’s explain why this tool is important. Let’s go through and run a couple of these.” It becomes part of your process as a
36:18 Company to help them evaluate like what’s a good model, where is things more efficient. , another story that I have here around when do I need to really start tuning models is when models start getting big and when you start running up against the threshold limit of that one gigabyte model size. , so while this is in fabric, , a little bit different story here, but like if you’re in a prouser account or in a pro workspace, you need to be able to run that model and figure out, okay, does that model
36:50 Exist below the one gig threshold? Because you have a one gig limit size on models you can serve in that workspace. So if you’re pulling a lot of data in, if you’re pushing the boundaries, you’re going to get model failures to not refresh, to not load, if you’re pushing that upper boundary of how big the model is. So, I think another, , use case here, Tommy, is you’re you’re going to need to know the size of that model before you upgrade everyone to premium per user to get bigger size models. Does that make sense there? So, there’s a lot of like negotiation in there.
37:21 Yes, a thousand%. One thing I’ll also point out here, Tommy, are you familiar with the temperature of the model? Have you seen that before? Oh, yes, I have. I’m trying to [snorts] remember where, but you’re going to have to remind me because that’s not in our notes, but I I’ve heard that. I’ve heard that. Okay, sounds good. So, one thing that’s really interesting to me, so and again, Emily, you’ll know this as well from like the Microsoft side, like as you use the semantic model, there’s this column called temperature. And the temperature is like if let’s say for
37:54 Example, I have a semantic model and I run a PowerBI report. When those visuals access data columns from the semantic model, those columns quote unquote heat up with a temperature. And one way to see the performance of your model is or even evaluating does this model need to have how do I say this? What’s being used from the model, right? which columns are being leveraged? And so as you hit the individual columns in the model, the temperature rises. And
38:27 So what you can do with the BPA the the model memory analyzer is if your model is regularly being used like on a production model, you can run this go get all the list of all the columns and their associated temperatures. So imagine for me with you and we’ve done this on a client where we had a discovery session. We were trying to figure out okay who’s using this model and what are they using in the model. It’s quite complex to do that because you can have the reports, you can know what columns are linked from the reports, but if someone never visits page two and only uses page one, you may not use all the elements of the model.
39:01 And so that’s where this column temperature comes into play here where you can actually look at in points in time the temperature of all the columns. Now also with temperature, think about it this way. If I hit the column, I heat it up over time that column slowly cools down until it’s no longer being used. And eventually the temperature drops off altogether for that semantic model. So as you’re running the models, these temperatures of columns are going up and down dynamically. And in the morning, the temperatures may be
39:33 Different in the afternoon, the temperatures might be different around noon. Tommy, you do a lot of advertising or marketing or whatever. at the end of the month when you’re trying to figure out spend and budgets, there may be a lot more hits on these models. So, if you use this memory analyzer and capture many t points in time of the temperature of the columns, you can actually get like a a really interesting picture as to what people are using from the models when they’re using them. So, , Gilbert, I got to call out another community member here. Gilbert over at Formu has done a really good job explaining like what is the column
40:06 Temperature? How would you get it? How can you use best business best business practice analyzer or the memory analyzer to go get that information out of the model and and show it to you and store it somewhere for later? So again, another thing I’ll point out here about these notebooks are the notebooks are making data. They’re data frames. You can store them as a data frame. can you you can go save this data for later. so let’s go back to the memory analyzer again, right? You have x number of tables. You can see in the little HTML page that micro koski gives you. It
40:40 Tells you the dictionary size. It tells you the total size, the row count. There’s a lot of statistics that come out of those tables. Well, you could save that every time you do a deployment. And so you could actually watch your tables grow over time or size your tables or figure out which one’s growing faster than others. So again, using this built-in tool, you can automatically start snappy snapshotting like historical values of how efficient your model is being built. So that’s another another use case there as well that Mike that goes on unless you had anything more with the memory analyzer about really not just what’s
41:13 Already those two buttons, but there’s a third button on that semantic model page. , there is there’s one more in there. And do you want to get to that or is there anything else you wanted to say when it came? Oh, I’m I’m good with the memory. I could spend all day long on memory analyzer and give you examples of like what works and what Regardless, I like the fact it gets a two click twoclick notebook. I’ll put air quotes here. Two click notebook for you on the memory analyzer. So you you can go get that already. Click memory analyzer and then you hit run on the notebook and it’ll just it’ll run the analysis on that particular semantic model. So
41:44 All right, Tommy, last feature. Last feature is the community notebooks. And this is not just the only ones that are allowed, but these are the ones that are actually in the Microsoft notebook gallery or the submit the yeah the notebook gallery on the PowerBI forum. Remember galleries, Mike? They were great back in the day. So they’re they’re good. it’s definitely good to have examples. And one of the things I’m very happy about what’s happening here in the gallery, , people are putting direct links to a URL of a notebook. You can see the code that
42:18 People are writing, evaluate it directly from there. So that that’s I really like this idea of being able to have notebooks that exist for people where they can go download them and interact with them directly. A lot of people are putting like GitHub links on the community page as well. So you can go right from the semantic model, go right to the the shortcut to the gallery. And let’s, , Tommy, let’s pick out some things that are here. Michael Kowalsski has a number of ones at the very beginning like his the oldest ones where he’s talking about I think there’s like six pages now of notebooks but he’s got hey you’re doing a direct link migration to semantic link labs right if you want to do some migration
42:51 Pieces he’s got that figured out he has a delta analyzer so like you have delta tables you want to understand where your lake t lakehouse tables are how big they are other things there as well he has a best practice analyzer report. So, not only can you run BPA, you can build a semantic model and from there you can build a pre-built report also using the BPA experience. So, that’s another one as well. So, a lot of useful tools in addition to like just cool stuff.
43:23 And Mike, the thing is it’s not just global. The one thing I really like about it being in the gallery and also some people linking to to GitHub is all you have to do in the gallery is simply sort by the top kudos. So, I’m looking at some of these here as well in the gallery because there’s a ton and like Nadine Hedge has a few that are like the top kudos notebooks based on the community which one is we’re looking at here is the simple looking at the strategy for resiliency and availability for a report. It looks at the backup for
43:58 Reports across workspaces. So, it simply allows your report and the smanting model to be backed up. A few other ones that are here as well is looking at the semantic line model lineage a notebook to analyze and visualize dependencies across semantic models which is again just simply one notebook you can upload also connections lineage looking at data connection dependencies across Microsoft fabric workspaces. So there’s a ton here, especially when you’re looking at and this GitHub repo has a ton of
44:33 Different semantic or notebooks that you can upload as well. So there’s a ton here from the community that you can just test out. They’re also on GitHub. They’re not necessarily only in the gallery. Yeah, [snorts] that’s true too, Tommy. Again, a lot of people here are putting notebooks that they’re finding valuable. Shannon Lindsay is is the individual who’s running the community here. So I got to give Shannon mad kudos on this one as well. having any place where we can collectively grab, , usage of things or pulling data together. There’s actually a couple competitions that are even out there now. So, you can actually go out and and
45:05 Use this. They did this competition around cities of tomorrow, smart urban sustainability planning, right? So, people are building like notebooks around how they would use this. They have a data source that’s out there. so, you’re going to see a lot of other examples here. There actually some competition pieces. other things I see here are useful. , why not ingest all of your docs from SharePoint into the lakehouse? Someone built a notebook for that. Could be useful for someone. , , PowerBI access audit, right? Where are all your workspaces? What users do you have? Let’s run the notebook, collect all the
45:38 Data, and put it in a lakehouse. So, that’s another thing that you can use here as well. There’s a lot of really interesting things here. , one that I like is delta table statistics and maintenance of delta tables. That’s a great example of something you’d want to use. Saving yourself some more space and memory there as well. So, anyways, I like the community pieces. You will have to dig around. Let me just be cautious. [laughter] That’s not it’s not like you can’t just go search. It’s not a doesn’t have the greatest search that you have out there. but definitely look for like the top kudos. Look for the most featured notebooks. those will also help you find useful
46:10 Notebooks on that space as well. All right. Well, Emily, I got to say thank you very much for this other feature that you guys have enabled. I know this has been like a team effort. I know you’re the one who’s just making the buttons show up, [laughter] having them there in the the model editor for web. So, we really do appreciate it. These are really great features. If you’re not using today these notebooks, I’d highly recommend you go to the service, check out best practice analyzer, check out memory analyzer, and look at the notebooks that are in the community. I think these will enrich a lot of your developer
46:41 Experiences around creating semantic models and make you a better a better person for building data models and things. Tommy, any final words you want to capture off here as well? No, honestly, I do have a starred list in my GitHub account that is just a bunch of fabric repos. Some of them are notebooks, some are not, but honestly, there’s a ton more than just what’s in the gallery as well. I would agree with that as well. Emily, Emily, any final thoughts, what you’re thinking here around these notebooks and two click experiences as we like click baited you into this this video or
47:13 This episode. [laughter] No, love the clickbait. , and like you said, like I was just, , involved in making the buttons appear, but this really from the beginning started from a communitydriven initiative. We saw so many folks in the community excited about what Michael Kolski was doing, what already has been developed for so many years by people like Marco Russo, Daniel Oter. We’ve seen so many like different innovations using semantic link and notebooks that we just wanted to make this more readily known and easier to get started because a lot of these helper notebooks do make it easy if you just have your like semantic model like already ready. You
47:46 Can just plug in that information into the function and hit run. So we just wanted to make it easier to for you to get started and for folks in the community to upload and share their own notebooks that they found helpful and discover notebooks from others. So this is community initiative from the beginning. We are so excited to see everything that the community keeps doing with semantic link notebooks and PowerBI through the different contests that like Shannon’s been doing and just in the gallery itself. So huge thank you to the community on this and I’m so excited to see all the innovation that keeps happening. Also just shamelessly plug some stuff as
48:18 Well there. So James Bartlett and myself have been doing a learn semantic link lab series on YouTube. So, if you want to check that out as well, we’ll make sure there’s another link here in the description around learn semantic link labs. , that’s like an ancillary topic against what’s already happening here. But again, notebooks are the way to go. I think they’re fun. I love working in them. It shouldn’t be scary for anyone to get in and use them. And then these two tools, Semantic Link and Semantic Link Labs really provide a wealth of functionality for you to manage your fabric environment, your notebooks, your semantic models, reports
48:50 Even. you can do a whole bunch of really neat things in there using these really rich tools from Microsoft. So, want to encourage you to learn more about those spaces. And Emily, thank you so much for your time today. We really appreciate you being on the podcast and discussing this really cool feature that I love. I use it fairly frequently and I think the community should should learn more about this as well. With that being said, thank you all so much. We know you can spend your time anywhere else doing other things like getting actual work done for once. So, we do appreciate you spending an hour with us this in the morning to get through your podcast. Hopefully, you’ve had a good run or
49:23 Exercise or whatever you’re doing to get into work this morning and you’ve enjoyed some of this topic around one-click notebooks directly from semantic models. That being said, Tommy, where else can you find the podcast? You can find us on Apple, Spotify, wherever get your podcast. Make sure to subscribe and leave a rating. It helps us out a ton. If you have a question, idea, or topic that you want us to talk about in a future episode, head over to powertive/mpodcast. Leave your name and a great question. And finally, join us live every Tuesday and Thursday, 7:30 a.m. Central, and join the conversation all of PowerB tips social media channels.
49:55 Thank you all and we’ll see you next time. out.
Thank You
Want to catch us live? Join every Tuesday and Thursday at 7:30 AM Central on YouTube and LinkedIn.
Got a question? Head to powerbi.tips/empodcast and submit your topic ideas.
Listen on Spotify, Apple Podcasts, or wherever you get your podcasts.