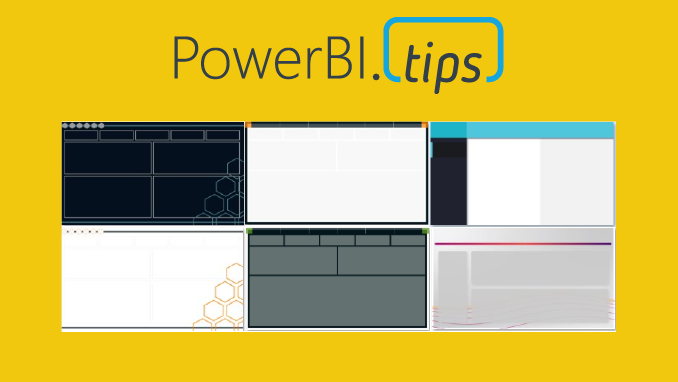
PowerBI.tips is excited to announce our new tool to help you build the best looking reports, Scrims.
We’ve built out a fast and easy solution for snapping visualizations into place while giving your reports the extra special look and feel that allows your audiences to be impressed without losing focus on the important stuff. We developed Scrims to give you this shortcut to amazing looking reports
16:9 (1280 x 720) examples
What are Scrims?
A Scrim is a background image that you would use on your Power BI Report pages. Why the name Scrim? The term scrim is used in theater productions. It is a backdrop that is placed on the stage behind the actors. It adds context & engages the audience with the production. We thought this idea crosses over well with Power BI.
A scrimcan change the mood of a theater just like a well designed background image in your report. Scrims were developed to be easily adaptable to different color themes and in each set of offerings we release we’ll be providing you with as many color options as possible.
Why Do I need One?
Scrims solve several problems.
The most important problem it solves is time. As BI practitioners ourselves we know the demands that are placed on you. More often then not the visual look and feel gets the least amount of attention due to deadlines. We want all the time you invest in the data and building visuals to impress your audiences by being presented in a beautiful way.
Scrims are designed the same way we developed Layouts. By emphasizing proper design focused on the Gestalt design principles to ensure the end users experience enjoyable and non-distracting reports.
Using a Scrim you will reduce the number of objects on the page. Less elements means faster rendering reports. Here is a blog that tests this by adding more visuals to a page “More Visuals Mo Problems”. Scrims add the illusion of a very large number of objects without a negative impact.
Scrims come in a Bundle
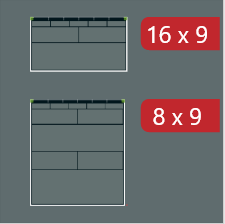
A Scrim bundle contains a series of images that you can use in any way you want in your Power BI file. Each Scrim will have different page sizes to best suit your report needs. Every Scrim will contain a default 16 x 9 (1280 x 720) aspect ratio. Most Scrim bundles will have additional ratios such as 8 x 9 (1280 x 1440) or 4:3 (960 x 720). You will see the sizes prominently displayed for each bundle with the red tags.
8:9 (1280 x 1440) examples
Each bundle contains 6 pages minimum for each size, which means on average you will receive at least 12 pages in each bundle. Each Scrim bundle also includes the color theme that corresponds with it in JSON format to easily upload into your Power BI Report.
Thanks for your interest in our product Scrims. For more details on what is a scrim click this link to Learn More.
Download a scrim from the products page. You can access all the available scrims here.
Instructions
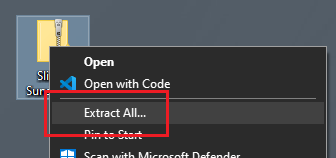
After downloading, you will have a Zip file stored on your computer. Right Click on the zip file and Select the option Extract All from the drop down menu.
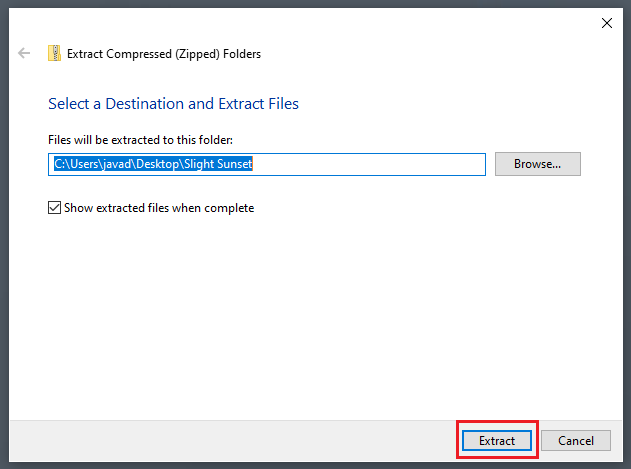
The extract compressed folder menu will appear. Click on the Extract button found in the bottom right corner of the menu.
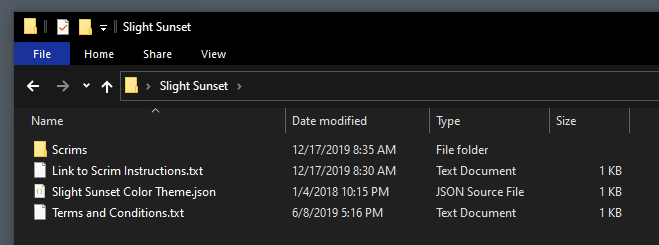
A new folder will be extracted to the location noted in the previous menu screen. Open the newly created folder. Within this folder you will find all the images for the Scrims and a JSON theme file to use within your report.
When working with scrims it is helpful to see which image contains the the correct background layout for each of your pages. I find that it is helpful when reviewing images as Extra large icons. To turn this on, Open the View ribbon in the File Explorer. Then in the Layout window select the option titled Extra large icons.
Add Scrims to Report
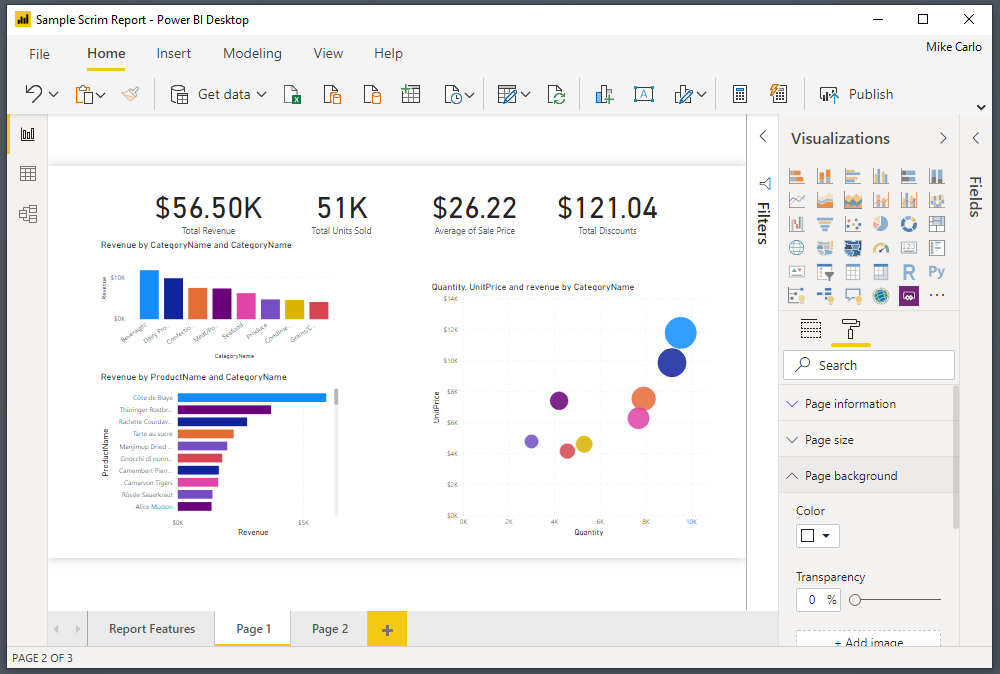
Open a Power BI report in the Power BI Desktop application.
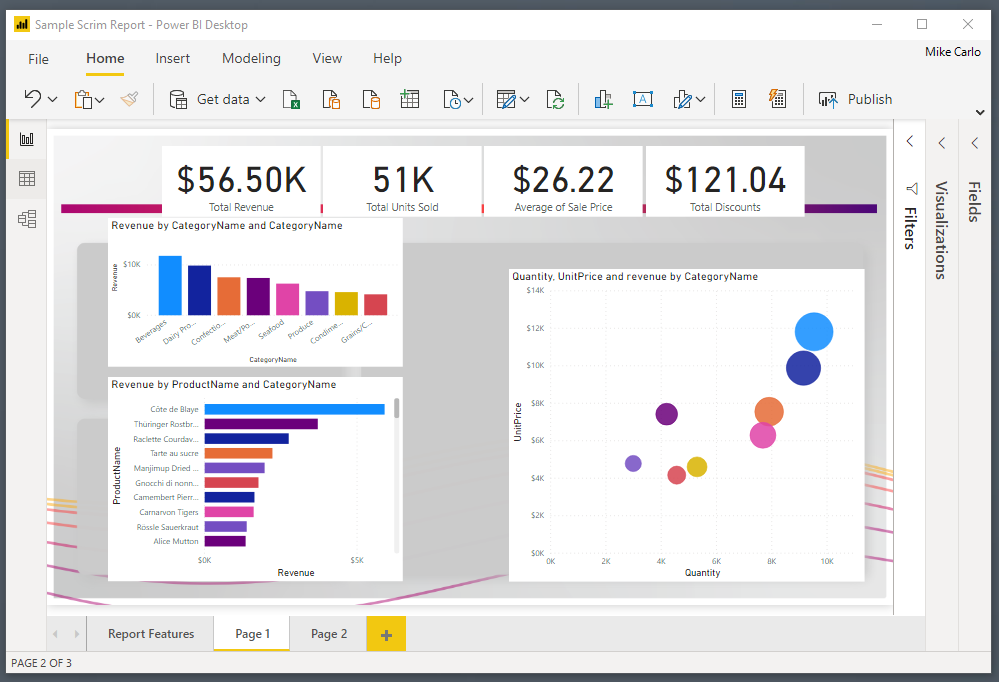
Note: Reports do not necessary have to be brand new. You can use scrims on existing reports. For illustration purposes an existing report was opened with only visuals. The remainder of this tutorial will show you how to add scrims to a pre-developed report.
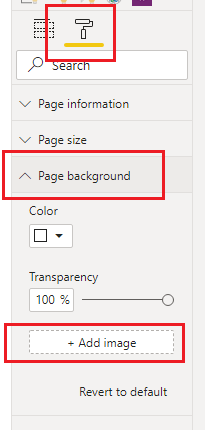
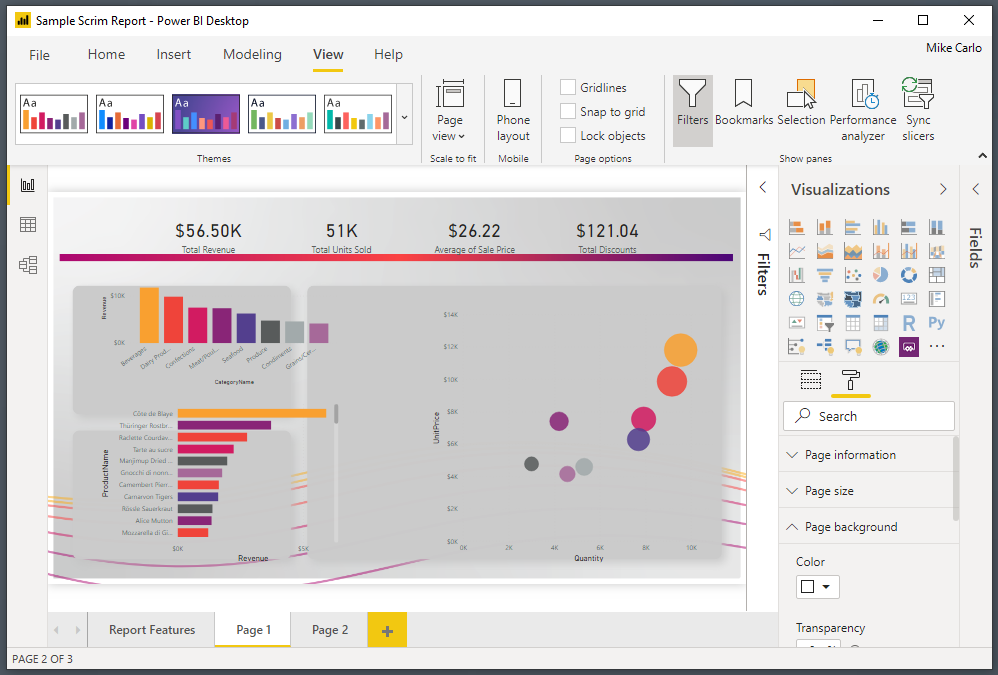
Click on the Paint Roller button. Then Open up the Page background item in the menu options. Click on the option labeled Add image.
Note: for these options to appear you have to have a report open and none of the visuals selected on the page.
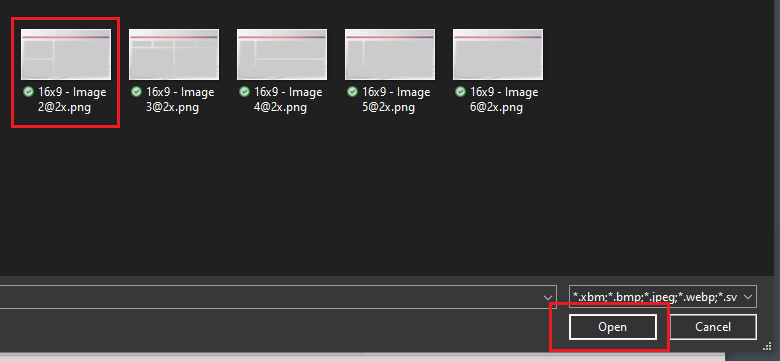
In the open file selection dialog box pick the scrim that you want to load. Click on Open to load the image to the report page.
The image will not initially appear. This is because the default settings for background are set incorrectly for this feature. Change the transparency to 0% and adjust the Image Fit to the drop down option of Fit.
Note: Images provided in scrims are larger than the report page pixel size. This is because in order for the images to not look blurry we have to supply a larger image. The Fit feature then scales the image back down to the report canvas size but retains a crisp and clean look.
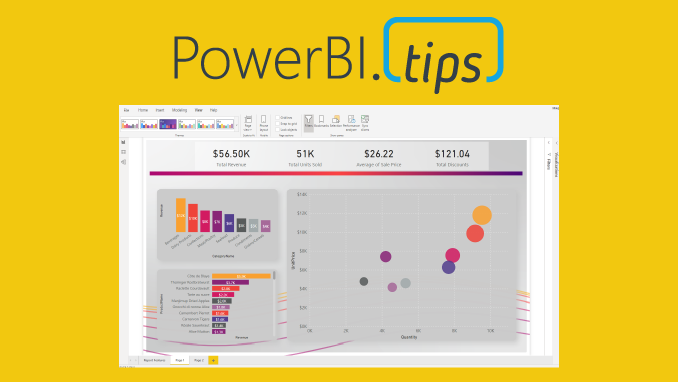
Our report should now look similar to the following:
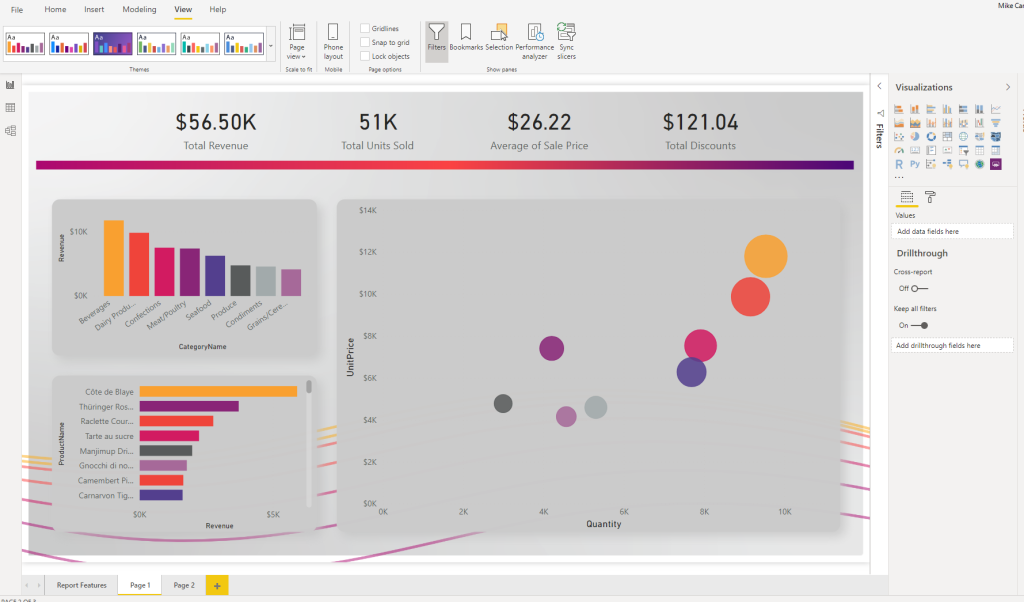
Add JSON Themes
Initially the visuals will not be formatted for the style of the report. We can control this by using a JSON theme file to pre-format some options for the visuals.
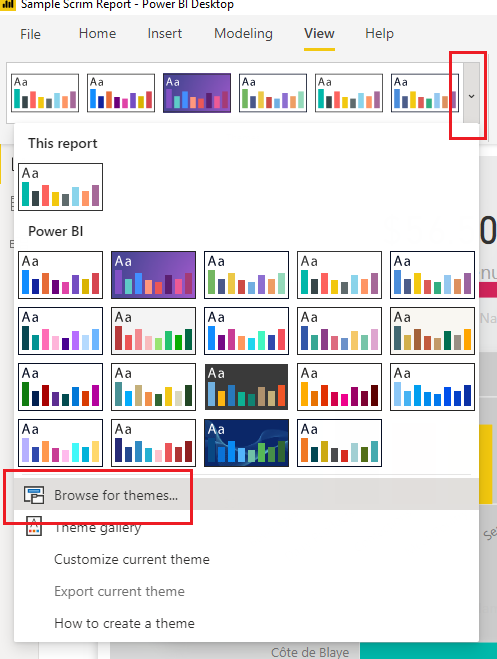
On the View ribbon, select the Drop Down Arrow icon. Then Select the option at the bottom of the menu titled Browse for themes…
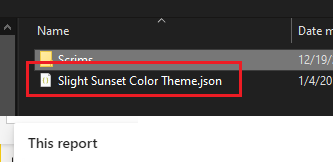
Navigate to the scrims download folder and add the supplied theme with scrim download.
This will apply formatting for the colors and some Visual style properties.
Clean up Visuals
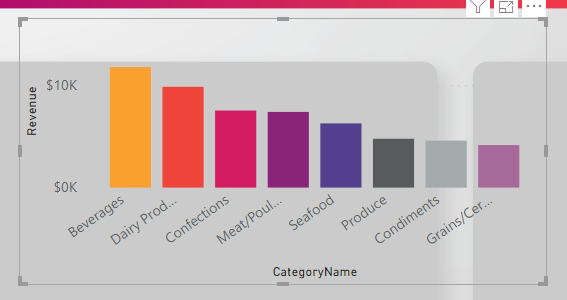
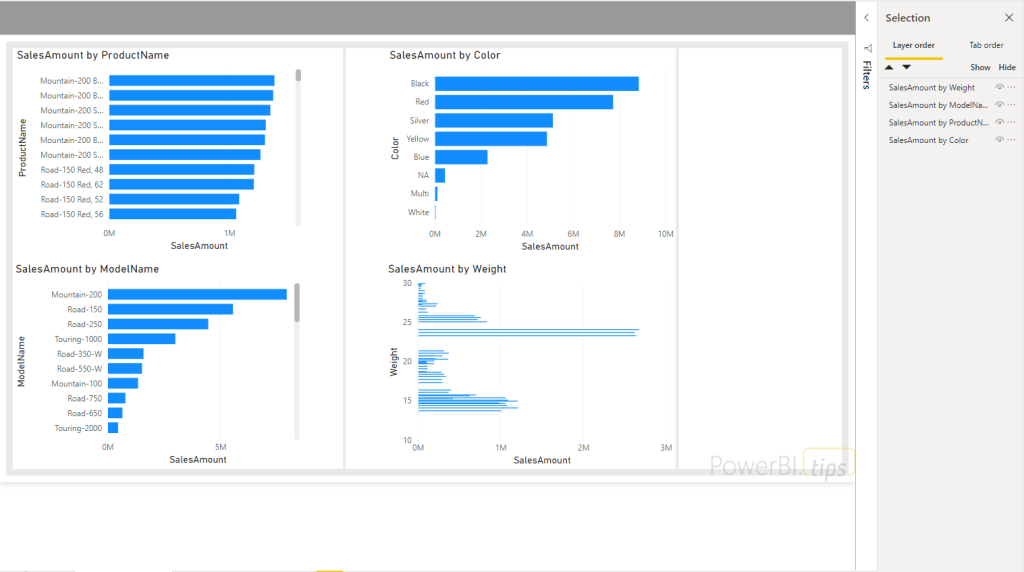
Next Select individual visuals and Align them to the defined areas within the scrim.
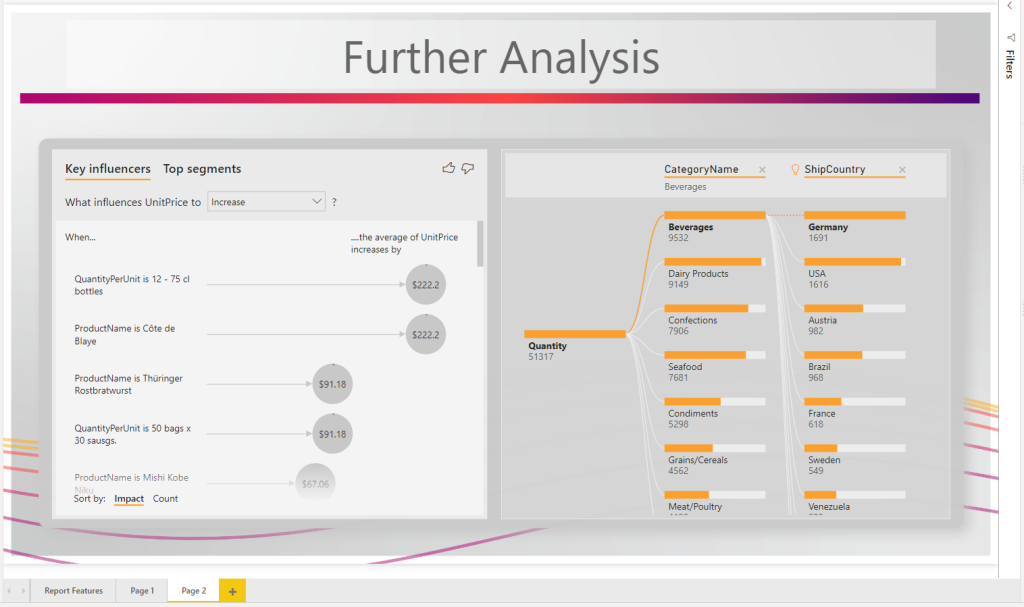
See sample image below with visuals aligned to the scrim.
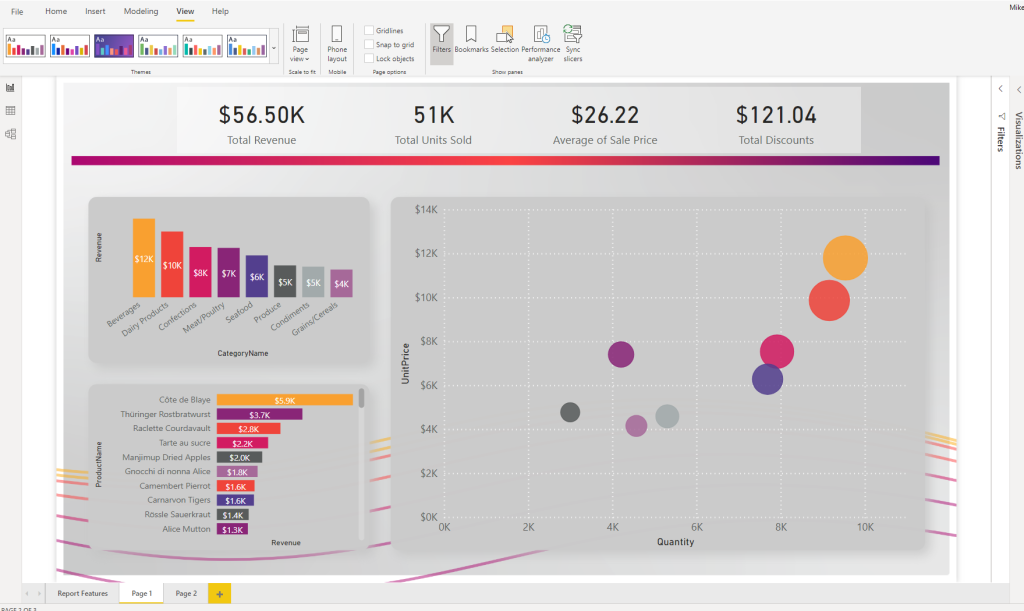
Finalize Report
Apply any additional style properties for your visuals. In the below image the following settings are added for reference:
The top 4 cards are grouped and the group
The Grouped cards were applied a background of white @ 40% transparency
Labels were added to the bar charts
Unneeded axis were removed from the bar charts for clarity
White lines were added to the scatter chart for x and y axis
Then rinse wash and repeat for every other page you need to develop.
In some recent conversations the notion of minimizing the number of required visuals came up as a topic. While I know from talking with the Microsoft development team more visuals on a report page increases load time. But I haven’t been able to find any substantial numbers on how performance is impacted by increasing the visual count on a page. Spoiler alert, adding a ton of visuals to a page slows it down.
Test Set up
To begin our test I started with a know report the Microsoft September 2018 Layout. This was a good sample as it already had a number of visuals and buttons on the page. I then proceeded to create a single text box with some text in it. Then copy the text box over one hundred times. All the text boxes are placed into a single group. Grouping the text boxes allows for the ability to toggle on and off all of the visuals with a single click.
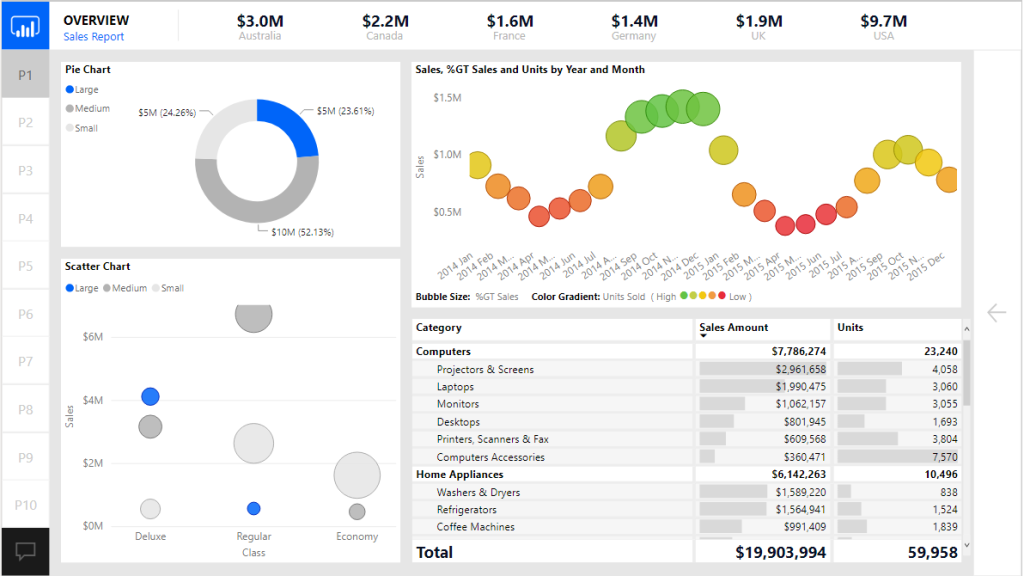
Here is the before image of the report with the text boxes turned off:
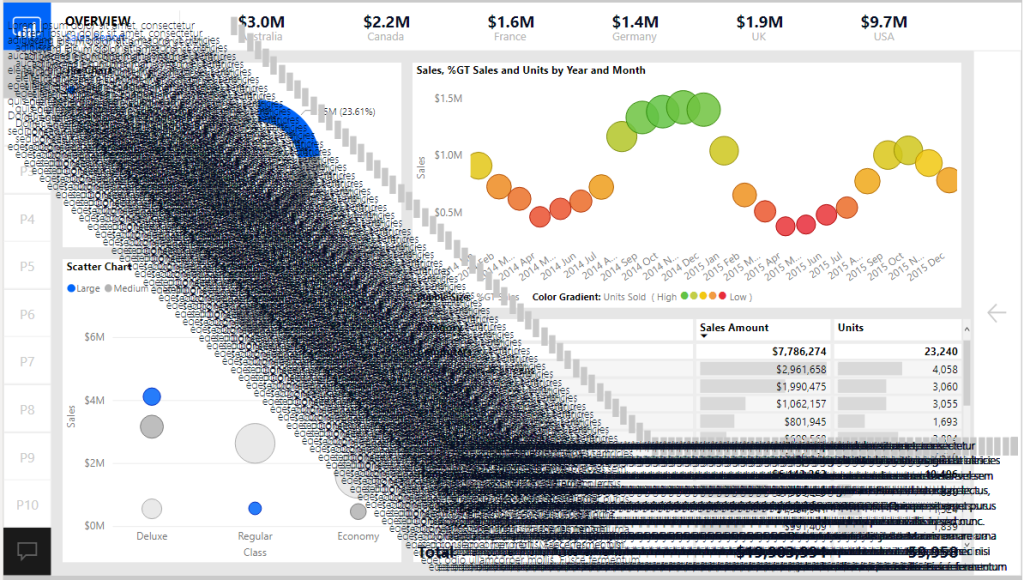
Now with all 100 text boxes turned on. Yes, not pretty I know, but it makes the point.
Conducting the Test
Now that the set up was complete we are able to use the performance analyzer to render all the visuals on the page.
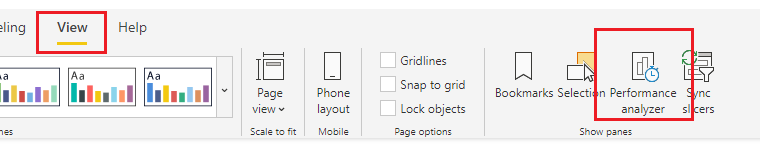
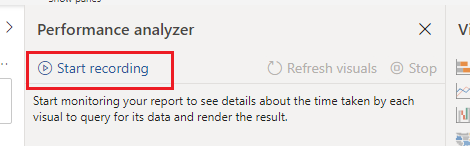
To open the performance analyzer with the new modern Power BI ribbon. Navigate to the View ribbon and click on the Performance analyzer button.
With the Performance analyzer window open we Click the Start Recording button. This begins how the visuals perform when you interact with the report.
There are two options at this point to start recording data.
We can click on items on the report page
Click the Refresh visuals button to refresh the entire page
I chose option number two since I wanted a consistent method to record performance. This removes any human error by performing a sequence of clicks across the screen.
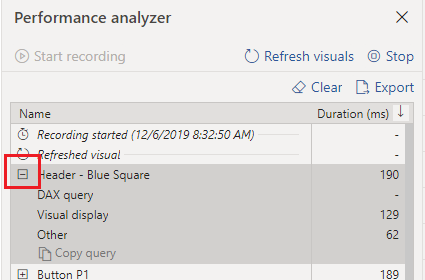
After clicking the Refresh visuals the Performance analyzer generates a ton of data that we can sift through to understand performance of the report page. You can expand on one of the visual elements to understand how many milliseconds it takes for the visual to render by function.
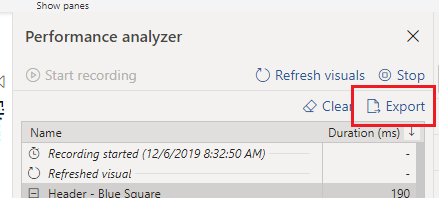
We can now export the data from the recording by Clicking the Export button.
For my test I ran 5 performance tests with the text boxes turned off and 5 tests with the text boxes turned off. The process was the following:
Click Start Recording
Click Refresh visuals
Click Export to extract the data, name the file for future review
Click Clear to remove all data
Go back to step 2 to Refresh visuals
Repeat process until 5 performance tests are complete
Turn on the Text boxes and repeat the process for 5 performance tests
The Test Results
Finally we can dig into the data and figure how much impact we incurred from all the visuals. After a bit of playing around with the datasets in Power Query we are able to come up with the following results.
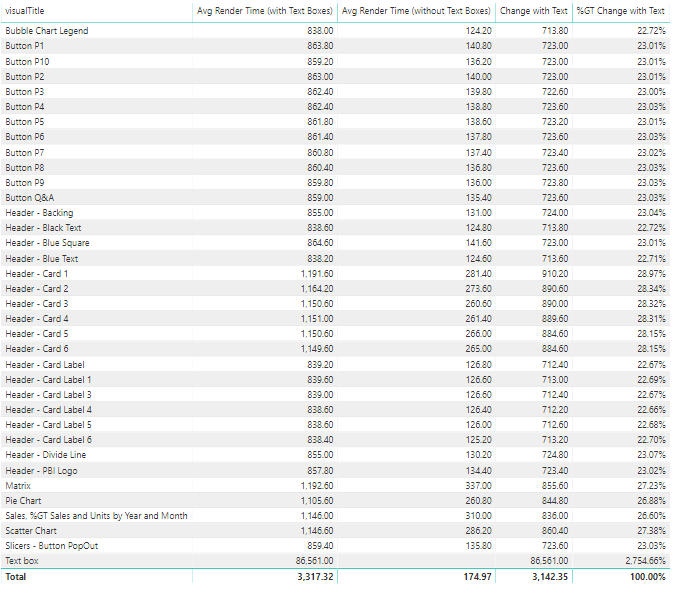
At a high level adding the 100 extra text boxes increased the load time from 174 ms up to 3,100 ms which is a approximately a staggering 1700 % increase in load time.
Here is the detailed break down for average load times compared with and without text boxes.
There are some interesting notes here. When we added the text boxes it caused all other visuals to increase load time from 22 up to 28 % percent longer per object. Clearly the text boxes took the longest to render.
After completing this test there were a couple of observations that I felt would be best practices when building future reports.
It is important to take time to clearly label your visual elements on the report canvas. Doing so makes it easy to identify each item in the performance analyzer.
Increasing the number of visuals on a page hurts rendering performance. So think carefully about how many visuals you need to add to convey the data story you are trying to tell.
When a visual is not shown it does not impact performance rendering of the page.
A trend I am seeing is individuals are creating really long pages. Meaning the page is 1280 x 3000 or even 4000 pixels long. This is a nice feature that lets the report consumer scroll through multiple visuals. However, this has an unintended consequence adding all the extra visuals is slowing the time for the report to render. Instead of increasing the page length it would be better to control which visuals are being shown by using Bookmarks and Grouping. To learn more about bookmarks & grouping visuals visit:
Limit adding style elements such as drop shadows and visual shading images as these will increase load speeds. Instead push those types of changes down to a background image that can be placed on the page. This is the technique used in creating PowerBI.Tips layouts.
If you like the content from PowerBI.Tips please follow us on all the social outlets. Stay up to date on all the latest features and free tutorials. Subscribe to our YouTube Channel. Or follow us on the social channels, Twitter and LinkedIn where we will post all the announcements for new tutorials and content.
Introducing our PowerBI.tips SWAG store. Check out all the fun PowerBI.tips clothing and products:
Over the course of time Power BI has come to encompass a wide variety of technologies and tools. One such product that has been integrated into the suite of Power BI is paginated reports. Before Power BI, paginated reports were served up in SQL Server Reporting Services. That product was the major reporting tool used by businesses using Microsoft products. Now, Power BI brings us the best in visualization, analysis and insight. Paginated reports give you pixel perfect outputs that can be easily printed, emailed, and output to Excel. It strikes me as a bit peculiar that over the years while the focus has been to push into Power BI visualizations heavily, almost every client I’ve ever worked with has always asked for outputs of Power BI reports that are best served up in a paginated way.
What is really exciting is now we have an ecosystem in which we can bring all these report types together. You can create “perfect world” reports where we can analyze and export in fashions that meet the needs of a wider audience. Today I want to talk specifically about the release of Paginated reports in external embedded scenarios in the November feature release cycle. The integration of paginated reports has been on a steady cadence of releasing new features. I want to serve up an overview of current state for embedding these report types, and where there is room for improvement. I’m also interested in the community feedback to determine if my experiences or blockers are similar or different. Be sure to comment below.
What you need
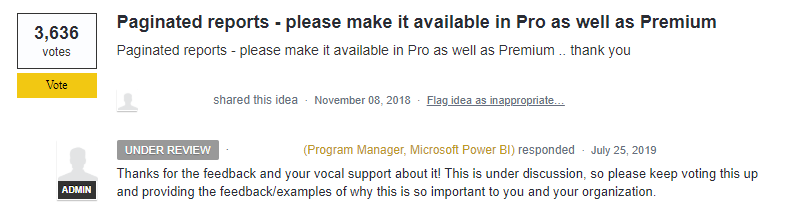
First off, in order for you to use paginated reports in Power BI, you will need to likely upgrade you license. It is a widely known request that something should be done about removing this feature from premium pricing. If you want to change that, throw your weight into the request to change that, you can do that via the community ideas section for Power BI to make this feature available to Pro users -> https://ideas.powerbi.com/forums/265200-power-bi-ideas/suggestions/35959420-paginated-reports-please-make-it-available-in-pr
Importantly, having Pro license won’t fix the cost for an embedded scenario completely, but one can hope that if it is available to Pro, then the A1 – A3 sku levels would work as well for future embedding.
Lets get back on track! You will need an A4 sku or P1 in order to use the paginated reports. A full walk-through of how you can develop this solution can be found here. The great thing about an A sku is that you can turn it on and turn it off. This means that if you want to kick the tires and showcase the capabilities before purchasing, you still have the ability to do so.
What Works
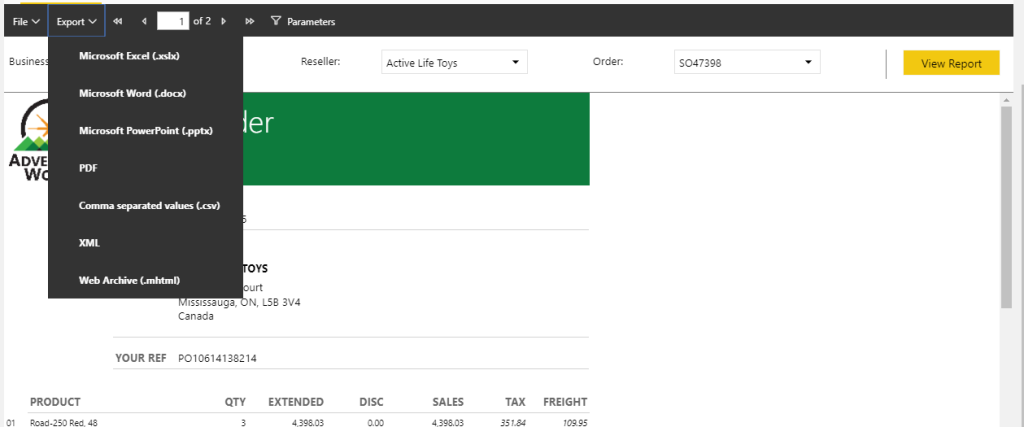
Aw yea! Look at this beauty, you see that in the embedded sample report? PDF, Excel, Word, PowerPoint! All there, and all exporting the pixel perfect greatness of paginated. I don’t have to assume how much businesses will salivate over this one, because I’ve had all these conversations. With paginated reports in our external facing applications we have the ability to merge all these report types into seamless products for our business users.
You want to test this out for yourself? You can! Check out
the playground in embedded and you can see just how these features serve up in
all your export dreams.
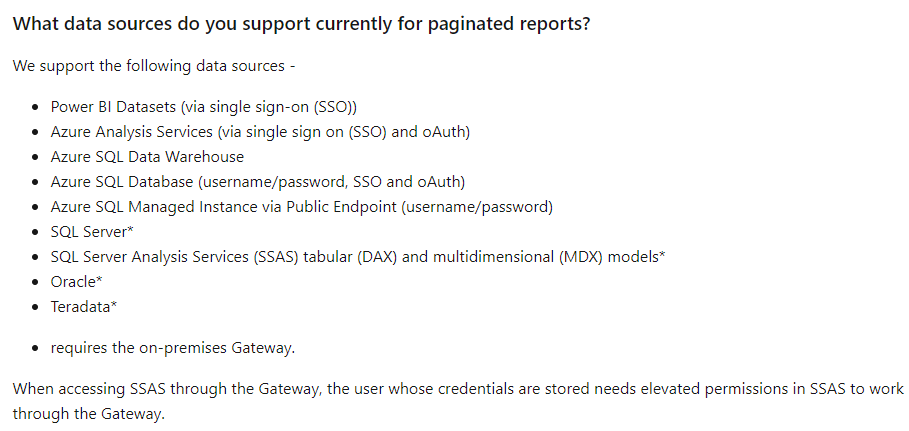
Here are the current data sources that are supported.
Not surprisingly, all the Azure sources feed us up all the data & security that we would want to use in terms of access. This will support existing data extraction methods used for paginated in other reporting tools. There is great news from a Power BI model perspective as well! If you want to integrate your Analysis and paginated reports to serve off the same model this is really easy to do now because I can connect to AAS or a Power BI Dataset.
What is Needed
There are a few things that you should be aware of that aren’t yet baked into the feature release. This is where I’m wondering how much of a blocker it may be for others as it is for me. There are likely many companies that have hundreds or thousands of paginated reports. The majority of your reports are likely served up via stored procedures with parameters in the SSRS report. These provide data context prior to execution of the procedure thereby limiting the results. This WILL work if you are using Azure SQL DB or Azure Managed instance. It WILL NOT work for on-premises SQL or a Platform as a Service (Paas) solution where you are hosting your own SQL Server in an Azure VM.
Export to Excel – Dump my data!… Personally, I don’t mind that this feature isn’t in the export options. I actually hope it doesn’t get added in the way it works in legacy tools. One challenge I’ve always had is trying to get business users out of using reports as export dumping tools. With the advent of Power BI, and all the ways we can surface up curated data sources, I want to see this type of practice stop. We need to get better at training people where and how to ingest data and make it easier for them. Rather than let them dump out loads of data and creating silo’d processes of their own.
Close
I’m really excited that paginated reports has been added as a supported report type for embedding. Paginated reports will certainly hold a place in my future deployments. Additionally, I would love full support for on-premises data and Paas solutions in order for major migrations to occur of paginated reports into Power BI. For me, I will need to consider the cost of refactoring all those stored procedures if I want to stay on-premises or make a case for moving all of reporting only to Azure SQL.
If you like the content from PowerBI.Tips, please follow us on all the social outlets to stay up to date on all the latest features and free tutorials. Subscribe to our YouTube Channel, and follow us on Twitter where we will post all the announcements for new tutorials and content. Alternatively, you can catch us on LinkedIn (Seth) LinkedIn (Mike) where we will post all the announcements for new tutorials and content.
As always, you’ll find the coolest PowerBI.tips SWAG in our store. Check out all the fun PowerBI.tips clothing and products:
For each visual in Power BI Desktop there is a button called Focus Mode. This feature highlights a single visual. While this can be helpful, it does remove the ability to change or adjust the visual based on filters or slicers. I’d like to introduce to you the concept of Scaling a visual.
In this tutorial we walk through how to take a collection of visuals. Then group all the visuals. Finally, control the group of visuals by hiding or showing them with bookmarks.
Check out this video tutorial on how to accomplish this within Power BI Desktop.
Tutorial Video
Downloads
Download the icons and sample PBIX file at my GitHub repo.
If you like the content from PowerBI.Tips please follow us on all the social outlets. Stay up to date on all the latest features and free tutorials. Subscribe to our YouTube Channel. Or follow us on the social channels, Twitter and LinkedIn where we will post all the announcements for new tutorials and content.
Introducing our PowerBI.tips SWAG store. Check out all the fun PowerBI.tips clothing and products:
We do a ton of Layouts here at powerbi.tips and with the introduction of the new visual grouping feature I was looking for different ways I could utilize that functionality to make templates for different reporting scenarios. First, if you aren’t familiar with how to build a visual group, be sure to check out a blog Mike wrote on this a little while ago on the subject.
While I was exploring an idea of how I might leverage this new feature, a challenge I’d seen re-occurring in the Power BI Community forums popped to the forefront of my mind. This new feature gives a perfect solution for answering the question of Report page consolidation.
Time and again I’ve seen people talk about navigation issues related to the number of pages or tabs they have in their reports. Sometimes, particularly in embedded scenario’s, you can’t reduce the pages and break them up into smaller reports. This could already be accomplished in the past, but man oh man, good luck finding what you were looking for in the selection pane. Let me show you how easy this is to accomplish with the addition of the new visual grouping feature. By walking through these few examples you can extend this to however many pages you need following the same patterns I describe below.
Setup:
On your main
page, make some room for buttons that you can create to toggle your pages
on/off. You can see I did that in the
image below.
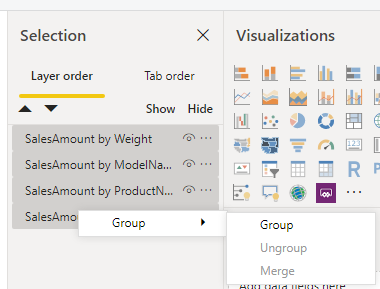
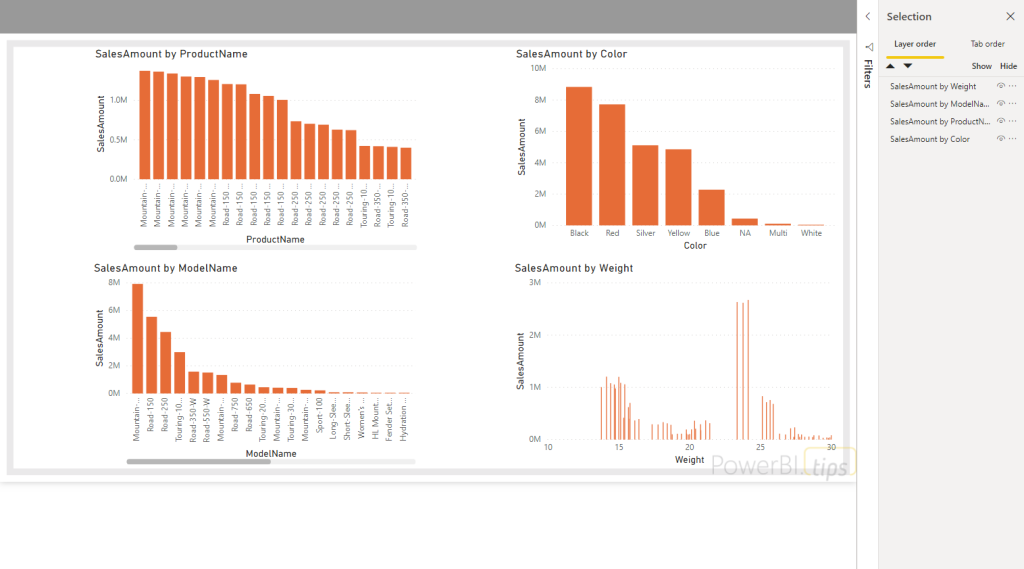
Next we’re going to click on the top object of the selection pane and hold SHIFT + Click the last object, this will highlight all the objects.
Right click and select Group from the drop down menu.
This will
create a “Group 1”
Let’s rename this to Page 1. You can do that by Double Clicking on the group name and typing in the new name, Page 1.
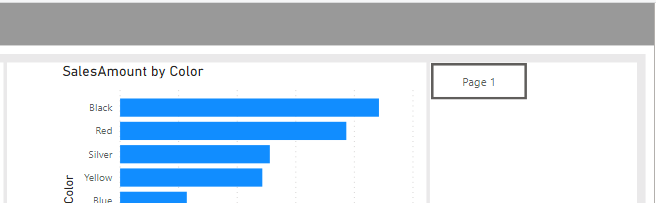
Next, we’ll
create a button called “Page 1”
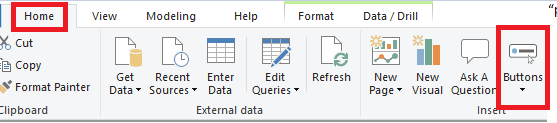
Select the Home ribbon, then click the icon called Buttons.
Choose a Blank button from the drop down. In the formatting pane under the visualization area choose the section titled Button Text and toggle it on, then type in Page 1.
Place the button in on the right side of the screen.
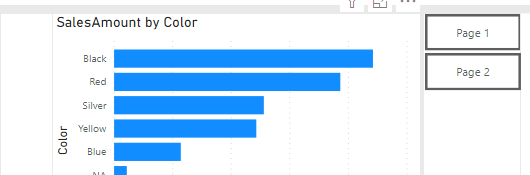
Great, now since we just created this button, let’s create a second button. This one will be for our “Page 2”. Follow the same steps above or select the Page 1 button and do a CTRL + C (copy command) / CTRL +V (paste command) to create a new button. Rename it to Page 2 and you should end up with this
Prep Additional Page
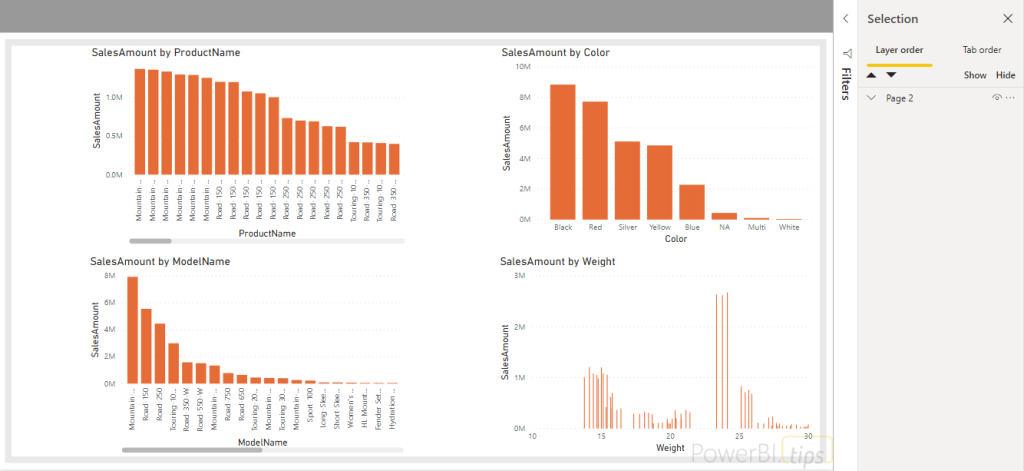
Now, here is where this gets cool. Imagine you have N number of pages, all with roughly 10 objects on each page. We are going to go to each page and condense all the objects down to a single one. Go to your second page, in the same fashion that we created our page 1 group, we select all the objects in the selection pane.
An alternative method would be to just click on your report canvas and CTRL + A to select all objects, then right click and create group. We now see our new group in the selection pane and we can double click to rename it Page 2.
Bring It Together
Now Click on the Page 2 group and hold CTRL +C to copy the group
Navigate to page 1 and CTRL + V to paste the group.
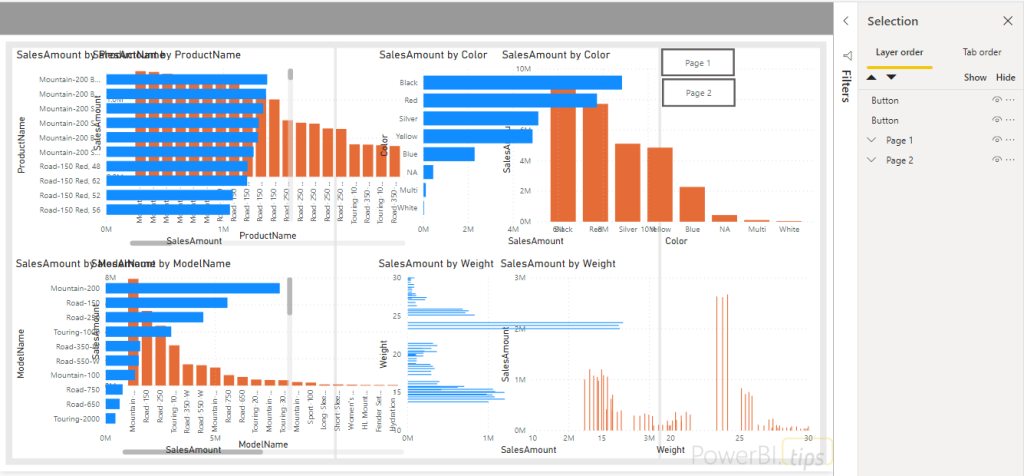
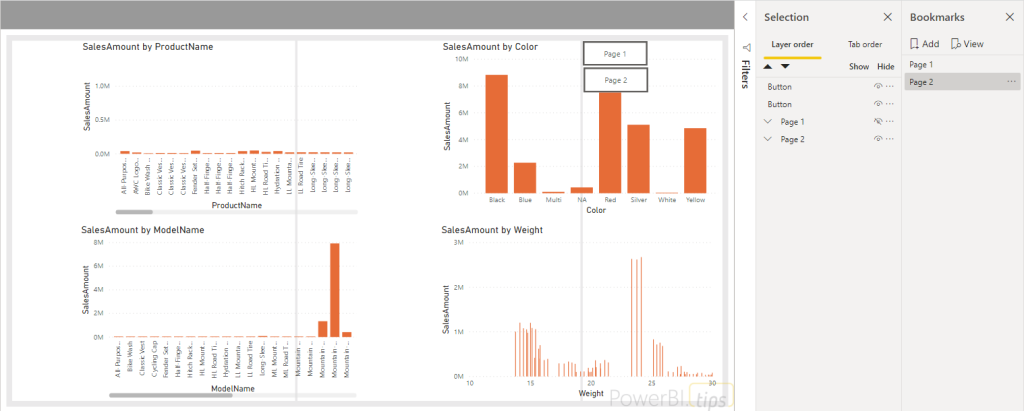
This will
bring all the objects from your Page 2, to page 1 and it will look like a giant
mess similar to this
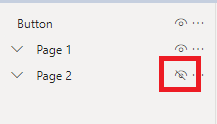
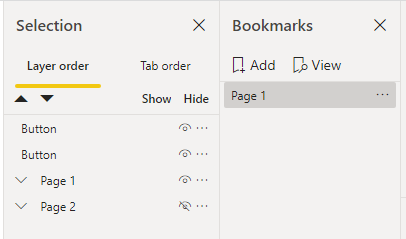
But you know what isn’t a mess? The Selection pane! Because we created the group, all we need to do is toggle the Page 2 visual icon to off
And our page
looks normal again. Now let’s hook up the buttons and bookmarks.
Go to the View ribbon and open the Bookmarks pane.
Click the Add button at the top of the window. This will create a snapshot of the current state of the report page. Double Click the bookmark that is created and change the name to Page 1.
Now, toggle the Page 1 visual group off from the Selection Window. Then turn the visibility of Page 2 visual group to on.
Create a second bookmark. Now, change the name to Page 2. You’ll likely notice that things just aren’t aligned right (at least in my case that is true because I’m using a background.
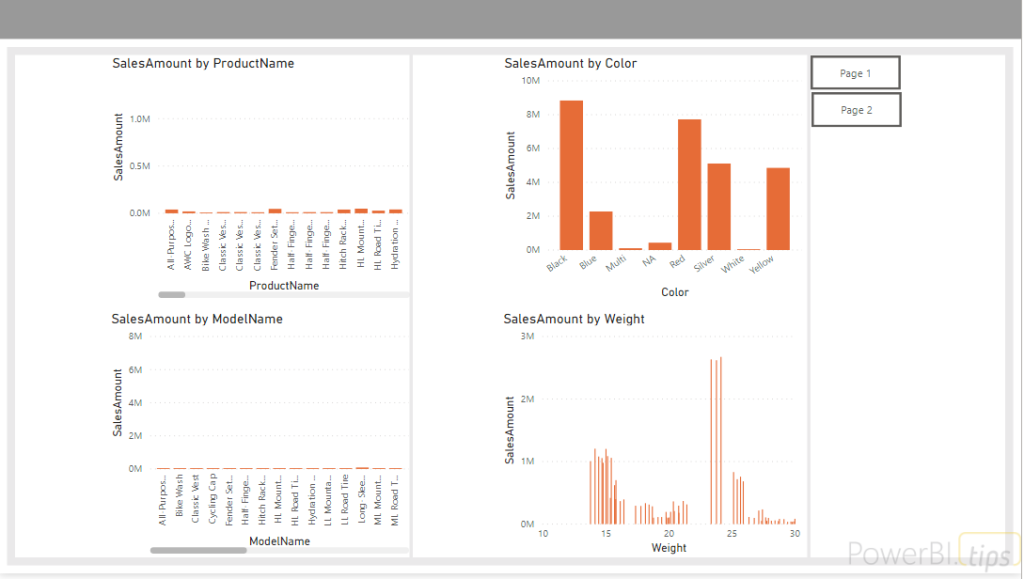
But
since the visual grouping is its own object, all I need to do is select it and
all the visuals resize for me! I don’t have to individually mess around with
each one! Super cool.
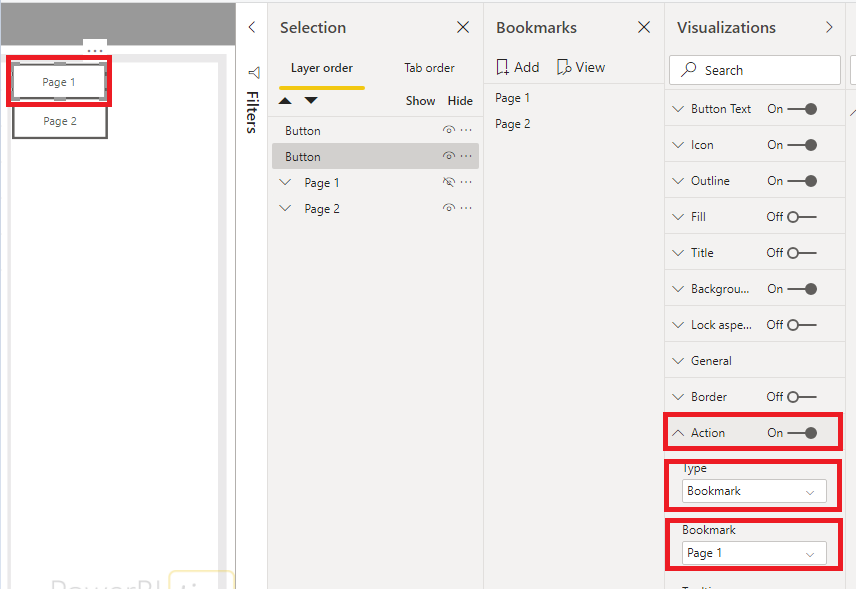
The last thing we need to do is connect our buttons with our bookmarks. We Select the Page 1 button. Choose the Action in the formatting and toggle it On.
Select the Bookmark from the Type drop down. Then Select the Page 1 bookmark we created.
Repeat the same thing for Page 2. You have just created navigation buttons to the two views of your report pages.
CTRL + Click in Power BI desktop will activate the actions on the buttons. Finally, you can see that you will toggle between the report pages on the single page. WHEW!
Closing
This was possible before visual grouping, but now it is an EXTREMELY clean and efficient way to consolidate your report pages and add a ton of objects into a single page. You do have a lot of objects on the page, but don’t worry there isn’t a performance impact because they don’t render until you click the button to make them appear. You can test this out by enabling the Performance Analyzer in the View ribbon.
Visual grouping coupled with bookmark grouping have made these features fun to use and easily manageable for all. This is just a simple use case where extending the use of visual grouping to help us manage our reports better can make a world of difference as we build. I hope you enjoyed this post and that it helps you clean up any reports you may have that got a little unwieldy.
If you like the content from PowerBI.Tips, please follow us on all the social outlets to stay up to date on all the latest features and free tutorials. Subscribe to our YouTube Channel, and follow us on Twitter where we will post all the announcements for new tutorials and content. Alternatively, you can catch us on LinkedIn (Seth) LinkedIn (Mike) where we will post all the announcements for new tutorials and content.
As always, you’ll find the coolest PowerBI.tips SWAG in our store. Check out all the fun PowerBI.tips clothing and products:
This post will walk through how to pull an estimated household income from a US address. It will be completed all in the Power Query Editor. We will convert this to a function to reuse on any address we want.
This is the second part in a series on free API calls. The first part demonstrated how to pull daily stock price from Yahoo! Finance, which is available here.
Note: The content in this blog was first presented at the Power Platform Summit North America on October 18th, 2019.
Introduction to the Data
We cannot get exact income of a US address, but the US census releases data which is aggregated at different groups of households (called Geography Hierarchies). There are different levels of Geography Hierarchies, explained on the census website. The lowest level of granularity available for this data is Block Groups. This is a small group of blocks, and usually consists of about a few hundred to over 1000 people. A block group is expressed as a code.
It is unlikely we will have the actual bock group code, but rather a street address. In order to retrieve information, we need to find which block group the address falls into. The first step is to convert the address into geographic coordinate, a process called Geocoding. You are probably familiar with using this feature – for example when you enter an address into a map app in order to get directions.
The census.gov website offer a free service to do this (US Census TIGER). However, in my experience the match rate (percentage of addresses geocoded) is not as good as some other services – this means that some of the addresses you enter will not be found. There are many other companies that offer Geocoding services, such as Bing, who often provide better match rates. However, these tend to come at a cost. These can be used instead, but for this example we will focus on the free US Census TIGER service.
Create an API Key
The first step will be to sign up for an API key from the census website. API keys allow organizations to monitor usage and can stop overloading their databases with requests. Some can be used to charge for paid API calls, however the census API is free and only requires an email address. If you do not work for an organization, you can write “none”.
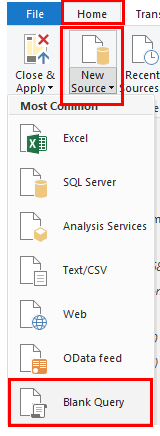
Back in Power BI, on the home tab in Power Query, click Home, New Source, Blank Query.
In the formula bar, Paste in the API key value you received. Rename the query to P_APIKEY. This will store the API key so it can be changed, but will not set it as a parameter and require it to be entered by the user every time they use the function.
Setting up Parameters
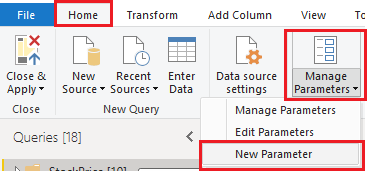
In the power query window, under the Home ribbon, Click the bottom half of the Manage Parameters button. From the drop down Select the option New Parameter.
Name the parameter P_Address. Change the Type field to Text. Enter 15010 NE 36th St in the Current Value input box.
Repeat this step 3 more times, so you will have 4 parameters in total. Use the below table for the names and default values:
Name
Default Value
P_Address
15010 NE 36th St
P_City
Redmond
P_State
WA
P_ZIP
98052
Function Part 1: Geocoding
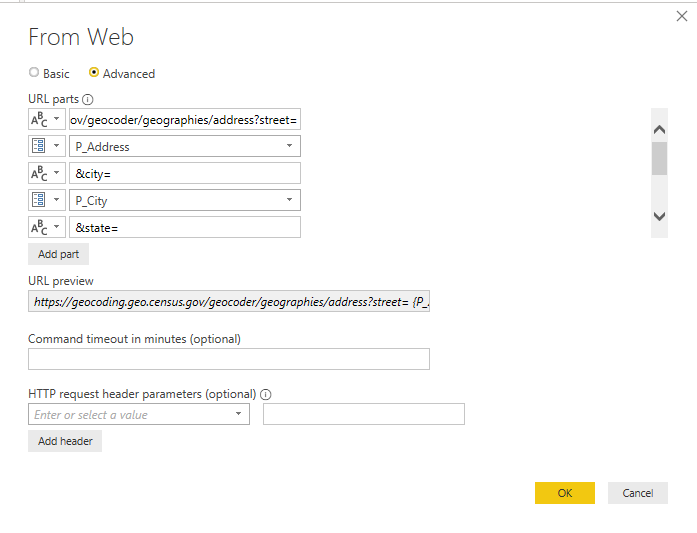
On the home tab, Click New Source > Web. Switch to the advanced tab, Then in the open dialogue box, first Click the button Add part. This will add a new box. Repeat this to add 9 web parts. Afterwards, locate the first window and Enter part 1 of the URL. In the second box, Change the abc symbol to a parameter. Fill in the boxes like below:
Note: Do not enter the rows that begin with P_ directly (rows 2,4,6,8). Switch the type to parameter and pick from the list.
This will return a result: Record. Click on the Record value to drill into it. In the convert tab, click To Table to transform to a table. We have extra information here, but we are only interested in the blockgroup data. Filter the column Name to include the following rows only: “BLKGRP” , “COUNTY”, “STATE” , “TRACT” (make sure you keep the correct columns with these exact names).
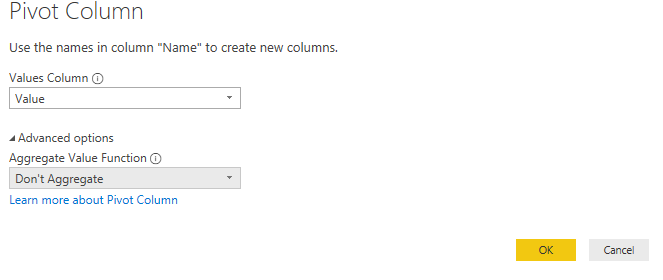
Now we have the correct columns, but for our function to waork we want them in one row. Highlight the Name column, navigate to the transform tabe and click Pivot Column. The symbol is:
Expand the Advanced Options, and change the Aggregate Value Function to Don’t Aggregate.
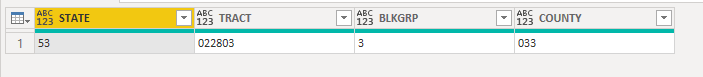
If you are following with the Microsoft head office, your data should look like this:
Now that we have the address geocoded, we can find out census information.
Function Part 2: Returning Household Income
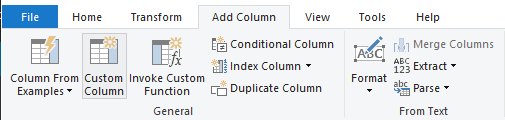
To add the second API call, we can take advantage of the custom column. It is actually possible to use Power Query (M) code in the custom column. Click Add Column then Custom Column.
The code needed for the column is below. You can copy and paste this directly into the “Custom column formula” :
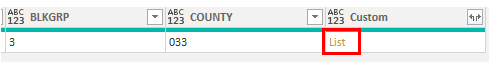
Breaking this code down: – Json.Document tells Power BI the value being returned is in JSON format, and to decode this to a list – Web.Contents will tell Power BI we are going to be sending a web (api) query – https://api.census.gov/data/2018/pdb/blockgroup?get=Tot_Population_CEN_2010,avg_Agg_HH_INC_ACS_12_16 is our base URL will some parameters. The parameters we’re giving are to return population and average household income -The second half of the URL takes in the location from the current row. anything in [Square Brackets] is a column. P_APIKEY is the parameter we set up earlier, that holds our API key
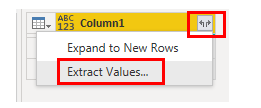
This will add a new column holding a list of lists. Click on the word list to drill into it
This will bring to the second level, two lists. Afterwards, Transform to a table by clicking on the “To Table” button in the ribbon, under list tools > Transform. After it is in table format, we expand the values to take them out the list. The data has two lists, the first is the column headers and the second is the values, so we need to transform a little to see the data in a nice format. Firstly, expand the values by clicking the expand button and select Extract Values.
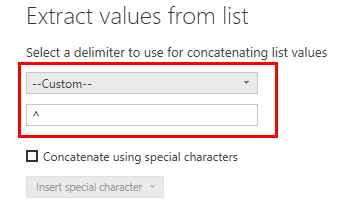
This will expand to one column, separated by a character of our choice. I’m going to use the carat symbol (^), as I’m confident this will not be a character already in the data. To do this, change the first box to –Custom– then type in the carat symbol.
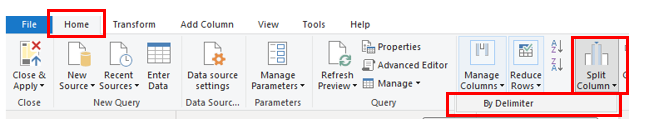
After extracting the data from the lists, we can split it into columns. We will split on the delimiter we added, the carat symbol (^). Click on Home Tab, Split Column, By Delimiter.
Same as before, change the first box to –Custom– then type in the carat symbol. Leave the default setting of “At each occurrence of the delimiter”.
Now it is split, promote the first row to headers by going to the Transform tab and use the “Use first row as headers”.
Finalizing the Function
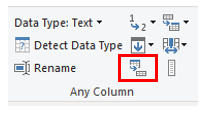
As a result, this returns lots of columns. Highlight the Tot_Population_CEN_2010 and avg_Agg_HH_INC_ACS_12_16 column, right click and select “Remove other columns”. Rename the two columns to “Population” and “Household Income” by double clicking the column header and typing the new name. Finally, highlight both columns, enter the Transform tab and click “Detect Data Type” to convert the data type.
Optional: If you want to add the original address in, Click Add Column then Custom Column. Enter the below code, which will concatenate the address to one value. You can name the column Address.
This query uses a parameter which enables us to can convert it to a function. To do this, right click on the query in the Queries pane on the left and select make function.
Now we have a function where we can input any address and return the estimated household income, as well as population of this average is taken from(n value). To check multiple addresses, you can add your function to any list. This can be found in Add Column ribbon, then Clicking the button Invoke Custom Function. This will return a table for each row. Before expanding, it is important to handle errors, otherwise it could break the query. One option is to Right Click the column header, and select the Replace Errors option, and Type the text null.
Final Function
For those who like M code, here is the final function. You can copy and paste this directly into the advanced editor (See this article on how to do this).
let
    Source = (P_Address as any, P_City as any, P_State as any, P_ZIP as text) => let

            Source = Json.Document(Web.Contents("https://geocoding.geo.census.gov/geocoder/geographies/address?street=" & P_Address & "&city=" & P_City & "&state=" & P_State & "&zip=" & P_ZIP & "&benchmark=Public_AR_Census2010&vintage=Census2010_Census2010&layers=13&format=json")),
            result = Source[result],
            addressMatches = result[addressMatches],
            addressMatches1 = addressMatches{0},
            geographies = addressMatches1[geographies],
            #"Census Blocks" = geographies[Census Blocks],
            #"Census Blocks1" = #"Census Blocks"{0},
            #"Converted to Table" = Record.ToTable(#"Census Blocks1"),
        #"Filtered Rows1" = Table.SelectRows(#"Converted to Table", each ([Name] = "BLKGRP" or [Name] = "COUNTY" or [Name] = "STATE" or [Name] = "TRACT")),
            #"Filtered Rows" = Table.SelectRows(#"Filtered Rows1", each ([Name] = "BLKGRP" or [Name] = "COUNTY" or [Name] = "STATE" or [Name] = "TRACT")),
            #"Pivoted Column" = Table.Pivot(#"Filtered Rows", List.Distinct(#"Filtered Rows"[Name]), "Name", "Value"),
        #"Added Custom" = Table.AddColumn(#"Pivoted Column", "Custom", each Json.Document(Web.Contents("https://api.census.gov/data/2018/pdb/blockgroup?get=State_name,County_name,Tot_Population_CEN_2010,avg_Agg_HH_INC_ACS_12_16&for=block%20group:" & [BLKGRP] & "&in=state:" & [STATE] & "%20county:" & [COUNTY] & "%20tract:" & [TRACT] & "&key=" & P_APIKEY))),
        Custom = #"Added Custom"{0}[Custom],
        #"Converted to Table1" = Table.FromList(Custom, Splitter.SplitByNothing(), null, null, ExtraValues.Error),
        #"Extracted Values" = Table.TransformColumns(#"Converted to Table1", {"Column1", each Text.Combine(List.Transform(_, Text.From), "^"), type text}),
        #"Split Column by Delimiter" = Table.SplitColumn(#"Extracted Values", "Column1", Splitter.SplitTextByDelimiter("^", QuoteStyle.Csv), {"Column1.1", "Column1.2", "Column1.3", "Column1.4", "Column1.5", "Column1.6", "Column1.7", "Column1.8"}),
        #"Changed Type" = Table.TransformColumnTypes(#"Split Column by Delimiter",{{"Column1.1", type text}, {"Column1.2", type text}, {"Column1.3", type text}, {"Column1.4", type text}, {"Column1.5", type text}, {"Column1.6", type text}, {"Column1.7", type text}, {"Column1.8", type text}}),
        #"Promoted Headers" = Table.PromoteHeaders(#"Changed Type", [PromoteAllScalars=true]),
        #"Changed Type1" = Table.TransformColumnTypes(#"Promoted Headers",{{"State_name", type text}, {"County_name", type text}, {"Tot_Population_CEN_2010", Int64.Type}, {"avg_Agg_HH_INC_ACS_12_16", Currency.Type}, {"state", Int64.Type}, {"county", Int64.Type}, {"tract", Int64.Type}, {"block group", Int64.Type}}),
        #"Removed Other Columns" = Table.SelectColumns(#"Changed Type1",{"Tot_Population_CEN_2010", "avg_Agg_HH_INC_ACS_12_16"}),
        #"Renamed Columns" = Table.RenameColumns(#"Removed Other Columns",{{"Tot_Population_CEN_2010", "Population"}, {"avg_Agg_HH_INC_ACS_12_16", "Houshold Income"}})
    in
        #"Renamed Columns"
in
    Source
If you like the content from PowerBI.Tips please follow us on all the social outlets to stay up to date on all the latest features and free tutorials. Subscribe to our YouTube Channel. Or follow us on the social channels, Twitter and LinkedIn where we will post all the announcements for new tutorials and content.
Introducing our PowerBI.tips SWAG store. Check out all the fun PowerBI.tips clothing and products:
For this week we are building a stacked bar chart on https://Charts.PowerBI.Tips. While you can build this type of chart within Power BI Desktop this video is more of an example showing how you can build a similar custom visual chart. There are two areas that i’d like to point out.
When working with a chart you can add a Legend to a shape object (2:40)
Adding a grand total requires an additional Glyph (3:14)
While these two tips are pretty simple it really does help you when building more complex custom visuals.
Watch the Tutorial
Download this Custom Visual
If you liked this visual and want to download it, head over to this repository to download.
Learn More About Custom Visuals
We have been working hard to help you learn how to make custom visuals. Check out our full YouTube Playlist to learn more about using Charts.PowerBI.Tips.
If you like the content from PowerBI.Tips please follow us on all the social outlets. Stay up to date on all the latest features and free tutorials. Subscribe to our YouTube Channel. Or follow us on the social channels, Twitter and LinkedIn where we will post all the announcements for new tutorials and content.
Introducing our PowerBI.tips SWAG store. Check out all the fun PowerBI.tips clothing and products:
This month at our Power BI User group in Milwaukee Seth and myself walk through some of the basics of Power BI. We digest how can we leverage Power BI to Act like the business, and Think like I.T. Discuss the concept of global and local measures within a data model. As well as some tips and tricks while working in the power query editor. Check out our presentation that we recorded for this month.
YouTube Video
If you like the content from PowerBI.Tips please follow us on all the social outlets. Stay up to date on all the latest features and free tutorials. Subscribe to our YouTube Channel. Or follow us on the social channels, Twitter and LinkedIn where we will post all the announcements for new tutorials and content.
Introducing our PowerBI.tips SWAG store. Check out all the fun PowerBI.tips clothing and products:
Power BI requires a gateway for refreshing on premises data sources. There are a myriad of different data sources that you can create and two different ways you can set up the gateway. The first way you can install a gateway is in the “personal mode”. The second method for installation uses the “On-premises data gateway (recommended)” (OPDG), this used to be called the “Enterprise Gateway”. The second gateway method is what you need to set up and configure appropriately in order to manage permissions. The recommended gateway to use when deploying reports to a wider audience is the OPDG.
Over the course of time enhancements to the gateway have increased the usability and functionality. Such as, being able to connect to cloud and on premises data in the same report, allowing custom connectors and the ability to create and distribute workloads across multiple gateways that you have clustered together. You can toggle all these settings in the gateway in the Power BI Service.
By setting up a gateway cluster you ensure that your
reports are going to refresh even if there is some maintenance activity or if a
server goes offline unexpectedly. This article will explain how we can
configure this set up and outline a few gotcha’s related to managing this setup
that aren’t so intuitive.
Setup
For DR (Disaster Recovery)
The
name of the game here is to choose servers that are not near each other. While
this may not be ideal from a refresh performance perspective this will provide
a better recovery choice if something catastrophic happens to the server.
For Load Balancing
The goal in this gateway setup would be to choose several servers nearest the data sources and choose different servers to distribute the refresh load for improved performance.
In an a perfect world we could combine DR with load balancing. At this point in time you can either distribute the load across all gateways or choose not to distribute load and it will default to DR. There is no combination of both methods.
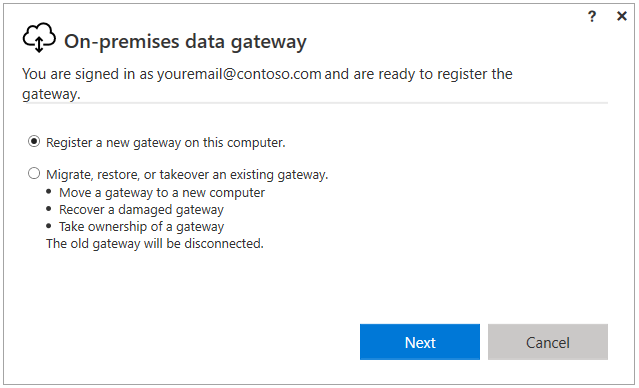
What I’ve found with installing the gateway is that if it isn’t easy, its hard. When it is hard, you will likely need to do a bunch of troubleshooting to resolve the issues. A great helper guide for troubleshooting a bunch of common and not so common things can be found here – https://docs.microsoft.com/en-us/power-bi/service-gateway-onprem-tshoot . Install the gateway on the initial server once you get past the initial couple screens you will hit this one
You want to register a new one gateway and be sure to Set and SAVE your recovery key. The key is the most important part of how you both recover, and create a cluster.
(Note: You can always add a new gateway to an existing gateway, this doesn’t have to be a net new process)
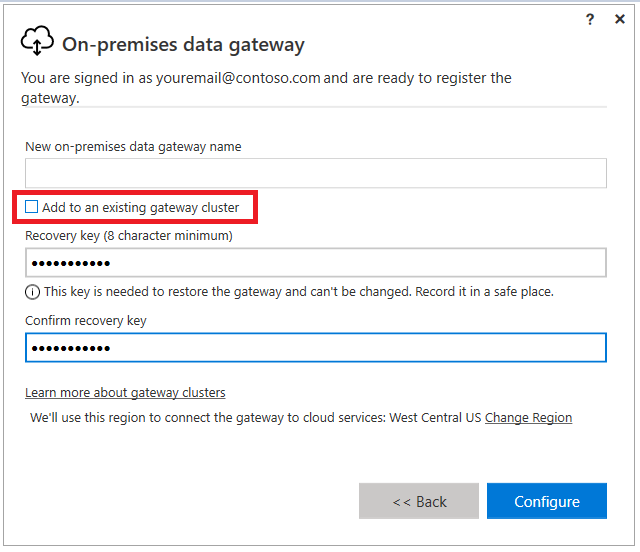
Adding the Clustered Gateway
After you have the first gateway installed, login to the second server, where you will follow the exact same process. Except this time when you hit the next screen you will want to toggle the “Add to an existing gateway cluster” and enter in the same recovery key.
By adding the recovery key and checking the box you have declared to Power BI that this gateway should be linked to the other gateway and thus create a cluster. Like the first gateway, it now shows up in the Service and we can set up the data sources to match our other gateway. At this point we can configure the settings of the gateway to distribute or by default it will just be for DR.
Be aware that it does require appropriate permissions to see and manage the gateways, so check more out in the documentation here – https://docs.microsoft.com/en-us/power-platform/admin/onpremises-data-gateway-management Since gateways can be used for other products, this is where you can see what is installed and where and figure out who has access.
I’m hoping that now that we have an admin center that in the future we’ll be able to manage upgrading, clusters and all “admin” related activities from this interface. As of this writing, we are still relegated to using APIs and cmdlets to manage these objects. Just recently, the Power BI team did release a whole slew of PowerShell cmdlets to help out administrators manage gateways, be sure to check out the preview release notes here. https://powerbi.microsoft.com/en-us/blog/on-premises-data-gateway-management-via-powershell-public-preview/
Removal
If you are like me, when I installed a gateway and then needed to remove it, you receive all kinds of errors after the fact in the Service related to those defunct gateway. Truth be told, you will need to manually remove the gateway from the cluster. You can do this by utilizing a PowerShell script. This does not mean uninstall the gateway, this means you need to run a PowerShell script Remove-OnPremisesDataGateway to detach the gateway from the Power BI Service. If you don’t, it will still remain there. I just recently uncovered this while upgrading a gateway and was still getting error messages saying that previous gateways that I had previously deleted after testing out clustered gateway were out of date… which of course they were, they were gone! But alas, to remove these errors you need to follow the instructions here to fully remove the gateway. https://docs.microsoft.com/en-us/data-integration/gateway/service-gateway-powershell-support
Summary
All in all, it is fantastic that we have the ability to provide more stability to our data refreshes, there is a ton more information that can be provided and outlined for data gateways. I hope this post gave you some good tips/tricks around gateway clustering and how to clean up after yourself when deploying clustered gateways.
If you like the content from PowerBI.Tips, please follow us on all the social outlets to stay up to date on all the latest features and free tutorials. Subscribe to our YouTube Channel, and follow us on Twitter where we will post all the announcements for new tutorials and content. Alternatively, you can catch us on LinkedIn (Seth) LinkedIn (Mike) where we will post all the announcements for new tutorials and content.
As always, you’ll find the coolest PowerBI.tips SWAG in our store. Check out all the fun PowerBI.tips clothing and products:
Manage Consent
To provide the best experiences, we use technologies like cookies to store and/or access device information. Consenting to these technologies will allow us to process data such as browsing behavior or unique IDs on this site. Not consenting or withdrawing consent, may adversely affect certain features and functions.
Functional
Always active
The technical storage or access is strictly necessary for the legitimate purpose of enabling the use of a specific service explicitly requested by the subscriber or user, or for the sole purpose of carrying out the transmission of a communication over an electronic communications network.
Preferences
The technical storage or access is necessary for the legitimate purpose of storing preferences that are not requested by the subscriber or user.
Statistics
The technical storage or access that is used exclusively for statistical purposes.The technical storage or access that is used exclusively for anonymous statistical purposes. Without a subpoena, voluntary compliance on the part of your Internet Service Provider, or additional records from a third party, information stored or retrieved for this purpose alone cannot usually be used to identify you.
Marketing
The technical storage or access is required to create user profiles to send advertising, or to track the user on a website or across several websites for similar marketing purposes.