Enhancing PBI Reports: Marketing Insights Integration - Ep. 519 - Power BI tips
In Episode 519 of Explicit Measures, Mike Carlo and Tommy Puglia unpack the latest Power BI and Microsoft Fabric topics from the show. You’ll get a quick read on the episode’s biggest ideas, why they matter, and where to dig deeper in the full conversation.
News & Announcements
- No linked announcements were available in the episode description for this post.
Main Discussion
This episode covers the major themes, opinions, and practical lessons Mike and Tommy surfaced during the conversation. The transcript below captures the full verbatim discussion if you want the exact phrasing and context.
- Mike and Tommy react to the episode’s biggest Power BI and Fabric developments and explain what stood out to them.
- They connect product announcements to day-to-day practitioner decisions instead of treating the news as abstract roadmap chatter.
- The conversation highlights where teams can move quickly, where they should slow down, and what tradeoffs deserve attention.
- They share candid perspective from real project work, which gives the discussion more practical value than a headline recap alone.
- The episode mixes tactical advice, opinionated takes, and a few forward-looking predictions about what listeners should watch next.
Looking Forward
If this episode’s topics affect your current Power BI or Fabric plans, use the transcript and linked resources to identify one concrete change you can test with your team this week.
Episode Transcript
0:23 Hello everyone and welcome back to the Explicit Measures podcast with Tommy and Mike. Hello everyone and welcome back to the show. Good morning Mike. How are you doing? I think we are finally in our sixth season in the Midwest. Our sixth season. Yes, it’s been we we’ve been getting some crazy rainy storms and stuff up here but it’s been okay. I’m happy with the warmer weather. It’s finally there. I’m I’m I’ll take it., I’m not So for those who who do not know if you don’t live in the Chicago Wisconsin area, there are actually six seasons here. It is spring,
0:53 actually six seasons here. It is spring, summer, winter, fall or spring, summer, fall, winter, spring of deception, second winter. And then we start again. So Oh, is it supposed to get cold again today? I don’t even know Tommy. I’m in my Well, no, we already had that happen. Remember we were going through a couple of these already. It was 65 and like oh wow, it’s over I guess. [laughter] So That’s true. That’s true. Awesome. Awesome. Well, today’s main topic will be enhancing Power BI reports with marketing insights integration. Just talking through like how this is
1:23 talking through like how this is going to work out with I guess like I’m I’m marketing and insights information side of things which is going to be kind side of things which is going to be interesting here as well. of interesting here as well. I’ve been building a lot of solutions around marketing things just because we do a lot with the podcast. I got to know what what content gives us traction or not. So I’m very familiar with this space right now. But before we get into that, let’s talk about some news. news. Tommy, you had a news item here around something releasing in Fab Con Fab Con and this is a real around talking about
1:54 and this is a real around talking about Git integration or your reasoning behind some of this Tommy. Yes, I think it’s time to have a heart-to-heart Mike. Not just you and I but everyone here listening. The entire community. The entire community. I think we’re at a point now and we finally crossed that point where there is no excuse not to use Git as the default option if you’re doing any Power BI development. Not if you’re a big team, not if you’re an enterprise development, type of workload. No, if it’s even just
2:26 type of workload. No, if it’s even just you individual I I don’t see any reason right now not to start with and rely on Git. Git. And what was I’m going to ask you Tommy, what is the tipping point for you? What what what made you really you and I were very pro Git integration anyways, but 100% we were saying for a team, collaborative work, like that’s what we were doing. What’s now the tipping point for you? Why are you now saying Git on everything? stability
2:56 everything? stability, it’s actually actually consistent now. It doesn’t break. But really it’s that’s a huge part of that but honestly it’s also from what happened at the conference. Yeah. So some of the big things I’m just pulling up some of the major updates here. Sure. Is we had really branch workspaces. So really branches which are a really important part of team workflows with Git. Mhm. Again, never seemed like they jived or made sense with workspaces. You can
3:28 made sense with workspaces. You can branch out but it was a weird experience. The fact now that I can create a branch of a workspace but that Git repo doesn’t have to take everything. It can just take part of it and then push back that part is so huge. That’s the that branch workspaces and that selective branching is so is so important. Outside of that, it’s stable. Git the GitHub one too. Outside of So those two things to me and you’ve seen constant updates and
3:59 me and you’ve seen constant updates and you have the command line dude. There’s so many ways to make sure that you are documenting what’s going on in a Power BI report. And this is coming from someone who back in the day tried to make Visual Studio not Visual Studio Code, Visual Studio work with Power BI reports. reports. that’s [snorts] rough. Okay. That’s rough. There’s like three major announcements. The other one that’s also out now which I think I’m absolutely love and I don’t think you should actually have any Git without this is there’s now a
4:29 without this is there’s now a the new Git experience for code comparison. So it’s compare code changes with Git integration. You can see the old file, you can see the new file, you can compare side to side like yes. Yes, yes, yes. Like this this makes a lot of sense. So Tommy, I would agree with you. I’m going to give you maybe another perspective on this one. I agree with the with this summary here. I think this is the right way to go. But I I want to add to this. I think the other reason why I’m very pro we need to
4:59 other reason why I’m very pro we need to have Git on everything is because of this new agentic world that we’re stepping into. Oh, I think that’s the other part, yeah., so Good point. On one hand, it’s like there’s been three new features that make it actually easier to work with. Yeah, out of the UI right inside powerbi. com. I think it’s easy enough for people to understand look, there’s a workspace, it’s on main branch. I want to make some changes. changes. I cut a different branch, dev one, dev two, whatever those things are. Work on those changes and then
5:29 those changes and then pull those changes back in to the main branch. Make sense. Like this I think this is not so complex that teams can’t get their head around this. It it it makes sense I think in my mind. 1000%. 1000%. When I start doing things with agents, agentics stuff, I find that there’s a a lot of it gets a lot of the stuff done very quickly for me but always sometimes there’s a little bit of like adjustment I need to make. It’s not quite exactly what I want. And let me give you an example here. I’m working on another side project.
5:59 I’m working on another side project. I like actually use Figma a lot. I don’t know Tommy how much you Yes, I know you do. But Figma also has an MCP server with it. Mhm. So Figma I can just literally talk to the co-pilot in GitHub co-pilot and say, “Hey, connect to my Fabric MCP server and I want you to make this this and this.” And it and it just builds things out for me. Boom boom boom done. done. Absolutely love it. So it’s doing a really good job of getting ideas and content together in a very easy to use
6:29 content together in a very easy to use way that I really like. So that being said said sometimes it goes off the rails and sometimes it gives me what I want but the formatting’s off a little bit and especially when you’re doing graphical things is it can see what graphically what graphical things are happening but it can’t really either. It doesn’t have to take screenshots of stuff that I’m aware of in this in this arena. And so sometimes it looks at stuff and it makes things that are just awkward. And so I go ahead and I either talk to it and ask it to adjust things or I go fix it myself. Also, I will ask it to fix something and
6:59 Also, I will ask it to fix something and it fixes the wrong thing or it thinks it fixed it and it didn’t really fix it. So sometimes my AI bot will gaslight me and tell me it’s it was built and it was corrected and I’m like I don’t I don’t You’re like this is wrong and you’re like you’re absolutely right. Yeah. I don’t like that every response. No thanks. No thanks. So in lieu of this, there are times when I want to go back in in time, right? So Git and Git integration is really a much better way of being able to build something, watch the agent do it and then if the agent really screwed something up, you
7:29 agent really screwed something up, you always have the ability to go back and fix what you were originally doing. So I think that’s really important for me too. With the agentic space Tommy every other day other day someone is posting some new tool, some new pattern. Look at me, I’m building reports with now an agent. Like everyone’s excited about this thing. There’s a lot of excitement around agentic building of stuff which is great. I’m super excited for it. I’m all for it. The downside is how are you tracking your changes and protecting yourself when it goes screwy?
8:00 protecting yourself when it goes screwy? And I think that’s the other part too. We we’ve been focusing so much on the building but this other side of this agentic part I I mentioned this before Mike but to me I I another eye-opening thing is I’ve really changed my entire workflow when it comes with clients and just project management. So every meeting that I have gets transcribed into Notion. Notion connects to a project and I have these custom agents in Notion where I basically have four different meetings for it to give a
8:32 four different meetings for it to give a different summary. Like for example, I had a call with someone they’re like we actually need different metrics. Well, everything’s tied together. So I was like, “Hey, based on this meeting, do we need to change our our our scope?” And they said, “Yes, we actually need to create,, these four measures. I think we need these two tables or we need to transform those two tables because Claude always writes back when it does anything on the MCP server back to Notion. Back to that project. So you say, “Here’s the same semantic model plan.” I said,
9:02 same semantic model plan.” I said, “Okay, “Okay, go ahead and add the instructions for Claude. Claude. And I’m again I’m in Notion here on what we need to do. I go to Claude. I say, “Take a look at our normal semantic model plan for this project.” And it’s done. And everything’s being documented but everything’s flowing together where again again Of course someone can do this but that’s a lot of pen and paper. That’s, that’s a lot of okay, what did we talk about? Are we going to do that? Everything’s getting logged in a way that that it is more so much more than just about
9:33 it is more so much more than just about building apps right now. That’s the agentic side is especially in GitHub man. Especially if you’re working in a repo, the fact that you can go let’s go through some documentation. What have we changed? changed? You can tell co-pilot Yeah. “Hey, what changes did we make? What are the last few commits updates and what do I need to be aware of?” Yep. Totally agree there. I’m aware of that. let me again, this is all not new for us, I think a little bit in some degree, Tommy here and and I think you’re you’re right on
10:03 and I think you’re you’re right on point, Tommy, with like how we are going to display or portray information here on things. We’re going to move away from this whole world of like, okay, I’m going to click all the buttons on things. I think I think where I’m looking at it, I’m going There was this I feel like Microsoft had this stance of we’re going to have AI go look at your data and tell you what’s important. And I think there’s a shift happening where Microsoft is realizing, look,
10:33 where Microsoft is realizing, look, that’s not what people really want. People actually want agents that do building type things. But,, how do I how do I create How do you leverage the creator experience about things? And I think there’s a big a big win around
10:47 I think there’s a big a big win around this around moving more towards the creator side, right? So, a lot of where the agents are making a lot of power right now, I feel, are writing code, making apps, creator side, right? But these things the apps and things don’t run on agents. Maybe they use them and integrate with them. They’re always being built in like standard infrastructure, standard applications, stuff that just exists that doesn’t need the agent to run all the time cuz it’s not as expensive to run it without the agent, right? As soon as you start adding agents in, it gets more expensive to do things. And
11:17 it gets more expensive to do things. And you only want to apply agents when you need high reasoning tasks. Yes. Yes. Things things that you give it some instructions and you want it to reason about the information and then bring back a result. Most everything else can be solved with just write a script, do some things, right? But I I want the agent to write these scripts and build the stuff so I can just use it. And I think that’s where we’re at right now. There’s a lot of interesting projects, Tommy, we’re going to unpack some of these new projects. Kurt Buller and another gentleman, Maxim, I think is his name, have come out with a Power BI Report CLI tool. So, PBI one? PBI
11:50 Report CLI tool. So, PBI one? PBI CLI. Yeah. Which is really interesting. They’re now building reports with a CLI tool and giving it instructions to it and helping it refine the experience. Also very very very cool there. So, anyways, we’re in a really interesting new world here with Git. I agree with you, Tommy. Git has to happen. Yeah. For the other news item, I want to pull out an article here, Tommy, that was just recently posted by Miguel from the Microsoft, I guess it would be the data engineering data integration team., but this this article is talking about data flows, thank you for
12:21 talking about data flows, thank you for eight years of Gen 1 and why Gen 2 is the future. I wanted to have your reactions. Did you see this article come out, Tommy? Yes, I mentioned it to you and you’re like, I don’t know about that. And then sure enough, the date was sometime later. Like like just just right after you told me about this one. So, I got a message on YouTube as well telling us Gen 1 is dying. It’s going away. I’m like, I’m not sure about that. I don’t I don’t think it’s There’s been no announced deprecation date. All they’re saying in this note is, I
12:52 All they’re saying in this note is, I think, and if I if I read this correctly, they’re they’re saying the future future of development for anything data flows is going to be Gen 2, period. I think that’s what they’re saying. And I made a note here about this one earlier when I was talking to someone on YouTube about this, one of our comments was like, yeah, I look at where my You want to see what Microsoft’s building? Mhm. Look at what new features are coming out by product. Just look at it. There’s a whole bunch of new features for Git integration. Great. That’s a part of the product they’re going to continue to mature, right?
13:23 continue to mature, right? There’s a whole bunch of new things around agents showing up and skills and other things. That’s a part of the product Microsoft’s going to continue to mature. mature. When was the last feature you saw come out around the Gen 1?, I could have told you this months ago. Oh, yeah. Oh, yeah. We’ve talked about this for months. Like, no new features are coming to Gen 1. 1. Here’s the rub, though. I saw a post on LinkedIn LinkedIn and someone was really ribbing Microsoft and saying, oh, you’re so evil, you and saying, oh, you’re so evil,, all the Power BI tools are now know, all the Power BI tools are now going to have to be moved and forced into Fabric and Fabric is so expensive
13:53 into Fabric and Fabric is so expensive and all that all these things. And I said, said, I didn’t really quite understand the argument. They were just really complaining about the the deprecation of data flows Gen 1. And I said, what is the real argument here? I don’t really understand the positioning. Why are you ragging so hard on Gen 1 and why are you so resistant to go to data flows Gen 2? And my point was, Gen 1, Gen 2, there is a little bit of a price
14:23 there is a little bit of a price difference between them in the fact that you have to move away from regular Power BI workloads, like a pro user, and move into a Fabric pricing model. With a Fabric pricing model is, now we have an F2 that starts at a very low price. price. So, my argument here was, okay, if this thing’s adding so much value to your company, right? And Microsoft’s saying, look, we’re going to move away from the data flows Gen 1 world, we’re going to move into this new data flows Gen 2.
14:55 into this new data flows Gen 2. And he was saying all the other kinds of things on the on the post. It was like, well, we don’t want a lakehouse. We don’t want this storage stuff. We don’t want bronze, silver, gold. We just want just low data. And And I thought to myself, myself, you’re complaining about a culture problem in your company, is what I was thinking about, right? If you are complaining about lakehouses and medallion architecture and not using data engineering and not all these tools at your disposal, and you’re complaining about not getting data flows Gen 1, I’m a little bit cautious here. I I I
15:25 I’m a little bit cautious here. I I I think you’re missing the picture of what Microsoft’s doing and where we’re going and how to build efficient processes. So, let me get your reaction, Tommy. Let me Let me just pause here. I have a lot of other thoughts. What’s your thought to data flows Gen 1? Eight years of successful Gen 1 and now we’re moving Gen 2 to the future. What’s going I can tell you exactly why the person is so angry and why they’re they’re spinning everything. Clearly, Mike, they were preparing a demo that’s going to be next week on data flows [laughter] Gen 1.
15:55 1. Maybe I’ll I’m so burnt. I’m so burnt, so. And they’re going to deprecate it right before I get there. it right away, Curtis, you still. And you have to pivot very quickly, Pivot. Pivot. Pivot. Pivot., no, I I think listen, I one of my first loves in Power BI really was data flows Gen 1. I immediately saw the use case and was excited for it. But that being said, data flows Gen 2, you can use in the same way. It’s not like you’re losing features with data flows Gen 1. Or Gen
16:26 features with data flows Gen 1. Or Gen 2, excuse me. If you want to use it in the same way where it holds all your master tables and reference tables and you’re still just connecting to Power BI, there’s nothing stopping you. There’s no feature in Gen 2 that does not allow you to do that. In fact, you could use it the exact same way where you’re not actually loading data to a source, source, which is the real outside of the the new engine, outside of how things query in data flows Gen 2, the big
16:56 query in data flows Gen 2, the big feature of it is the fact that you can push data to a lakehouse, to a SQL database, etc. But if you don’t do that, you can still connect to it directly in Power BI the same way. And And yeah, the cost is obviously the thing, but but I don’t want to I’m I’m worried about saying this a bit, but but some of us are and maybe we are, too, Mike, just a bit spoiled from our first eight years of Power BI because Microsoft was so needing people to adopt
17:28 Microsoft was so needing people to adopt it that most things were for free., desktop, desktop,, when premium came out, how long was the trial? Fabric trial is still going on. So, a lot of stuff we had for free or could utilize. Yeah, it’s a little more cost, but I think the biggest thing I’m really feeling, Mike, is you don’t have to use Gen 2 in the way that we’re saying where it’s like, no, you have to push it to a SQL database. You have to use it like it was a notebook. It’s cool that you can and it’s recommended because it’s a much better
17:59 recommended because it’s a much better way in Power BI, but you don’t have to. So, that’s kind but you don’t have to. So, that’s my initial thoughts. Yeah, and and let me go a little further here, Tommy, as well. The article that I shared here, if you want to read up on it, Gen 1 versus Gen 2, the first article I’m sharing here is the one that’s actually the original announcement from Miguel., if you read the comments, they’re pretty tame, but a lot of them are around, hey, you’re leaving original Power BI users in the dust. There’s there’s no path for us to migrate. What
18:29 there’s no path for us to migrate. What happens if our IT group doesn’t allow us to use Fabric and turn things on and you we’ve been using this in in Power BI, we need this. We need it in Power BI. And I to some degree, I would Again, I’m not going to argue with these things. getting rid of it this month. Correct. We’ve got time. We’ve got time. But it it also feels like so so, I think Mike can Mike can Mike There’s some really good points in here that I want to highlight. One gentleman says, says,, I think Lucas was talking about it’s a huge bummer that we can’t turn on Fabric and limit which workloads people
19:01 Fabric and limit which workloads people actually put on really agree with on the items. So, let’s just,, for example, hey, let’s turn on Fabric and let’s only allow this group of people to use Fabric with this data flow Gen 2. Gen 2. Makes total or data flow Gen 2 and lakehouse. I saw another argument that said, look, we really need to know like when you go to data flows Gen 2, it kind when you go to data flows Gen 2, it lets you write data anywhere you of lets you write data anywhere you want. And that,, nice. It It does a good job of that. But on the other hand, they were like, well, look, we’re in the financial sector sector and we need to know where data is being
19:31 and we need to know where data is being written to and we need to limit the sources on where data flow Gen 2 can write its data to at the admin level. Also really fair point. So, there’s a lot of I think really strong strong use cases here of what’s going on. And I think to some degree, because data flows Gen 1 was so initial version limited, right? You use data flows Gen 1, it only let you store data directly into powerbi. com. It took care of the storage, it took care of all the things for you, even though it wasn’t really doing like the medallion or lakehouse
20:01 doing like the medallion or lakehouse architecture, which again, I think has in its own right Even Microsoft had documentation for Gen 1 on doing the medallion architecture with Gen 1. Right, but practice. [laughter and clears throat], , but I the spirited conversation is happening over on Reddit. And this is the second like I just put over there. So, if you want to see if you want to see the spirited conversation around people getting really passionate about this one, yeah, someone, it’s been interesting to see what’s going on. But again,
20:32 going on. But again, I’m going to go back to this this argument. Like I agree with this sentiment. I’m I’m also with you. I understand your sentiment around the frustration of things that you were using now no longer being supported. What I’d like to see from this is the pushback in the community around this Dataflows Gen 1 announcement, and just see what Microsoft’s stance will be. This will be interesting to watch, Tommy, I think. Because if this makes enough of a noise in the market, we may get something that’s like a Dataflows Gen 2 light
21:03 a Dataflows Gen 2 light that would be just Power BI. And I think But isn’t that I don’t know, man, because you already knew that they were aware of this too when when the way they wrote the blog. Again, re- read between the tea leaves. The fact that they’re like “We have been talking about retiring Dataflows and not deprecating it.” They didn’t use any hard words. We would say “It’s I think it’s time for, it’s going to go on vacation a little later, much later. We don’t know when, but we’re thinking about it.” And But I think they’re giving people ample time to like shift what you’re doing.
21:33 time to like shift what you’re doing. Like you need to start adjusting the direction of where you build things now. Like if if you’re going to continue to build a lot more things in Dataflows Gen 1, you need to be considered of getting out of it and not building net new things there because it’s going away. You can’t buy a premium capacity anymore. anymore. Okay, so that’s I we know which direction we’re going. Correct. Yes., we’ll we’ll see where this is going to land. I think there’s a lot more information that needs to tease out here. I think a lot of more people need to understand like the impact of this.
22:03 this. and I also I think also one point here I just want to note it’s really important that Microsoft gets feedback about this change in features because you the user of this need to let people know. I really think the main argument here is how how do you get to use Dataflows Gen 2 in lieu of licensing? I think that’s the main argument. argument. I think the reason most people are complaining are like, “Look, we used Dataflows Gen 1, it did enough of what we wanted to do at the Gen 1 level.
22:33 we wanted to do at the Gen 1 level. We are getting paid $14 a month per user to use it. Great. They were happy, right? It works in premium per user. You get a little bit more limits up there, right? And now you come into this world and now everything’s being upheaved and changed and you’re like, well, now I got to go get this new the Fabric SKU. Fabric costs an F2 at a low level, but I can’t really do a lot there.” there.” One of my thoughts here is if this Dataflows Gen 1 stuff is adding so much value for you, why wouldn’t you invest in it? Why wouldn’t you make it more of a robust process? Why wouldn’t we go a
23:03 a robust process? Why wouldn’t we go a bit more of this route of making it easy for people to use this in Fabric? I know people are going to fight me on this one. I know people are going to be heated about this conversation as well, but if the value if you’re yelling about the value is so good, invest in it. Educate your team a bit more. Maybe some people don’t know the secret to actually make Dataflows Gen 2 work just like Dataflows Gen 1 if you’re using it directly in Power BI. It’s actually a three-step process. Step one, open your Dataflows Gen 1.
23:33 Step one, open your Dataflows Gen 1. Or four steps, I guess. Step two, copy your queries. Step two, create a new Dataflows Gen 2. Step four, control V. And you have your queries. And it works. have to do anything. You do not have to push to a database. And I I get what we’re saying when it comes to the administration, but join the club. We everyone feels that with every product in Fabric right now where we wish we can eliminate it., but the way it like,, I wish only some people could see lakehouses or notebooks. But I don’t know. I I hear people, but I’m like, it’s not like I
24:04 people, but I’m like, it’s not like I lost any features. And tell me if I’m wrong, Mike. Nothing in Gen 2 is or there’s nothing that they did in Gen 2 that’s not available that’s only in Gen 1, correct? Gen 2 has all the features Gen, Gen 1 has. has. I I would I would agree I think we’re full to your point I think we’re at full feature parity. Yeah. I think that’s what you’re asking. And in addition to that, there’s a lot of extra features that are like performance tuners and you
24:34 that are like performance tuners and you that are like performance tuners and, we’re not writing lakehouse tables know, we’re not writing lakehouse tables down to lakehouses. You can directly write tables into a lakehouse and automatically use direct lake on Power BI models and Yes. Yes. Pull all the things in. So, I I I fully I I fully I I firmly believe, Tommy, like Dataflows Gen 2 is a better product. The only rub I think I have is Dataflows Gen 2 isn’t necessarily as cheap to run. Like if you ran a Dataflows Gen 1 and you ran a Dataflows Gen 2 to do the same activity, activity, the Dataflows Gen 1 in CU cost is
25:05 the Dataflows Gen 1 in CU cost is cheaper than the Dataflows Gen 2 cost. yes. So, that’s the only my only complaint there is you’re burning more CUs. And to be honest, it didn’t really matter what you did. If you were pro level and you needed to run Dataflows Gen 1 all day long, Have at it. have at it. There was no there was literally no threshold of of what you needed to turn on or turn off for it to work and add value. Fabric now causes us to be more mindful of metering of the items that we use and how we build them efficiently. It’s it’s just changing how we design I think slightly.
25:35 think slightly. my last point here and we’ll move on to the main topic is if your problem is that the cost and you just want to use Dataflows because you’ve been using Dataflows, this is a great opportunity to really rethink what are you trying to do with your Dataflows? I went through this with a few projects initially when Fabric came out. When I was like, “Wow, this is not the same. This is a little costlier.” Then I’m like, “All right, let’s take a look at notebooks.” And it’s like, “I guess really what I’m trying to do is just store this data because I’m connecting to Power BI, so let’s try a
26:05 connecting to Power BI, so let’s try a notebook.” And then what has happened now after 3 years is the majority, 90% of things I would have normally thought to do in a Dataflows Gen 1, I’m writing a notebook for. It’s a notebook and it’s much more faster, so I I think your argument here though, Tommy, is like that’s what we should be thinking about. That’s the direction I would really position people to. And now with AI, it’s even easier for you to do this. Hey, here’s my M code. I need to write a notebook that does the same thing. Make it easy to understand. Write
26:35 thing. Make it easy to understand. Write a lots of documentation around it. Like just let the AI just do these things. I think it’s a very solid use case of like where you’d want to leverage AI. You now get the same experience, much more cheaper to run, and now it’s in a notebook in a more modern architecture. Great. Love it. It’s a double it’s a double win for me in that in that regard. So, I think the complaint here though is individuals aren’t ready to go down the whole notebook route. Yeah. And I think that’s I think that’s the complaint here. I think the complaint is, “Look, Dataflows Gen 1 was a nice easy-to-use interface. It just
27:05 a nice easy-to-use interface. It just worked. I didn’t have to do a whole lot. And when we handed it out to our business users, they didn’t need a lot of extra knowledge to make it go.” Right? I understand. That makes sense. So, So,, the the world is changing and I think with better tooling and performance and dials and options on Dataflows Gen 2, we’re going to have to just educate the group and move forward and make it a bit we’re going to have to learn it, right? Honestly. I think I think I think you’ll be pleasantly surprised and you’ll like the advantages when you go towards this new route,
27:35 new route, in my opinion. All right. Anyways, all right, that was a really good, introduction there. Let’s move over to our main topic today. Tommy, we have a mailbag today. Let’s talk about marketing insights integration. Over to you, Tommy. All right. right. I have built a monthly snapshot report that is delivered to more than a dozen different business units across my firm. These are the subject of one-on-one meetings between the leads of those units and their managers. However, each business unit also has a
28:06 However, each business unit also has a marketing lead whose job it is to help the business unit help understand the metrics and understand some context and share some context from the marketing world for why a certain KPI is low or high and what steps being taken in the coming months to address them. So, we have standard metrics delivered by Power BI that need to have a narrative context out of my marketing leaders before the snapshot report goes to its primary audience. [clears throat] I’m well aware of your hostility to
28:36 I’m well aware of your hostility to PowerPoint even with the Power BI add-in. But what are some other what are some other tools or approaches that allow non-Power BI users to effectively mark up a report as a final phase before delivered? Surely this is a common problem. All right, Tommy, what’s your what’s your initial reaction on this monthly snapshotting problem? how they’re using Power BI in the, from the first half here. This to me is
29:09 from the first half here. This to me is right off the bat the quintessential the ideal of when you think I have built a good report or Power BI is working is that these are used in one-on-one meetings. I have always said that I know I’m being effective at my job that if I’m walking to a coffee in my office and I see during meetings Power BI on the screen, Yep. it’s a win I win. I or like,, the BI wins. And so, I love this workflow that they’re doing. And I love the workflow, too, that okay, there’s also some
29:41 too, that okay, there’s also some marketing leads that come in that they got to talk about those certain KPIs probably coming from Power BI. Now, that second part of the workflow is part right almost right back. It’s just part more not just the consumption of it, but it’s let’s review the metrics. We want to make some notes on this. We want to present it or have a conversation around it, but I need to log this in real time in PowerBI. PowerPoint can be effective here. Actually incredibly effective to what
30:11 Actually incredibly effective to what they’re saying, but there are some different approaches there. But I just want to give shout-outs and kudos to whoever wrote this mailbag because this workflow to me is the reason why PowerBI exists. And I think I think I think the main It’s so I would argue a lot of mean it’s so I would argue a lot of people struggle with look, I see data. I need to make comments about what’s happening. I had a client recently say, “Look, we’re we’re in manufacturing. We’re producing things. A lot of managers are reviewing
30:42 A lot of managers are reviewing performance of their team, right?” Something happens. Shipment was delayed, didn’t get materials, someone was out six,, didn’t have enough people to run a shift or whatever, and production is decreased or declined for some reason. Some something broke, right? This is This is like business 101, right? Stuff happens. You try It’s literally like feels like running businesses are like herding cats all the time, 24/7. You’re always trying to figure out what broke and how do I fix it? How do I move forward? So this is
31:14 this is common, I think, when we when we look at this level. That being said, right? [snorts] In lieu of that point of conversation how do how do how do we as businesses feed back to a central place about what happened? What occurred? This number Our numbers are down because of XYZ things or, we can explain this planning stuff in this way. So, one thing I’ll just point out here is it sounds to me this comment is was
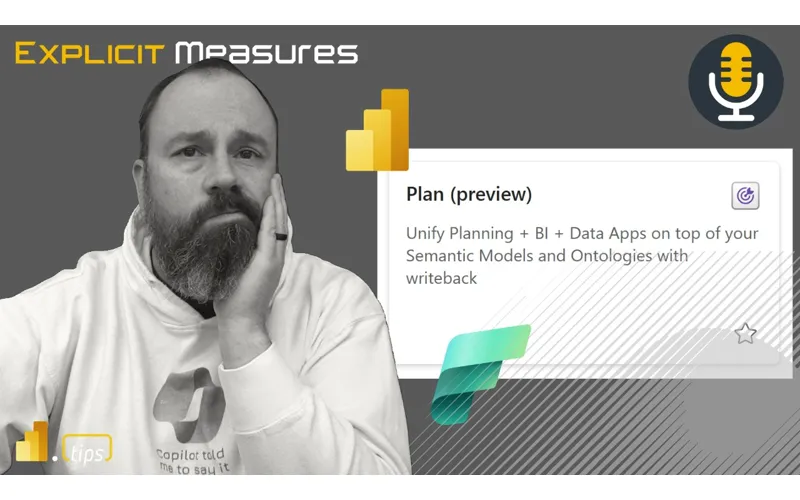
31:45 it sounds to me this comment is was before I’m guessing this is a bit older, Tommy, but this comment sounds like it was before Fabric conference was released. Yes. And I would argue yes, PowerPoint is a good way to mark up and and look at the data and present information. I might actually really want to explore the planner item that just recently showed up at Fabric conference. This might be a place where it’s a bit more interactive, and this is one of the things that’s always been a challenge for PowerBI. It’s been very one-way street. street. Data comes in, we make models, models
32:15 Data comes in, we make models, models push out data. There’s been and you and we can do some things now,
32:20 and you and we can do some things now, which is like translytical task flows. You can have reports. [clears throat] You can select a piece of data, and that those selection of data elements can be passed over to a function that can then write data directly to a SQL database. SQL database can directly surface comments back in your report. So, one thing I would maybe attempt to build here. It’s a bit more complex. It’s not as easy as other solutions that are out there, I don’t think. think. But translytical task flows there’s a number of good examples out there. I think it’s a great opportunity for
32:50 think it’s a great opportunity for write-back and capturing information about the data in real time. I don’t know if this is really a write-back type situation. This is very much to me a making a comment on the current data and basically speaking to it rather than writing to it or affecting it. This is not no, the numbers are wrong. We actually need to update this or I need to add a check mark or or verify that,, this is good before it goes to the next stage. This is very much the
33:20 the next stage. This is very much the case of okay, we look at this. Hey, let’s get everything ready for XYZ teams. Let’s make sure that we have our plan on how we’re going to address, you plan on how we’re going to address,, these these things. Honestly know, these these things. Honestly this is a great opportunity for PowerPoint. PowerPoint does not have to be something you use only with 35 people in a room and and as a presentation. It can very much be two to three slides that has information that’s just from a talking point. And the fact that I have
33:50 talking point. And the fact that I have the ability in PowerPoint not just to have a screenshot, but a live connection to a report that saves a state like a personal bookmark. Yep. Mike, it’s hard it’s really hard to say, “Oh, maybe we translytical here because I can be set up with PowerPoint and helping that marketing team out in 4 and 1/2 minutes. Mhm. Right now, if I already knew what I was going to absolutely put on the slide, but to connect and get everything ready to go
34:21 everything ready to go I can use that same PowerPoint because it’s connected to PowerBI. I don’t have to create different PowerPoints every month. So, that also gives some familiarity as well. so, I don’t really see the translytical. Planner to me seems very much focused on finance. I am intrigued if how that’s going to be utilized for non-finance teams. So, because I have a feeling, I don’t know if you played with it yet that the data right now and the way it’s
34:51 that the data right now and the way it’s set up is you need your data in a certain way in order to really use planner effectively. Remember the Mike, do you remember the PowerBI that Microsoft had? Yeah. Yep. Yep. Do you remember that custom visual, the power KPI, the both of them? And they were really cool except Yep. your data had literally had to be in a certain format. Yeah, every custom visuals for me have just always been like been like Yeah, but it the whole if you had exactly the right format I think. That’s This is my big complaint with like custom visuals. They seem to
35:21 with like custom visuals. They seem to be like very specific to a thing, and it was very hard for the the custom visual creator creator to communicate to me, “This is This is how I This is the data structure you need to make this visual work.” I remember that KPI. I’m sure they deprecated it. I never saw announcement for that, but I remember going over the tooltip and it was like, “Make sure to add your budget and forecast in this field.” You’re like, “What? Huh?” That thing. So, anyways anyways, speaking of that but PowerPoint
35:52 but PowerPoint I’m not going to go to PowerPoint. I’m going to actually talk about some other things here. So Tell me Tell me what would be a better use case here? Well, I I think there’s another couple other tools that you can use that help you communicate about a report. One of them is I don’t know how much off how often you use PowerBI inside Teams, Tommy. But PowerBI Teams also works pretty well. well. you can embed reports directly into I think it’s even like a Teams channel or chat thread. You can do that as well. But you can literally add the PowerBI icon inside like your apps. So, if you add the app of PowerBI, you can pull up
36:23 add the app of PowerBI, you can pull up a report. The report has a chat icon in it. And when you use the chat icon, you can snap a bookmark. So, some of this some of to the your point, Tommy, about the PowerPoint side of things, right? PowerPoint was the ability for you to have some data snapshot it, keep it in a single state while people review it and edit it because the data potentially behind the scenes is continually to change over and over and over again. Capturing bookmarks of a state of where the report is is essential to like getting people to see the same information over time even though the
36:55 information over time even though the data may be changing behind the scenes. so, one area is if you use the Teams integration, do the chatting experience, you can say enter comments, you can at-mention people in the chat experience, as well as you can also add screenshots. So, I use ZoomIt a lot, and I draw on the screen. So So I can use ZoomIt to zoom in on a particular part of the report, select something, highlight it, and put a screenshot of that back in the comments,
37:25 screenshot of that back in the comments, and then tag people for certain things that are happening about the report. So, to some degree, that solves I think a little bit more of this problem here. No, that makes you go back in time. That That makes you go back steps in what PowerPoint solves. So, I think I’m going to take Mike a position here, and I’m going to challenge you convince me something better than PowerPoint for this use case because what you just said is something that PowerPoint alleviates. Screenshots.
37:55 Screenshots. Take an image. Now, you have everything static. I can do that off a live report in PowerPoint and have everything highlighted where I need to. You’re just going back to what PowerPoint’s trying to solve. Well, I think it it I think here it’s the the I’m trying to address the issue down here at the very bottom of where it they’re trying to note about or hostility to PowerBI. How do non-PowerBI users effectively mark up a report? Non-PowerBI for final phase before it’s delivered.
38:25 delivered. Right? So, the question is I have a report. It’s going through final review. Where do we capture those comments around final review? The The question is saying PowerPoint is a medium to do this in. Is there any other mediums that we could use to help with this review process? So, I’m looking at this as a This is a review process before the report launches as an app inside powerbi. com the service. Is that That’s how I’m reading it. Are you reading the question differently? No, no. I I hear you, but I feel like whether you’re using Teams
38:56 feel like whether you’re using Teams then or PowerPoint, if you’re a non-PowerBI user, you’re stuck. Neither of these work then. Right? Right? So, if I’m a non-PowerBI user, I can’t use the Teams add-in or the Teams channel. I cannot view that if I do not have access if I’m not a PowerBI user. As he says that yeah, that allow non-PowerBI users to effectively mark up a report. a report. Oh, I see what you’re saying. So, you’re You’re catching on the hey, I’m going to Well
39:26 Well I didn’t I I think that’s the what I’m what I’m missed here, but both right now both saying I need to So, let me let me unpack what you just said then. Mhm. You’re commenting on the ability to actually get the report almost in a form or or a non pro user just hey this is a non Power BI user at all how do you look at reports? I I I have issue with that comment in general general just because that the whole purpose of doing Power BI is to centralize
39:58 doing Power BI is to centralize reporting reporting into some place and then have it all distributed out through a centralized item. item. And And I guess I don’t know. Like maybe if they said non Power BI pro users I can understand if you’re on a premium like that here but if you have don’t have access to Power BI at all what are you doing? you doing? Are you just only emailing everything out or you’re taking everything into PowerPoint as single so doesn’t have Power BI yeah.
40:28 doesn’t have Power BI yeah. One of the one of the main advantages I feel like that is Power BI is the ability to interact with report. Mhm. I feel like what I’m saying now and I’m reacting to this cuz I I missed that point so I apologize I missed that point they’re the non Power BI user. That feels to me like I need an email system that is going to email me out a bunch of things. That’s what this is feeling like this feels like a legacy company that’s just emailing a bunch of static things to people and saying here you go do your thing. And so what this is saying is I have a process where I
40:59 is saying is I have a process where I have developers building reports I have a team of people that are going to consume this not Power BI users so we’re only sending it to them via PowerPoint or images or static stuff. You’re negating the main purpose of why the Power BI part of it exists. In this situation I’d almost argue if this is really what you’re talking about maybe you should really look at paginated reports. I knew you were going to say it I knew you were going to say it the the first email it’s an email system. It’s SSRS it’s an email system it’s worked for companies for for
41:31 companies for for 30 plus years it’s worked. Like if that’s if your company says that’s the way you need to distribute things you get pixel perfect you can build whatever visuals you want on there none of it’s interactive and you can send it out. Now this doesn’t solve the problem of like the reviewing and the editing and and getting things back in with comments and changes that doesn’t solve any of that problem but I’m I’m looking at this going the main reason you use Power BI is so you can interact with the data. There’s filters on the filter pane you select things on the page that’s the main selling point of why it exists. Why
42:01 main selling point of why it exists. Why spend so much time building reports just to get static images of them and send them out. That would be my argument. Okay. Okay. Few things there. So I want to walk through this workflow with you that they’re talking about. about. Yes let’s walk through it again. the owner and the manager they’re looking at Power BI. They’re talking about a few of the metrics on the board. They’re like hey we’re reviewing your performance. Mhm some of these numbers are trending down. Hey marketing lead come in here can you explain what’s going on here? I don’t know what their relationship doesn’t
42:32 know what their relationship doesn’t matter. matter. That marketing lead comes in explains yeah well our X Y and Z is at 10% right now because whatever you a baseball team didn’t win doesn’t matter what it is here’s what we’re doing to address it. Here’s the different things that you’re going to notice on your KPI scorecard whatever. Okay thanks have a great day now we leave thing. And each business unit follows that procedure. I don’t see email as a I don’t know why email because the marketing team like there’s a team here
43:03 marketing team like there’s a team here that needs to be able to view the data view the report really. those numbers
43:09 view the report really. those numbers and then be able to prepare for that to one understand what it is for each business unit so it’s filtered for each business unit to provide some context around that because they have to know then obviously what the business units are looking at right they need the same data. They need the same scorecard really so they can actually speak to what you so they can actually speak to what explain those numbers. know explain those numbers. Now what’s beyond me here is why do does marketing not have Power BI? I don’t
43:40 marketing not have Power BI? I don’t know I I almost want to like disregard this part of here because I’m like if anyone needs Power BI it’s marketing. [laughter] That’s that’s so true Tommy. Yeah so like literally the people who love turning widgets with numbers is marketing. So I I’m I’m still confused by that but that’s the workflow here. The team outside in the business unit are still needing to talk about the same context the same scorecard here. And more importantly marketing needs to
44:12 And more importantly marketing needs to prepare for this and not write back and not just get the data but then prepare something on this like okay here’s what Jim’s going to look at next week in his performance meeting. What are we going to do about it what are we going to say? That’s Yeah. Yeah. I took a big read over the the two paragraphs at the end. I think the main story here is there’s not an easy way to add comments from other teams before the reports of the metrics go out. I think is what I how I’m hearing this
44:43 I think is what I how I’m hearing this right? right? let’s go that route because Let’s go that route I think I think that seems the most the most I like the most useful situation right? I have a report so let me go back to the the paragraph above right? We have certain KPIs it’s either high or low right? Then there’s another business decision and this is what I’m going to hang on Mhm. each marketing person lead in that business unit right? There’s a there’s a marketing person. They need to document what steps are being taken in the next coming months to
45:14 being taken in the next coming months to address the high and low or the basically the lows of why those KPIs aren’t matching right? So we have a so I’m going to read this as we have a set standards of things that we’re doing. Mhm. Mhm. Everyone’s aware of the standards we’re sending stuff out and we need people to provide contextual feedback back into that and says okay great. This is my area. Mike Michael is in charge of the YouTube metrics and channel. We had a goal of whatever thousands of views on videos we’re not making it. Michael you need to go back and supply
45:46 Michael you need to go back and supply what are you doing to fix it and how do I one distribute this report out let people add feedback and the feedback is now added and then the report can go to the broader leadership or audiences for everyone and then we have reasoning behind okay KPI’s low we know it’s low here’s what we’re going to do to adjust and fix that all right so so that’s that’s why I’m reading the scenario. I’m not going to focus on the distribution of the report I’m going to focus on the process of not meeting KPIs and people adding data
46:17 not meeting KPIs and people adding data to KPIs. Let me just pause there. Do you feel it’s a fair use case? I think that’s a perfect I think let’s go that route so Okay. Okay. I think if we lean on that area this does to me feel like some level of like translytical does make sense. Yes. Because this is this is literally the story of translytical task flows. Hey go here to the report select the data that you want to make comments on make a comment in a text box on the report page and it
46:47 in a text box on the report page and it round robins that data back into a SQL database. database. I think that’s by it’s a bit more of a complex setup but once you’ve got it dialed it works really well and it’s super fast. for users it’s incredibly simple so go and I think you’re right Tommy like it’s it’s simpler than even the PowerPoint. Go to the report go to a page dedicated for your KPIs or drill through to a specific KPI or specific information add a large text box there. Add some add some things right there.
47:17 Add some add some things right there. You can run that and that will then automatically save it. The only caveat here is your standard like there’s like the standard data you have coming in which is like maybe import mode a SQL database coming from somewhere else. This This translytical task flows requires you have like a transactional data system directly inside fabric typically I use the SQL database inside fabric to capture the aligning details or notes right? So if I make a note on this data point or series
47:48 make a note on this data point or series of data points or dimensions I need to know what dimensions I’m describing that my comment applies to and then being able to read that back in the report. I I yeah go ahead. I’m just going to pause there that that that was my thought. I think I think this is the solution. solution. I really actually would agree with this because this is reminding me now more of an older project I worked on which was very convoluted which was almost in the same vein where the numbers would come in and three different teams needed to review certain
48:18 different teams needed to review certain rows to make sure that they were validated to be sometimes information needed to be rechecked something needed to be sent re back to another client and before the actual report went out the numbers would update and we had PowerPoint and we had actually in that report we had four different PowerPoints to validate and they would actually go through and highlight the records that were like nope this is not ready to be sent out or this is not verified yet. That would actually push back to
48:50 actually push back to another data source and then you had to refresh the report to get those numbers but then they would actually highlight on those tabs and what would actually be seen for production in a sense was this nice report with everything already filtered based on what users selected. So Yes. Yeah but the difference is with translytical it’s more than just simply write back. It’s a sets off a set of tasks anything that you want. For example you can have a scorecard you can have the things that you want to
49:20 you can have the things that you want to highlight write some notes it can send an email or heck you put together a PowerPoint with that data that you selected. It’s honestly the you have a lot of freedom with translytical and user UDFs. So So is this going to be a lot more work in the beginning for the developer? Heck yeah. you better know AI now because it’s going to help. But for users it becomes a very seamless thing and it’s you live in the Power BI report.
49:51 it’s you live in the Power BI report. All this lives in the Power BI report. Which is different from both of the solutions we’ve talked about. Agree. And I I think there’s also some So I’ll also I I also do want to touch up some ideas here around the planner item. I’m going to try to I’m trying to literally Google this right now as we go in here. planning sheets are also items where you can have a plan or KPIs that are on certain items.
50:21 or KPIs that are on certain items. There’s these things called scenarios. You can plan these scenarios. There’s sliders, there’s buttons. You can enter in new numbers. One thing I’m looking for here is is there any ability for you to add comments against some of this as well. So almost having like a different column. Like there’s a number a numerical column and there’s like a text column, right? So you can go back into planner and add comments about what’s going on there. I’m not sure there’s a commenting feature yet in this one. So that’s what I’m trying to look at right now is,, how do we build forecast? What does input data look like? What can you write back out?
50:53 like? What can you write back out? But I But I I maybe seriously look at the planner item. It seems to do a lot of things that are useful in this scenario. And that would be maybe, it’s it’s saying common scenarios are including saving budget and forecast inputs, storing scenario planning for expected results, capturing a manual adjustment on data, synchronizing your planning data it to be. it to be. Yeah, right. Synchronizing your planning
51:23 Yeah, right. Synchronizing your planning data with your enterprise data warehouse, right? So there’s there’s some things here that I think make a lot of sense. you manage the destination, you manage where the data comes from. And then you select the different types of data that you want to ingest in here. I don’t see anything yet around text. text. Hold on. Hold on. It does say here text length length of all string columns 512. okay. okay. Oh, here we go. Perform a write back. You can do a write back scenarios for
51:54 You can do a write back scenarios for forecast, data input values, comments, annotation, allocation results, and require and the required artifact will then write back to the the source system. Write back completed. So I do think So I think Tommy there is some ability ability reading the documentation here. It’s go really in there. Comments and annotation I think is what we’re talking about. Yeah. That’s what we want. Yeah. So I think planner I think translytical. And so I think there’s different levels to this here too in terms of what is the
52:26 to this here too in terms of what is the if you had a skills matrix or basically our feature matrix of when does one of these make sense? And I think the three that are still contenders to me here is PowerPoint, translytical, planner. And do you have an order that on which you would you would put them in? Do I think it it’s one of those fancy graphs that’s basically showing the the development skill and what the new you’re trying to do. That’s what it makes sense. I don’t think there’s a set priority a universal priority here. Because I think it depends on what your
52:56 Because I think it depends on what your environment’s already like, right? Like if if you’re not using directly with lakehouse, it’s almost a non-starter for translytical and and even planner to to a degree. Yeah. if you have no development skill in Python, I know we have co-pilot, but is that the route you want to be going if we’re a Power BI, some people don’t even have Power BI at this point. Or or the the fact that, we’re trying to just add a comments here. Are people needing to actually log
53:28 here. Are people needing to actually log their notes somewhere that we can verify that over time? time? Or is it simply someone coming in describing the context and what they’re doing? doing? I think those are all the things that whether or not you actually make the next step. Because once you go up a level level you get more features, you get more things that are happening, but you have a lot more dependency, like things to manage. I think the very basic is obviously
53:53 I think the very basic is obviously PowerPoint. That’s a that is obvious. If you’re not having to log this information, if you just need marketing or someone to come in to help explain everything, I think the PowerPoint’s a great option here. The what they’re trying to do. But if marketing needs to do if there’s a lot more collaboration that needs to happen, that’s when you get up to the next few levels here.
54:24 I agree, Tommy. And and and I want to agree and I want to also add some something else here that just threw me for a loop here. So the reason why I’m I’m I’m I’m balking a bit here is is Looks like Joshua is on one of the ones you’re commenting here. Someone commented Joshua particularly in the in the chat here said power table sheets. sheets. Oh, no. Oh, no. Tommy, are you familiar with power table sheets? sheets? is that Power ON? I think is that the company from Power ON? Great thought. That’s what I thought too and I was like that’s a third party it’s a workload. I I thought I looked at it thought this is this is a
54:55 is this is a to it. to it. I saw this is a third party item and I thought let me go Google this one. I Googled it. It’s not. Power table sheets was announced I think at Fabric conference, but with maybe little fanfare. fanfare. Build a no code table app in power table sheets. sheets. In [snorts] this article you will create a table app with power table sheets. It’s in preview. And the prerequisites for using this are a Fabric SQL database, a semantic model, and a plan item. So once you have a plan item created,
55:27 So once you have a plan item created, you can build a full table and create a power table sheet directly inside your workflow. This is part of planner. Or is it not? of planner. So this is an output of the planner item that actually gives you the the table experience where you can create a new table, you can pick some data, and you can configure the different data columns directly inside the tool. the tool. Which one is a primary key? What’s the foreign key? Do you want additional data values? Text or not text? It’s just literally a table generated inside Mhm.
55:58 literally a table generated inside Mhm. Fabric. Fabric. Which Which this is very very much needed just because we don’t have really good uses of this yet. So I actually really like this one. This might actually be a really good use case here. So these are So all this to say thank you for a person who wrote the question. question. tables at Fabric I used to use. Yes, exactly. So this is like it happening in real time here here. So I’m going to Why didn’t you talk about that? I don’t know. I didn’t know that existed. It So I went back to the article, Tommy. The article was released
56:28 article, Tommy. The article was released on April 6th. It it’s it’s brand new. Like just Like just not even a week or so ago. It was the article was updated. So maybe it was already there. I didn’t know about it. Somehow I missed this news. but power table sheets looks like another really good option. So here’s what I’ll say for this this user who’s given us the question, right? PowerPoint is an option. I think I would really spend some time looking at does the power tables and power sheets does that actually help you get closer
57:00 does that actually help you get closer to your answer? When the write back with the data with the metrics. Is that something that you would that you would be able to use to leverage this with people? If you really do need the report and it has to be the report where you’re looking at a pretty report and you don’t want people going into other Fabric items, I understand. Totally understandable. In that situation, I would go after the translytical task flows. My priority of preference would probably be be check out planner, see if it meets your
57:30 check out planner, see if it meets your needs. Go look at power table sheets. See if that solves again more of your problems. Then go after translytical task flows. And my, yes, you can still use PowerPoint, but that’s really not my most that’s not my favorite recommendation option. Everybody knows that. I know. Everyone knows I hate a mailbag. He was he was talking He’s commenting back to or he or she was commenting. I know you hate PowerPoint. Yes, I very very aware. It’s my, if the world is burning tomorrow and the only thing I have left is Power BI and PowerPoint, then I’ll
58:01 is Power BI and PowerPoint, then I’ll finally use it. But until that moment not even that because the first time you saw Chuck Sterling at a do a conference and you saw that he was using Power BI for his slides, you probably fell in love. That was me. I was doing that stuff. No, Chuck did that first. -. I was like I like I you you Maybe he maybe he did, but I was just so lazy and I wanted to be like I need to learn Power BI and I’m going to just ditch everything PowerPoint. I I do not doubt that you did that. If there’s data, I’m only going to I’m only going to run PowerPoints or or presentations through Power BI if it had
58:31 presentations through Power BI if it had data on it. It was at one of the world tours and it was probably like a 35 I think slide. I’m like I know he spent more time in this than he would have in PowerPoint, but this is so cool. So I had no doubt that you you did that. So okay. I don’t There’s one there’s one gripe I have about this, Tommy. If there is one feature in Power BI that I wish it had like Michael’s magic wand for a day. day. Every time I take a screenshot. So sometimes you’re in your computer and you’re looking at something and you want to take a screenshot or you want to have an image or just
59:02 or just I want to be able to screenshot something. Take a picture of it. Get it to my clipboard. I want my clipboard to paste an image into desktop. You can’t do it. That is really frustrating. You can’t get an actual image. Just an actual image. Like I have again one of my things I used it as a file. Or yes, you have to save it as a file and then have to go get it in there. Can’t drag and drop. It doesn’t get show up. Why that doesn’t just exist, I don’t know. But to me that’s like a really low hanging fruit of Can Can you just stick an intern on
59:32 of Can Can you just stick an intern on this one? I don’t know if it ruins the listening at this late in the in the show. show. Well, let me give you an example, Tommy. Let me give you a really use You’ll like this use case. Okay. I’m going to distribute my model to the business team. They’re going to only have access to the report. report. And they’re going to need to build something in the report or make some changes. changes. Part of the documentation pattern I like to give to users is here’s an image of the tables and how they’re related. If you are a report consumer, you never know how to build new pages
60:02 you never know how to build new pages Sure. because you can’t see the tables. So, what I like to do is put a couple images or a series of images in the report that says, “Here’s how these tables relate. Here’s the fact table. Here’s the dimensions.” And if you have a,, like multiple star schema diagram, there’s actually many different fact tables and multiple dimensions, sometimes it gets a little bit complex of like what’s happening. Sure, sure. I’ll go to Power BI Desktop, I’ll screenshot the image, and I want to put it in a page. Just add documentation.
60:32 documentation. If I’m clicking on a visual and I want to explain why the information button is there or I want to show how drill through works, simple little documentation piece. Just needs to work. I want to take a screenshot of that thing, put a little red arrow, here’s what you need to click to get the feature of this report, drop it into some documentation. Can’t do it. Not easy. So, to me, that’s just like why doesn’t this just work? That’s a very low-hanging fruit., intern at Microsoft take on a task where you can copy an image from your machine and just put it
61:03 image from your machine and just put it inside Power BI Desktop. The amount that you do that pick your battles. We still don’t have quick access toolbar, okay? I’m the I’ve done full I’ve done full that battled, man. No one will put it back in the tool. But every other every other Microsoft product Yeah, right? Every other product team like What other tool do you need to have like every other product does this? You can drag and drop anything into PowerPoint. You can drag and drop anything into Excel. It stuff just starts showing up. Why is Power BI the only tool that doesn’t let you drag and drop and put things in there? Anyways, total random side note.
61:33 total random side note. All right, any other final thoughts, Tommy, before we wrap today? No, I I really enjoyed today’s conversation. I did not think we were going to go to Fabric IQ and Fabric IQ continues to intrigue me more and more, but [laughter] He keeps It’s sneaking into these side conversations we weren’t really expecting. Yeah. Yeah. And here’s the thing I think we’re realizing, too, because I’m looking at the doc that you’re talking about. Fabric IQ isn’t a product. It’s a basically a series of already,, in a sense, existing products. And I’m
62:03 in a sense, existing products. And I’m more and more intrigued at how that’s going to seep into our normal workflows. I I really loved today’s conversation. I love the workflow here, and I hope that more more teams are having this type of conversation because they’re implementing these types of processes. Mhm. Mhm. So, that’s my final thought. I The world we live in is very interesting right now. Things are changing very quickly, especially with this Fabric IQ piece. It feels like some of these other third-party companies, so this whole planner thing that we’re
62:33 this whole planner thing that we’re talking about was built by Lumel initially, and then Microsoft said, “Hey, this is a neat idea. We should really have this as part of our product.” And somehow Microsoft acquired them. I’m them. I’m So, so that Microsoft basically acquired their product that they built inside Fabric, and now they’re getting their product basically built into Fabric as a part of the core product. Interesting. But that being said, th- this is maybe a pattern we’re going to start seeing, Tommy. Microsoft is going to continue opening up its marketplace for other products or tools that are out there in the market
63:03 tools that are out there in the market and then slowly acquiring these tools and bringing them into the product cuz then Microsoft sees all the usage and the metrics. Who’s got the most usage? Who’s Which product is being built in the marketplace that is most in alignment with what Microsoft is doing? Which part of those items would need to be brought into Microsoft into the ecosystem? So, this is really interesting to me of what’s happening here, and very intriguing to me to see how this is working. Anyways, that being said, thank you very much for the question. This was a great question today. My final thought here is
63:33 today. My final thought here is try not to use PowerPoint as much as I [clears throat] guess that’s all I can say. and that being said, thank you so much for listening to the podcast. We hope you found this topic informative. I hope this was a good conversation about a little bit about write-back and understanding the impact of where that could be used and how you can leverage that across your different tools. tools. That being said, Tommy, where else can you find the podcast? All right, you can find us on Apple, Spotify, wherever you get your podcast. Make sure to subscribe and leave a rating. It helps us out a ton. You have an idea, topic, or question that you want us to talk about a future episode, like today, head over to
64:04 episode, like today, head over to powerbi. tips/podcast, leave your name and a great question, and finally, join us live every Tuesday and Thursday a. m. Central and join the conversation on all of powerbi. tips’ social media channels. Thank you all so much for listening today. We appreciate you, and we’ll see you next time. Hey, explicit measures, pump [music] it up BI high. Tommy and Mike lighting up the sky. Dance to the beta, laughs in the mix. Fabric and May [music] I get your fix? Explicit measures,
64:34 fix? Explicit measures, drop the beat now. Podcast kings, [music] feel the crowd. Explicit measures
Thank You
Want to catch us live? Join every Tuesday and Thursday at 7:30 AM Central on YouTube and LinkedIn.
Got a question? Head to powerbi.tips/empodcast and submit your topic ideas.
Listen on Spotify, Apple Podcasts, or wherever you get your podcasts.