
Introducing Layouts
How do I get free Power BI layouts for my reports?
TL;DR. Start with a free PowerBI.tips layout from the gallery, use it as a report structure or wireframe, and continue in Power Designer when you need to shape the report. These layouts are starting resources, not Microsoft official sample dataset templates.
Where can I find free Power BI layouts?
Open the PowerBI.tips layout gallery. Browse layouts and wireframes there, then download or open the starting design that fits your report.
What is a Power BI layout used for?
A layout gives you a report page structure to start from: visual placement and composition you can change. It saves time versus building every page from a blank canvas.
Are these layouts official Microsoft templates?
No. They are PowerBI.tips resources. Microsoft official templates and Microsoft Learn sample datasets are separate.
Can I use a layout with Power Designer?
Yes. Use the gallery for free starting layouts, then continue in Power Designer when you need the Tips+ report-design workflow.
How is a layout different from a full sample dataset template?
A layout is about report structure and wireframing. A Microsoft Learn sample dataset template is a different kind of starter that centers on sample data and models. Do not treat them as the same thing.
Related: Power BI layouts, Open layout gallery, Power Designer, and Power BI Theme Generator.
PowerBI.tips is extremely happy to be part of, and contribute to, the Power BI Community. We’re constantly trying to think of new and interesting ways we can enhance the Power BI experience for everyone by providing helpful tips & tools. Some examples of what we’ve done so far are Power BI Desktop Theme generator, and the Power BI toolbox:


Today we’re happy to announce another tool that we hope you will get an immense amount of use from.
Introducing:
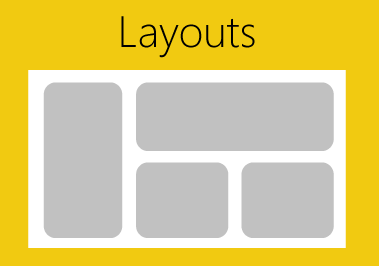
Layouts are Power BI Template (PBIT) files that will contain layouts with visualizations already in place and only require your data to light up. We have, and will be, using as many of the visualization techniques. We are taking some of the best layouts we’ve seen, and those we’ve developed to create these files for you. This means that you don’t have to spend any time worrying about the vast number of design techniques. Additionally, it will save you time placing or moving things around on the report page. All that is required of you, is to download the PBIT file, load your data, and start selecting the pre-placed visualizations. With each layout template there will be a sample file (demo) that will show you the look and feel of each layout so you can easily choose the layout you want on each report page. You can always change the visual type with the click of a button.
Today, we’re releasing the first of our efforts with a 3 tab layout focused on the business analyst. These layouts are designed with maximum flexibility in mind, to let you alter color themes, easily change the visualization type, and provide enough visualizations to give you a huge initial benefit. One of the best parts about the Layout is that you are not limited by our designs, they are just the starting point, you can fully customize them however you would like. We just provide you with a solid foundation to build from.
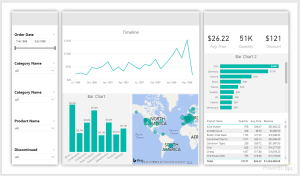
Click Image to Download Layout Files
Demo of Layouts:
In addition to the first analyst layout, we’re releasing an Info-graphic style layout that contains some deeper interactions using Bookmarks. However, these Layouts will be a bit more restrictive in terms of how much you can change visually. This is due to the need to rely more heavily on other tools to create the look & feel. Thus, you will have limits in just how much you can change. Our hope with these is to build more stunning report layouts that will maximize presentation, or help wow an audience.
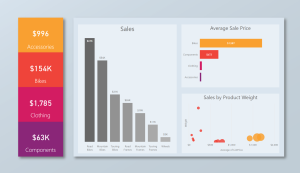
Click Image to Download Layout
We are releasing layouts for the analyst, executives and still have some fun with highly stylized files. We hope you get as much use out of these new Layouts as we know we will! Over time, we will continue to develop and produce an entire library of the selections. Thanks to all of you who make this such a fun and great Community to be a part of.