Month: July 2018

  • Microsoft Business Applications Summit – New Layout – Purple Haze

    Microsoft Business Applications Summit – New Layout – Purple Haze

    In honor of the 2018 Business Applications Summit, PowerBI.Tips has published a new layout, Purple Haze.  Purple Haze is the brain child of Seth Bauer, and utilizes the latest features of the July 2018 Power BI Desktop.

    In the previous versions of Power BI desktop there was always a header present at the top of a visual.   Now, the header is no longer needed, and design elements within the report can extend all the way to the very top of the report page.  This is great news for report designers and new possibilities for Layouts.

    Hit the link to download the Purple Haze layout.

    [product id=”18324″ ]

    Cool Features of Purple Haze:

    • The report comes with four (4) pages.  In the example the are listed as Accessories, Bikes, Clothing, and Components.  By Clicking on these buttons the report navigates to a new page where all the visuals for these topics exist.
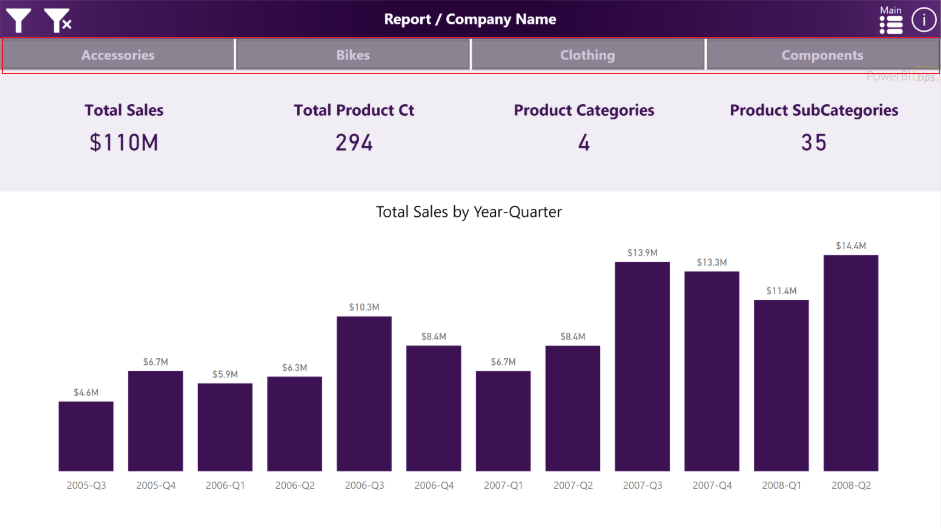
    Purple Haze Menu Bar
    Purple Haze Menu Bar
    • The filters across the top of the report are using an upper third filter context window.  This window is exposed when clicking on the filter icon, which is found in the upper left hand corner of the report:
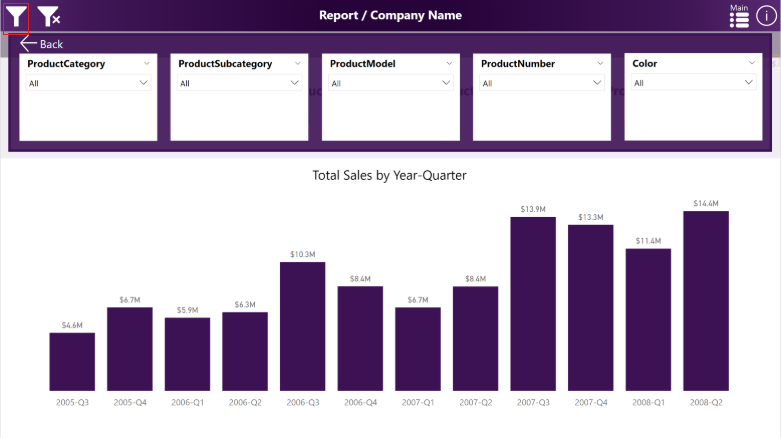
    Purple Haze Filter Menu
    Purple Haze Filter Menu

    We hope you enjoy this new free layout.

    Be sure to follow:

    If you like the content generated from PowerBI.Tips please follow me on all the social outlets to stay up to date on all the latest features and free tutorials.  Subscribe to me on YouTube.  Or follow me on the social channels, Twitter and LinkedIn where I will post all the announcements for new tutorials and content.

    YouTube Linkedin Twitter
  • Microsoft Business Application Summit – PowerBI.Tips 2018 Top Tips and Tricks

    Microsoft Business Application Summit – PowerBI.Tips 2018 Top Tips and Tricks

    Want to give a special thanks to the Microsoft PowerBI team for allowing PowerBI.Tips to participate in the 2018 Microsoft Business Application Summit. If you were not able to make it to this event don’t worry, we are bringing the PowerBI.Tips session to you.

    The 2018 Top Tips and Tricks from PowerBI.Tips Session:

    MBAS Video

    What is in this Video:

    Link to Video is here

    In this video session Seth Bauer and Myself walk through a number of most viewed / used features of PowerBI.Tips.

    The following topics are covered within this session.

    1. Crazy Table Gymnastics
    2. Center the X-Axis in a Visual
    3. Segmented Filtering a Report Page with Slicers
    4. Filter a Slicer
    5. Query Editing and Adding Data Types to M Code
    6. Using the Lingo tool to modify the Power BI Linguistics Schema
    7. Create beautiful reports quickly by using Layouts
    8. Making a Date Table in DAX / use time indexes to create efficient measures for time analysis

    If you want to watch all the content from the Business Applications Summit you can zoom over to the official page here.

    Be sure to follow:

    If you like the content generated from PowerBI.Tips please follow me on all the social outlets.  Stay up to date on all the latest features and free tutorials.  Subscribe to me on YouTube.  Or, follow me on the social channels, Twitter and LinkedIn, where I will post all the announcements for new tutorials and content.

    YouTube Linkedin Twitter


  • Tic Tac Power BI

    Tic Tac Power BI

    I am proud to announce another joint development game between Philip Seamark and myself (Mike Carlo) of a Tic Tac Toe game.  To read about how this game was made jump over to Phil’s blog post found here.  If you just want to play the Tic Tact Toe game you can do so below in this Embedded sample found below:


    To play the game in full screen mode visit this link.  Additionally, ff you want your own copy of Tic Tac Toe you can download your copy here.

    Be sure to follow:

    If you like the content generated from PowerBI.Tips please follow me on all the social outlets.  Stay up to date on all the latest features, free tutorials and downloads.  Subscribe to me on YouTube.  Or follow me on the social channels, Twitter and LinkedIn, where I will post all the announcements for new tutorials and content.

    YouTube Linkedin Twitter
  • Center the X-Axis on a Line Chart

    Center the X-Axis on a Line Chart

    Sometimes when your working on a line chart you want the x-axis to stay centered on a chart. This tutorial will walk you through how to create an X-Axis that will always center it’s self on the graph.

    Video Support Material:

    The measures discussed within this tutorial are:

    Variance All = SUM(Sales[Variance])

    The column name Variance is found in the data table called sales.  This is just a numerical column.

    After summing up all the variances we can calculate the min and max lines.

    Const Max Line = [Variance All] * 1.2
    
    Const Min Line = -1 * [Const Max Line]

    Finally to calculate the variance to date you can use this filtered measure, which will only produce historical values.

    Variance To Date = CALCULATE([Variance All], FILTER('Sales','Sales'[Date] <= EOMONTH(TODAY(),0)))

    Thanks for watching our short tutorial.  If you like this video please be sure to follow me (Seth Bauer) on Twitter, LinkedIn and be sure to subscribe to the PowerBI.Tips YouTube channel.