PowerBI.tips

Microsoft Business Application Summit – PowerBI.Tips 2018 Top Tips and Tricks

July 28, 2018 By Mike Carlo
Microsoft Business Application Summit – PowerBI.Tips 2018 Top Tips and Tricks

Want to give a special thanks to the Microsoft PowerBI team for allowing PowerBI.Tips to participate in the 2018 Microsoft Business Application Summit. If you were not able to make it to this event don’t worry, we are bringing the PowerBI.Tips session to you.

The 2018 Top Tips and Tricks from PowerBI.Tips Session:

MBAS Video

What is in this Video:

Link to Video is here

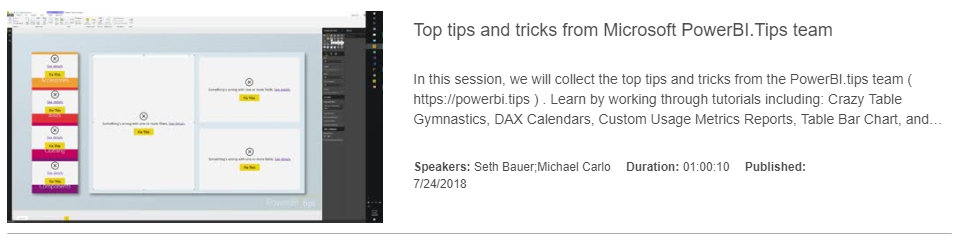
In this video session Seth Bauer and Myself walk through a number of most viewed / used features of PowerBI.Tips.

The following topics are covered within this session.

  1. Crazy Table Gymnastics
  2. Center the X-Axis in a Visual
  3. Segmented Filtering a Report Page with Slicers
  4. Filter a Slicer
  5. Query Editing and Adding Data Types to M Code
  6. Using the Lingo tool to modify the Power BI Linguistics Schema
  7. Create beautiful reports quickly by using Layouts
  8. Making a Date Table in DAX / use time indexes to create efficient measures for time analysis

If you want to watch all the content from the Business Applications Summit you can zoom over to the official page here.

Previous

Tic Tac Power BI

More Posts

Jun 10, 2026

Microsoft Build Recap – Ep.535

Mike and Tommy recap Microsoft Build 2026 through a Power BI and Fabric lens, focusing on the announcements that matter most for report builders, semantic models, and agent-driven app development. They unpack why Rayfin, Replit integration, OneLake, and new Fabric skills signal a shift from asking AI for answers toward using agents to create real production artifacts.

Jun 5, 2026

CI/CD Automation with Agents – Ep.534

Mike and Tommy explore how agents can simplify CI/CD in Fabric by helping teams work through Git workflows, merge conflicts, validation, and deployment automation. They also compare deployment pipelines with Git-based approaches and explain why small, testable automations are the safest way to start.

Jun 3, 2026

Claude Design & Power BI Embedded – Ep.533

Mike and Tommy explore how Claude Design, agentic workflows, and HTML wireframes could reshape report prototyping for Power BI teams. They also debate where today’s tooling still falls short, especially for Power BI Desktop users who need practical ways to turn context, design ideas, and embedded experiences into working reports.