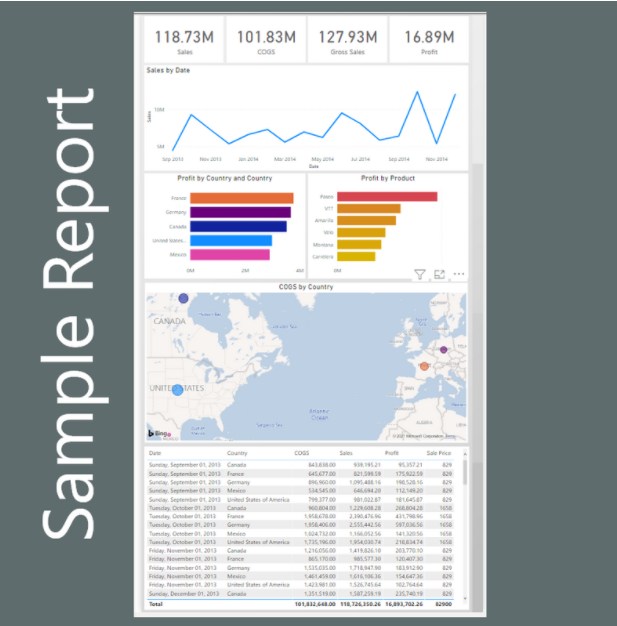
A better way to Mobile
Where does the Power BI Mobile app fit within your report building plan? This topic is widely un-discussed within the Power BI community. Many blogs and tutorials focus mainly on developing Power BI reports for a desktop screen. More specifically, a report design that fits a wide screen monitor. However, building reports for the mobile app require additional considerations.
The Current State of Mobile
First before we get to the recommendations for mobile reporting developments, let us discuss the current status of building a mobile report. To create a mobile centric view Power BI desktop follow these steps:
- Click on the View ribbon
- Click on the button labeled Mobile layout
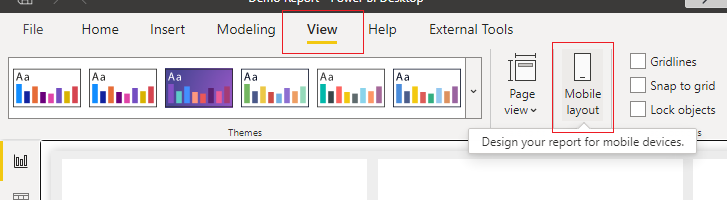
Click on the Mobile Layout
Portrait Mode Only
This takes you to a new screen where the mobile device is positioned in portrait mode. At the time of writing this article there are no options to build a mobile view in landscape. If you desire to have a mobile report that can be viewed in landscape mode you actually have to create a normal report view but with a narrower screen.
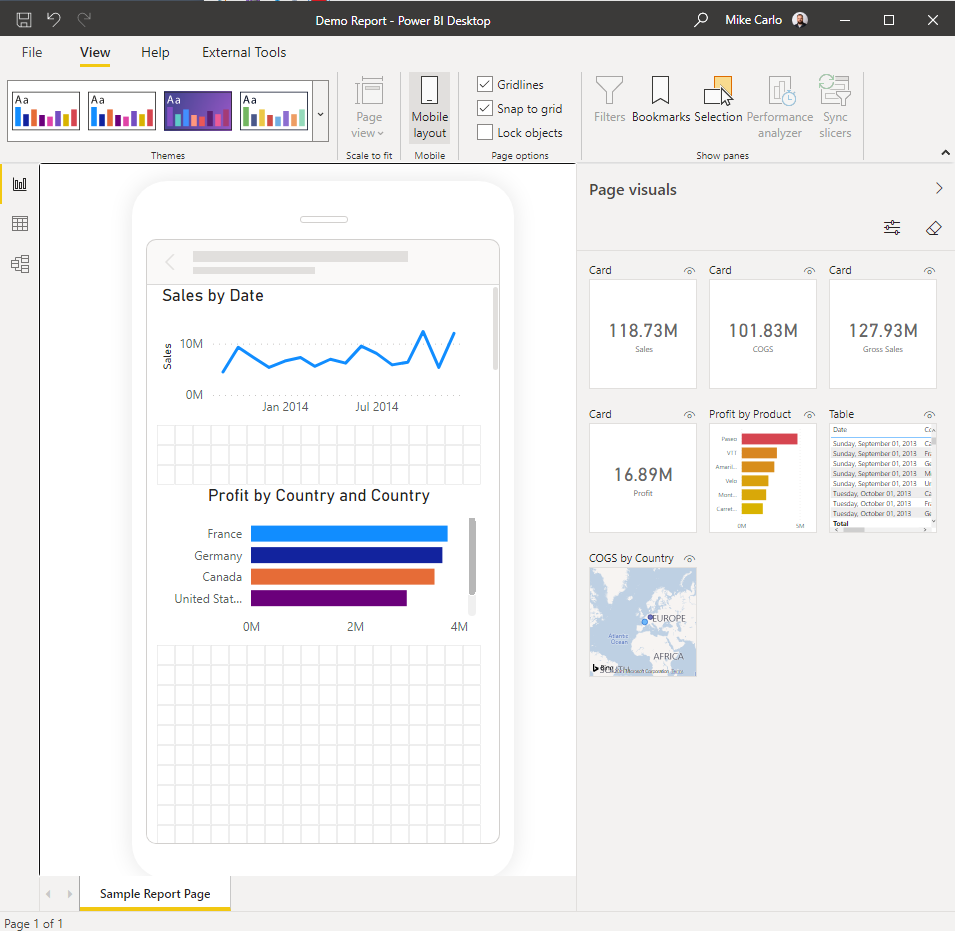
View of building reports in the mobile view.
Simplified Build Experience
The report canvas is greatly simplified. Meaning you don’t get all the advanced features of a normal report page. Stacking visuals on top of each other is not an option. Changing the color of the background is not an option on this screen. Instead, to change the mobile page background color you have to leave the mobile view. Return to desktop mode change the color and then return to the mobile view.
An Alternative Approach
Due to the limitations mentioned above. We propose that you build a report page with custom dimensions. From my experimentation a width of a page from 600 to 800 pixels meets my needs. The page length can be as long as you need it so that all the required visuals can fit on the page. Previously pages have grown to 1000 to 2000 pixels in length.
How to customize the page size?
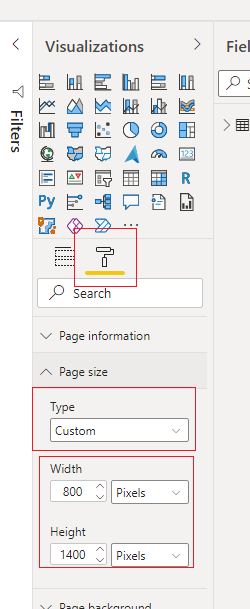
Follow these instructions to change the page size
- Click somewhere on the Report page to deselect any visuals
- Open up the Visualizations Pane
- Click on the Format button; the one that looks like a paint roller
- Open the section named Page Size
- Change the drop down menu for Type to be Custom
- Type in a new Width and Height for the page
Change View of Report for scrolling
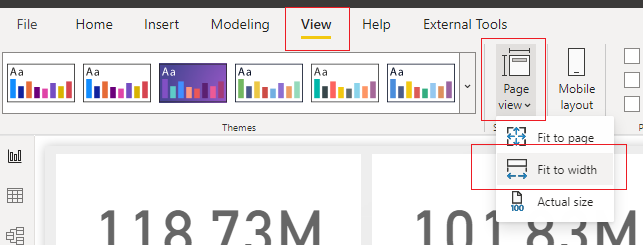
By making the page narrower but longer, the default view of the report will cause UX challenges. To fix this the report is will need to render as a scrollable object. To do this we adjust the view settings of the page
- Click on the View ribbon
- Click on the button named Page View
- A drop down menu will appear
- From this dropdown menu Click on the option named Fit to width
Fit Page to Width
Other UI / UX Considerations
As a report designer it is important to consider the UI for report consumers. In most reports I design everything that the user can see fits on a single page. Scrolling on a page is not a major issue. As we introduce scrolling on mobile we run into issues with some visuals.
Table Visuals Cause Issues
Take for example a table visual. This visual it’s self has scrolling built in. Thus, if you are scrolling a page on mobile when you touch inside the table and swipe up the mobile experience swipes the table visual. This UX can lead users to get suck inside a table when attempting to scroll the page.
Table Scrolling Solution
A solution to address users getting stuck inside a table is to provide a pixel boarder. The boarder can be either dual boarders on the left and right or just one boarder on the left or right. Inside this boarder do not place any visuals that would require scrolling, such as a table.
Adding a Scrim for added Clarity
In addition to just retaining a pixel gap on the sides I recommend also adding some color to the background. The concept of the color either in blocks or via a gradient color. See the following sample scrim for reference.