Category: News & Events

  • Power BI August 2017 Release

    Power BI August 2017 Release

    I love these updates, it’s like Christmas comes every month!!  This month we get a ton of really great features, I for one am super pumped to get into the tool and checking it out.

    Here are a couple of highlights you should check out.  First up, matrix & tables now support conditional formatting for TEXT!!!  Definitely long over due, but I’m happy it’s here.  In one of my recent projects we had a horrible time trying to get the subtotals working correctly in the matrix visual.  So much so that we had to abandon the matrix view all together.  Now it looks like with this months update there is a substantial improvement to how subtotals work.

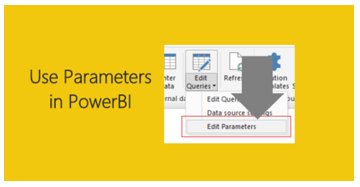
    Lastly, I think the most important update and I think the best feature for this month’s update What-if Parameters…  I haven’t played with this much, but from what I know this is going to be awesome!  I would be willing to be the heavy analyst is going to love this feature.

    Here is the full video of all the updates for this August, Enjoy.


    If you want to review the full August release for PowerBI Desktop, you can hit the PowerBI Blog here.

  • Microsoft Data Insights Summit

    Microsoft Data Insights Summit

    This year I had the wonderful privilege to attend the Microsoft Data Insights summit for 2017 as a speaker.  My topic was the Top Ten Tutorials from PowerBI.Tips.  So, let me say thank you to all those who attended you provided a very fun audience and were very positive, Thanks.   For those of you who couldn’t make it to the Data Insights Summit below is the actual talk:


    We went through 10 different tutorials in 50 minutes.  Needless to say we went pretty quick.  So, if you were there, or just want to go through the tutorials on your own here is the list of the Top Ten Tutorials.

    10. Loading Data From a Folder ( Link to Tutorial )

    9. Using Parameters ( Link to Tutorial )

    8. Loading Multiple Excel Files ( Link to Tutorial )

    7. Custom Date Tables ( Link to Tutorial )

    6. Percent Change ( Link to Tutorial )

    5. Histograms & Disassociated Tables ( Link to Tutorial )

    4. Bar and Whisker Plot in R ( Link to Tutorial )

    3. Bar, Scatter, and Area Chart in R ( Link to Tutorial )

    2. HEX Bin Scatter Plot in R ( Link to Tutorial )

    1. Color Theme Generator ( Link to Tutorial, Link to Advanced Color Theme Generator )


    If you wan to learn more about Power BI or DAX follow this Link to books and other helpful Power BI resources.

  • Power BI June 2017 Release

    Power BI June 2017 Release

    This month we have a big release for Power BI Desktop and for the Power BI service.  There are a number of great new features.  For the everyday user you will love the new Data bars for the new table & matrix visualizations.  For me this really feels like a feature that is making tables and the matrix views feel more like the pivot table and formatting that can be done in excel.  Great Job Microsoft!

    For the developer who want to who may be using Rest APIs you should definitely check out the newly added feature called Custom Data Connectors.  There was an announcement last month which now opens up the world for developers to write custom connectors right in Visual Studio.

    The full June release is described in the video below:

    For the full blog write up hit this link.

    For more details about the custom data connector follow these links for more resources:

    Data Connectors GitHub repo

    Data Connector technical reference

    M Library functions

    M Language specification

  • Power BI May 2017 Release

    Power BI May 2017 Release

    It’s that exciting time of month again.  Time for another power BI desktop release.  This month here are a couple of good highlights you should check out.

    1. First up enhanced tables with word wrapping in both headers and table rows.  Woot Woot, I have really needed this feature!
    2. Clicking a row in the table will now allow filtering in other visuals.  Similar functionality to the matrix features that we already saw last month.
    3. Enhanced URL links for tables.  This on is interesting.  If you are an ad agency you should really pay attention to this one.  This allows you to embed a mailto command directly in a table.  Then you can click the link to send an email to someone directly from Power BI, perfect for following with a sales leads.
    4. Combo charts label density.  This feature is one I can really stand behind. Frankly, I didn’t know I needed it, but now that I have seen the light, this will be awesome.

    For the full Power BI Desktop release here is the full announcement.

    If you want to watch the full video for the release you can see the full video below:

    Download the latest release of Power BI Desktop here.

  • Power BI April 2017 Release

    Power BI April 2017 Release

    With another month comes another exciting release of PowerBI desktop.  This month we have a number of really interesting features releases.  One of the more interesting feature releases you should definitely check out is the Add Column by Example.  I have seen a demo of this feature and can definitely see the potential for speeding up the data cleansing process in the query editor.  I’ve also included the YouTube video below for this feature.

    To read about the full release from Microsoft hit the link here.

    The April 2017 Update:


    Check out the Add Column by Example demo:

    For other great Power BI videos click the image below:

    PBI Videos

  • Power BI March 2017 Release

    Power BI March 2017 Release

    This month it is a major game changer.  PowerBI has introduced the ability to change the color theme of your Power BI reports.  What does this mean for you?  Well, this means hours of time saved.  Previously when you needed to style a report you would need to click on every visual and change the colors.  This is useful when you have a specific theme or product you want to match colors with.  Now all this can be done with a couple clicks for all visuals across the entire report.  Wow!!!

    Additionally, the ability to generate a theme is awesome but you also will need a tool to help you create a color theme.  In response for this need I have created a Color Theme Generator that will aid you in the creation of making color themes.  To read the tutorial on color themes visit this link.

    March 2017 Power BI Desktop release:

    Importing Color Themes:

    For the full March 2017 release follow this link.

  • Power BI February 2017 Release

    Power BI February 2017 Release

    The long awaited PowerBI Desktop release is here.  I’d like to point out a couple of key features that will help you improve your reports.  First, the addition of word wrap on row headers.  The tutorial for working with row headers is found here.  A second feature that will help beginner users is the addition of two new Quick Calcs.  The Quick Calcs allow you run calculations within a visual without the need to write a DAX measure.  It’s nice to see some of the more common calculations being added as standard features.

    For the full release notes from Microsoft follow this link.

    Quick Calculations:

    For other great Power BI videos click the image below:

    PBI Videos

  • Welcome to my Site

    Welcome to PowerBI.tips, this blog is dedicated to learning and developing visualizations for PowerBI desktop, PowerBI.com and for data modeling in excel.

    I’ve been a PowerBI user for almost two years.  My background is in mechanical engineering, and I’ve been migrating into a data analytics and data scientist role.  As a mechanical engineer part of your job is to develop a test, collect data, and summarize the results. In the collecting data phase engineers can collect gigs of data from sensors.  Thus, there is a need to digest that data into what I would call an executive summary.  I need to convey what I tested and did my device or product pass the tests.

    In the past I’ve used access to collect data and summarize. Then using connections or data extracts to excel to produce charts or summary visualizations.

    All of which brought me to where I am today.  I’ve had the technical know how of databases and excel but I lacked the complete tool to build repeatable data to visualization products. This is the perfect fit for PowerBI.

    This is why I’ve decided to share what I’ve learned about data and data visualization to help you get up to speed with the amazing PowerBI tools.

    Hope you enjoy my blog, Mike