
Measures – Dynamic CAGR Calculation in DAX
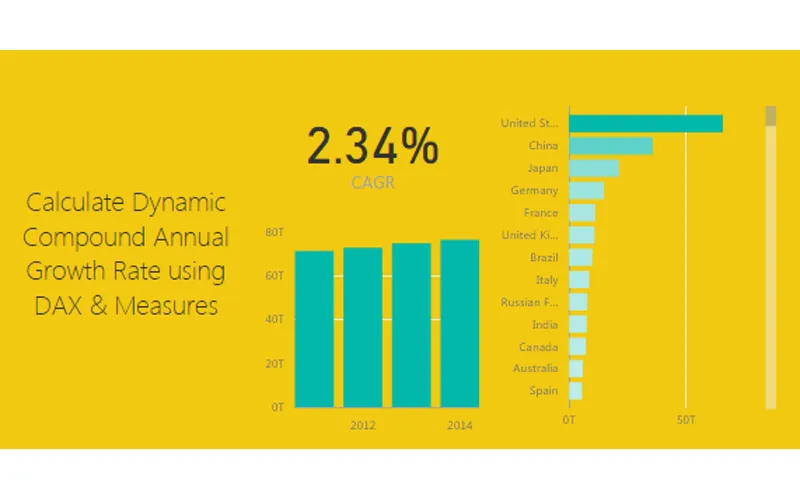
How do I calculate dynamic CAGR in DAX?
TL;DR. Build Beginning Value, Ending Value, and # of Years with CALCULATE, MIN, and MAX on Year. CAGR = ([Ending Value]/[Beginning Value])^(1/[# of Years])-1. Format as Percentage. Page selections update the CAGR for the filtered data.
What does dynamic CAGR mean here?
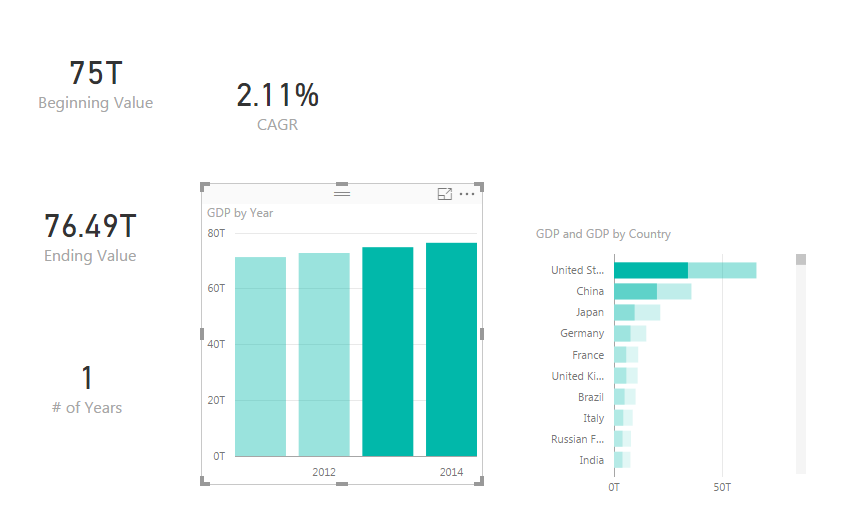
As you select different items (for example on a bar chart), the CAGR recalculates for only the selected data, not a static whole-table number.
What is the CAGR formula used in this post?
CAGR = (Ending Value / Beginning Value)^(1 / # of Years) - 1 (Investopedia reference in the article).
Which supporting measures do I create first?
Beginning Value (SUM of GDP at MIN Year), Ending Value (SUM at MAX Year), and # of Years (MAX Year minus MIN Year).
How is the final CAGR measure written?
CAGR = ([Ending Value]/[Beginning Value])^(1/[# of Years])-1, then set Format to Percentage on the Modeling ribbon. Optional: wrap with IFERROR(…, 0) when a single year would fail.
Can I put the whole formula in one measure?
Yes. The Pro Tip shows one large measure that inlines the CALCULATE / MIN / MAX logic instead of three helper measures.
Related: Measures – Month to Month Percent Change, Measures – Year Over Year Percent Change, Dynamic Percent Change using DAX, Using Variables within DAX, and Creating A DAX Calendar.
This tutorial walks through calculating a dynamic Compound Annual Growth Rate (CAGR). By dynamic we mean as you select different items on a bar chart for example the CAGR calculation will update to reveal the CAGR calculation only for the selected data.
Loading the Data
Let’s start off by getting some data. For this tutorial we will gather data from World Bank found here. To make this process less about acquiring data and more about calculating the CAGR, below is the Query Editor code you can copy and paste directly into the Advanced Editor.
let
    Source = Excel.Workbook(
        Web.Contents(
            "https://powerbitips03.blob.core.windows.net/blobpowerbitips03/wp-content/uploads/2017/11/Worldbank-DataSet.xlsx"
        ),
        null,
        true
    ),
    EconomicData_Table = Source{[Item = "EconomicData", Kind = "Table"]}[Data],
    #"Changed Type" = Table.TransformColumnTypes(
        EconomicData_Table,
        {
            {"Country Name", type text},
            {"Country Code", type text},
            {"Indicator Name", type text},
            {"Indicator Code", type text},
            {"1960", type number},
            {"1961", type number},
            {"1962", type number},
            {"1963", type number},
            {"1964", type number},
            {"1965", type number},
            {"1966", type number},
            {"1967", type number},
            {"1968", type number},
            {"1969", type number},
            {"1970", type number},
            {"1971", type number},
            {"1972", type number},
            {"1973", type number},
            {"1974", type number},
            {"1975", type number},
            {"1976", type number},
            {"1977", type number},
            {"1978", type number},
            {"1979", type number},
            {"1980", type number},
            {"1981", type number},
            {"1982", type number},
            {"1983", type number},
            {"1984", type number},
            {"1985", type number},
            {"1986", type number},
            {"1987", type number},
            {"1988", type number},
            {"1989", type number},
            {"1990", type number},
            {"1991", type number},
            {"1992", type number},
            {"1993", type number},
            {"1994", type number},
            {"1995", type number},
            {"1996", type number},
            {"1997", type number},
            {"1998", type number},
            {"1999", type number},
            {"2000", type number},
            {"2001", type number},
            {"2002", type number},
            {"2003", type number},
            {"2004", type number},
            {"2005", type number},
            {"2006", type number},
            {"2007", type number},
            {"2008", type number},
            {"2009", type number},
            {"2010", type number},
            {"2011", type number},
            {"2012", type number},
            {"2013", type number},
            {"2014", type number},
            {"2015", type number},
            {"2016", type number},
            {"2017", type any}
        }
    ),
    #"Removed Other Columns" = Table.SelectColumns(
        #"Changed Type", {"Country Name", "2011", "2012", "2013", "2014", "2015", "2016"}
    ),
    #"Filtered Rows" = Table.SelectRows(
        #"Removed Other Columns",
        each
            [2011] <> null
            and [2012] <> null
            and [2013] <> null
            and [2014] <> null
            and [2015] <> null
            and [2016] <> null
    ),
    #"Unpivoted Other Columns" = Table.UnpivotOtherColumns(#"Filtered Rows", {"Country Name"}, "Attribute", "Value"),
    #"Renamed Columns" = Table.RenameColumns(
        #"Unpivoted Other Columns", {{"Country Name", "Country"}, {"Attribute", "Year"}, {"Value", "GDP"}}
    )
in
    #"Renamed Columns"
Note: The tutorial on how to copy and paste the code into the Query Editor is located here.
Paste the code above into the advance editor. Click Done to load the query into the Query Editor. Rename the Query to World GDP and then on the home ribbon click Close & Apply.
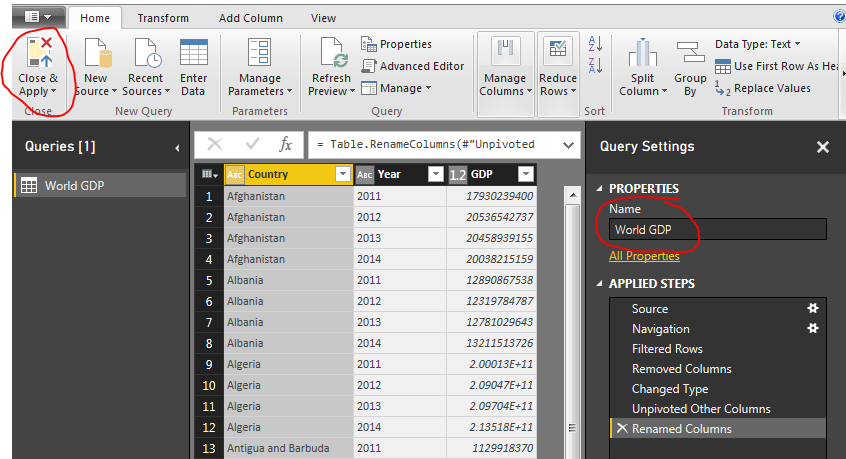
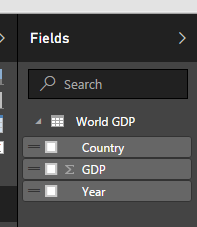
Loading the query loads the following columns into the fields bar on the right hand side of the screen.
Understanding the CAGR Formula
Next we will build a number of measures that will calculate the required variables to be used in our CAGR calculation. For reference the CAGR calculation is as follows (found from investopedia.com):
CAGR = (Ending Value / Beginning Value)^(1 / # of Years) - 1
Creating the DAX Measures
For each variable on the right of the equation we will create one measure: one for Ending Value, Beginning Value and # of Years. On the Home ribbon click the button labeled New Measure. Enter the following equation for the beginning value:
Beginning Value = CALCULATE(SUM('World GDP'[GDP]),FILTER('World GDP','World GDP'[Year]=MIN('World GDP'[Year])))This equation totals all the items in the table called World GDP in the column labeled GDP. This calculation will change based on the selections in the page view.
Add two more measures for Ending Value and # of years:
Ending Value = CALCULATE(SUM('World GDP'[GDP]),FILTER('World GDP','World GDP'[Year]=MAX('World GDP'[Year])))# of Years = (MAX('World GDP'[Year])-MIN('World GDP'[Year]))Your fields list should now look like the following:
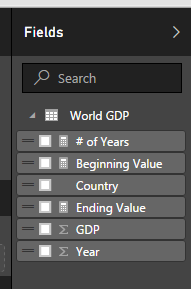
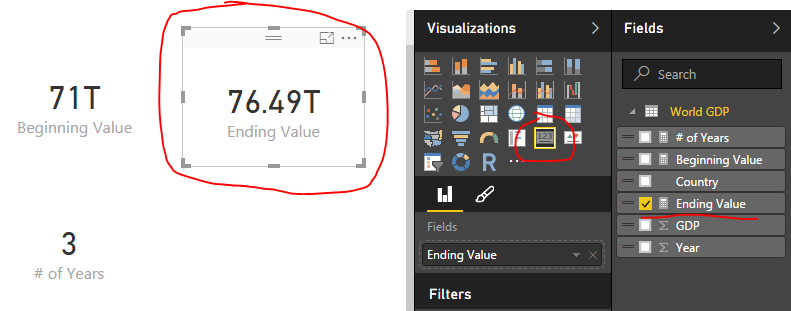
Next add a Card visual for each new measure we added. A measure is illustrated by the little calculator image next to the measure.
Building the CAGR Measure
Combining all the previous measures we will now calculate the CAGR value. Add one final measure and add the following equation to calculate CAGR:
CAGR = ([Ending Value]/[Beginning Value])^(1/[# of Years])-1This calculation uses the prior three measures we created. Add the CAGR as a card visual to the page.
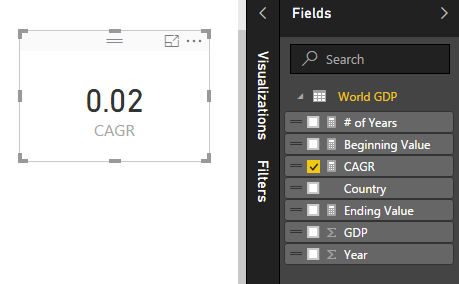
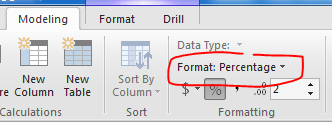
Notice how the value of this measure is listed as a decimal, which isn’t very useful. To change this to a percentage click on the measure CAGR item in the Fields list. Then on the Modeling ribbon change the format from General to Percentage.
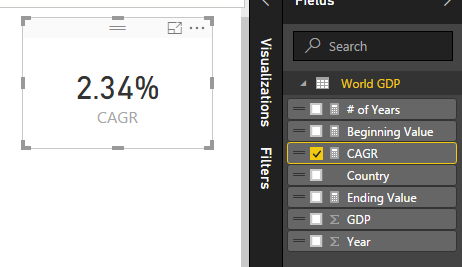
This changes the card visual to now be in a percentage format.
Adding Interactive Visuals
Now you can add some fun visuals to the page and depending on what is selected the CAGR will change depending on the selected values.
Pro Tip: To calculate the CAGR you can alternatively compute the entire calculation into one large measure like so:
CAGR = ( CALCULATE(SUM('World GDP'[GDP]),FILTER('World GDP','World GDP'[Year]=MAX('World GDP'[Year]))) / CALCULATE(SUM('World GDP'[GDP]),FILTER('World GDP','World GDP'[Year]=MIN('World GDP'[Year]))) ) ^ (1/ (MAX('World GDP'[Year])-MIN('World GDP'[Year])) )-1A final recommendation is to wrap the CAGR calculation in an IFERROR function to make sure if one year is selected the measure doesn’t fail. This returns a 0 if there is a calculation error of the equation. Documentation on IFERROR is found here.
CAGR = IFERROR( ([Ending Value]/[Beginning Value])^(1/[# of Years])-1 , 0)To finish out the tutorial you can add the following visuals:
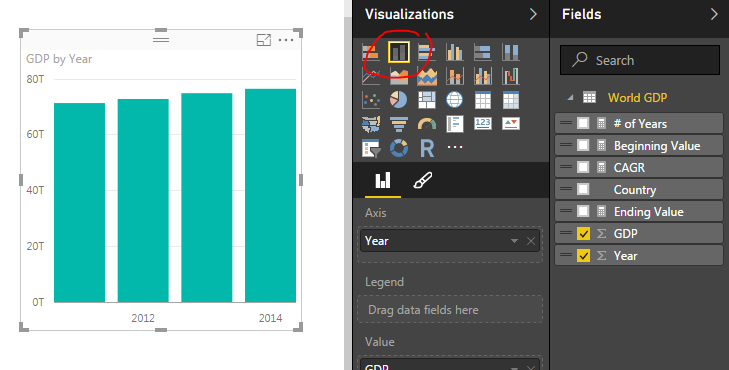
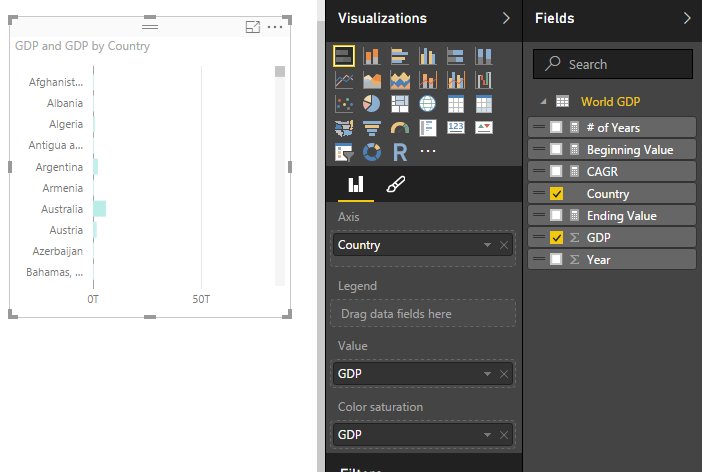
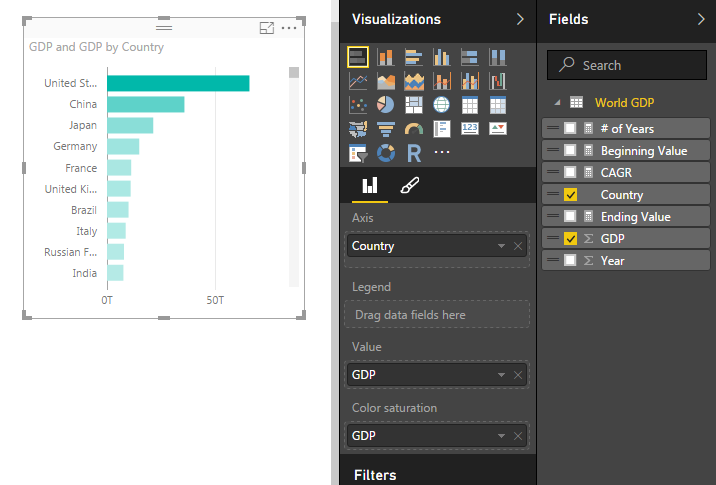
Note: You can sort the items in the stacked bar chart by selecting the ellipsis (the three dots in the upper right hand corner) and then selecting Sort By and clicking GDP.
Finally select different items in the GDP by Year chart or the GDP by Country chart. To select more than one item in the bar charts you have hold shift and left mouse click the multiple items. Notice how all the measures change.
Thanks for following along.
Materials Used
- Power BI Desktop (I’m using the April 2016 version, 2.34.4372.322) download the latest version from Microsoft Here.
- Page from World Bank: http://data.worldbank.org/indicator/NY.GDP.MKTP.CD