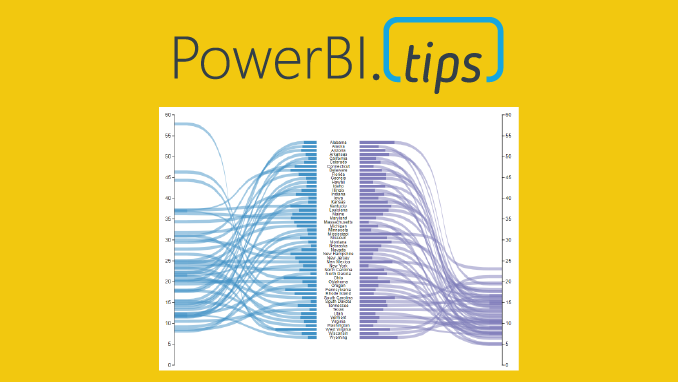
Welcome to another installment of building custom visuals with the Charts tool from PowerBI.Tips. In this edition we make the following custom visual.
Custom Ribbon Chart
This chart comes to us from the sharp mind of Nick Snapp, Check out is work on Charts.PowerBI.Tips within our custom visual gallery. This chart combines the ability to see both the relative size of values between states as well as distributions of data with adjacent number lines. Pretty cool don’t you think?
Below is the walk through video on how to build this custom chart.
If you like the content from PowerBI.Tips please follow us on all the social outlets. Stay up to date on all the latest features and free tutorials. Subscribe to our YouTube Channel. Or follow us on the social channels, Twitter and LinkedIn where we will post all the announcements for new tutorials and content.
Introducing our PowerBI.tips SWAG store. Check out all the fun PowerBI.tips clothing and products:
This year the Microsoft Business Application Summit (MBAS) was held in Atlanta Georgia. Despite some travel snafu’s (3 rebooking’s and 9 delays), we made it into Atlanta late the night before the preconference sessions. Which was good, because we were presenting one!
(A special thanks to Adam Saxton (Guy in a Cube) who went way out of his way to pick up a bunch of materials we needed for the preconference. If you don’t follow Adam and his awesome Power BI channel, be sure to check it out -> YouTube Link Guy in a Cube)
Our “Data visualization with Power BI” preconference session was packed with 180 people and we had a fantastic time showing people how to build no-code custom visuals with the new “Charts” http://charts.powerbi.tips/ (Gallery here: http://gallery.powerbi.tips/) tool based on the Microsoft Research team that developed Charticulator, how to create themes and layouts and many other tips and tricks. The good news for all our followers on powerbi.tips is that we have that content created now and we will be sharing that over time in the form of blogs and other training materials posted to the site.
We each individually had the opportunity to spend some quality Q&A time in the Community Lounge with some great one on one time with many of the conference goers. And we finished off the whirlwind tour with the final session time of the conference where we presented the “Microsoft Power BI: Data visualization best practices”. Here is our session from the conference.
Here is a detailed video of the creation of the custom ribbon chart at the end of the session:
The best part of any conference is the people you meet. The
social aspect and meeting new people are one of the most important aspects of
any conference event. We hope all the attendees at MBAS made some great new
connections, we know we did!
It is an exciting time to be in the business of data, and the MBAS conference has merged in Dynamics with the Power Platform tools. The keynote by James Phillips brings to light Microsoft’s next steps in the evolution of how these tools are transforming businesses, and the future is bright indeed. Be sure to check out his Keynote
Power BI is still on a rocket ship of greatness. The roadmap is exciting, the community is growing bigger and better every day, and more and more businesses are leveraging the tool to change the way their users interact with data on a daily basis.
Our Favorites:
Of course, our favorites all revolve around the tool we love, Power BI! An absolute must watch video is the road map session that outlines the near term features that are going to amaze you
We’re huge fans of Power BI dataflows, so of course we recommend those sessions. Here is a Great Overview and explanation dataflows.
Want more information on dataflows, check out these sessions from the conference.
Manage Consent
To provide the best experiences, we use technologies like cookies to store and/or access device information. Consenting to these technologies will allow us to process data such as browsing behavior or unique IDs on this site. Not consenting or withdrawing consent, may adversely affect certain features and functions.
Functional
Always active
The technical storage or access is strictly necessary for the legitimate purpose of enabling the use of a specific service explicitly requested by the subscriber or user, or for the sole purpose of carrying out the transmission of a communication over an electronic communications network.
Preferences
The technical storage or access is necessary for the legitimate purpose of storing preferences that are not requested by the subscriber or user.
Statistics
The technical storage or access that is used exclusively for statistical purposes.The technical storage or access that is used exclusively for anonymous statistical purposes. Without a subpoena, voluntary compliance on the part of your Internet Service Provider, or additional records from a third party, information stored or retrieved for this purpose alone cannot usually be used to identify you.
Marketing
The technical storage or access is required to create user profiles to send advertising, or to track the user on a website or across several websites for similar marketing purposes.