
Feb 4, 2020
Milwaukee Brew City PUG – Jan 2020
Here we are, jumping in to 2020. This Month PowerBI.Tips is kicking off and sponsoring the next year of Power BI user groups (PUGs) for Milwaukee. If...
Page 19 of 24
Feb 4, 2020
Here we are, jumping in to 2020. This Month PowerBI.Tips is kicking off and sponsoring the next year of Power BI user groups (PUGs) for Milwaukee. If...
Feb 4, 2020
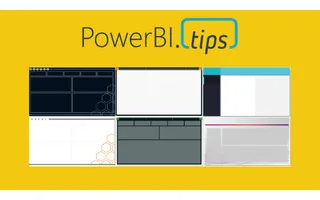
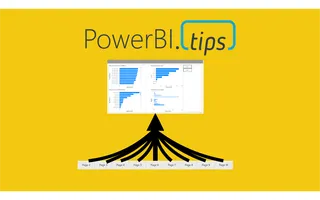
Recently I had the privilege of working with Microsoft doing a Webinar on layouts. One thing we are passionate about at PowerBI.Tips is good looking r...
Jan 29, 2020
If you’re like me, building a data model in Power BI is an iterative process. Sometimes, you try out different ways of writing measures before you hi...
Jan 22, 2020
This month we did a webinar with the Microsoft team on how to build different custom visuals in Charts.PowerBI.Tips a...
Jan 16, 2020
This article examines using the advanced editor in Power Query to better handle when things go wrong. It will also allow custom actions to be triggere...
Jan 14, 2020
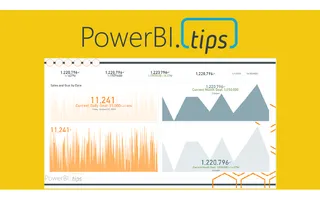
KPIs are a key visualization type used to convey high level metrics to the end users. They provide an at-a-glance metric that allows business users to...
Dec 23, 2019
PowerBI.tips is excited to announce our new tool to help you build the best looking reports, Scrims. We’ve...
Dec 21, 2019
Thanks for your interest in our product Scrims. For more details on what is a scrim click this link to Learn More. **Download** a scrim from the prod...
Dec 6, 2019
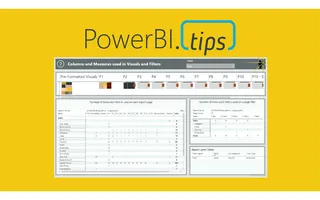
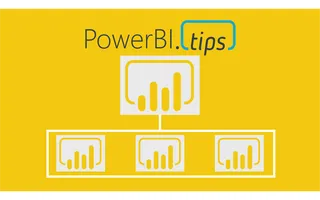
In some recent conversations the notion of minimizing the number of required visuals came up as a topic. While I know from talking with the Microsoft...
Nov 27, 2019
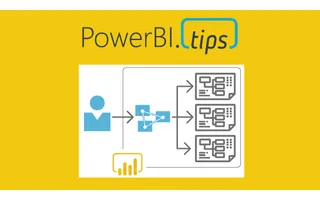
Over the course of time Power BI has come to encompass a wide variety of technologies and tools. One such product that has been integrated into the su...

Nov 20, 2019
For each visual in Power BI Desktop there is a button called Focus Mode. This feature highlights a single visual. While this can be helpful, it does r...
Nov 12, 2019
We do a ton of Layouts here at powerbi.tips and with the introduction of the new visual grouping feature I wa...

Nov 9, 2019
This post will walk through how to pull an estimated household income from a US address. It will be completed all in the Power Query Editor. We will c...
Nov 5, 2019
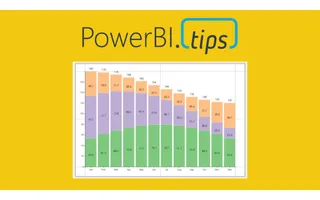
For this week we are building a stacked bar chart on https://Charts.PowerBI.Tips. While you can build this type of char...
Oct 30, 2019
This month at our Power BI User group in Milwaukee Seth and myself walk through some of the basics of Power BI. We digest how can we leverage Power BI...
Oct 29, 2019
Power BI requires a gateway for refreshing on premises data sources. There are a myriad of different data sources that you can create and two differen...
Oct 23, 2019
In October of 2019 Power BI released a new file type, PBIDS. The Power BI Desktop Source (PBIDS) file is a JSON object file that aids users connecting...

Oct 22, 2019
This post will walk through how to pull daily stock price from Yahoo! Finance, then transform the data using a technique called a query branch. It wil...
Oct 15, 2019
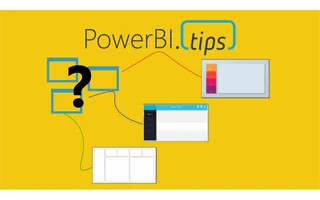
As a user that builds Power BI reports, did you know the different technologies that come into play when you interact with the tool? This is one of th...
Oct 8, 2019
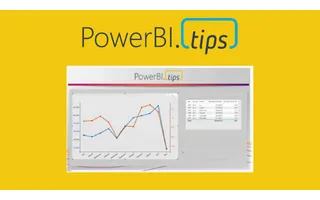
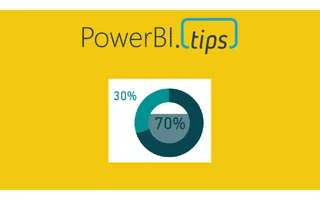
We are starting today off with a fun chart. We will be making a filled donut chart. Typically, I don’t use donut charts but in this case I think we ha...
Oct 2, 2019
As report authors we sometimes get caught up in how easy it is to create a report and provide value to the business. Each report is an opportunity to...
Sep 30, 2019
This post will answer how to sort a measure that returns text values to a custom order, without affecting other columns. It will utilize the DAX funct...
Sep 26, 2019
# Grouping with Style The release of grouping visuals was an extremely welcomed feature. As one who builds lots of reports grouping elements together...
Sep 17, 2019
I recently encountered a really frustrating experience related to a set of reports seeming to not update after some data source changes. I’d done this...