
Oct 12, 2017
Power BI World Tour 2017 – Chicago – Intro to DAX
DAX (Database Access Expressions) can be quite complex. It is essential to being able to appropriately manipulate the Power BI data model for the vis...
Page 22 of 24
Oct 12, 2017
DAX (Database Access Expressions) can be quite complex. It is essential to being able to appropriately manipulate the Power BI data model for the vis...
Oct 11, 2017
To everyone who was able to attend the Power BI World Tour 2017, Thank you! It has been a pleasure presenting my favorite tips and trips. This post...
Sep 8, 2017
September is here and there is a new update for Power BI desktop! I’m so excited for this month’s update as there are many solid features. One of th...

Aug 14, 2017
I’ve been using Power BI since it was released back in 2015, and I’ve found that when talking with other PowerBI users there is always a little confus...
Aug 11, 2017
I love these updates, it’s like Christmas comes every month!! This month we get a ton of really great features, I for one am super pumped to get into...
Jul 25, 2017
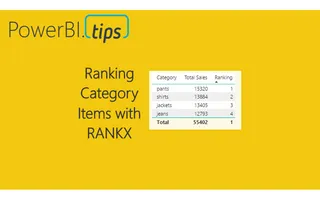
In many reports we produce we often need a method to score or rank data. For example, we may need to list the sales totals for the sales team and ran...
Jul 5, 2017
For those of you who work in supply chain management this tutorial will be right up your alley. In my previous job position I had a lot of interactio...
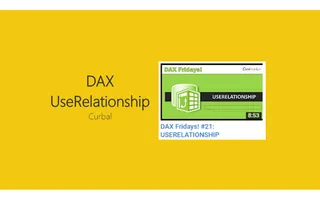
Jul 3, 2017
Here is another great tutorial from Curbal. This tutorial teaches you how to use the DAX function UserRelationship. This is important when your deal...

Jun 13, 2017
This year I had the wonderful privilege to attend the Microsoft Data Insights summit for 2017 as a speaker. My topic was the Top Ten Tutorials from P...
Jun 10, 2017
This month we have a big release for Power BI Desktop and for the Power BI service. There are a number of great new features. For the everyday user...
May 5, 2017
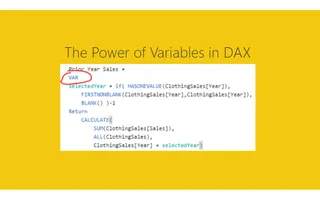
Every so often you find a hidden gem, something so valuable, just hiding there in plain sight. Recently, I found out that I LOVE the using Variables...
May 3, 2017
It’s that exciting time of month again. Time for another power BI desktop release. This month here are a couple of good highlights you should check...
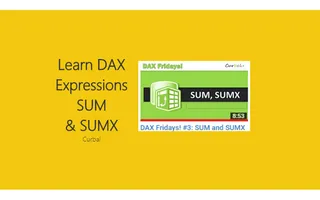
Apr 6, 2017
Learn how to use SUM() and SUMX() with this great video from Curbal. As you become more familiar with PowerBI you will increase your understanding of...

Apr 5, 2017
This video talks about how to create custom links that apply report level filters. This is super cool and provides a ton of wide flexibility when bui...
Apr 4, 2017
With another month comes another exciting release of PowerBI desktop. This month we have a number of really interesting features releases. One of th...

Mar 28, 2017
Here is a super helpful video from Guy in a Cube about how to have multiple logins using Google Chrome. Often I find my self juggling between a work...
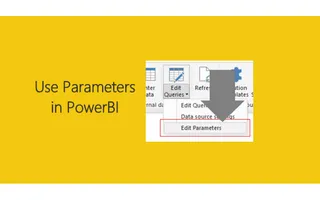
Mar 21, 2017
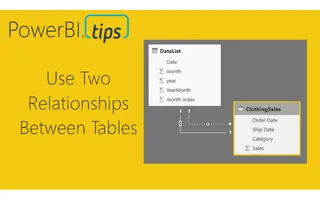
This week I had a number of team members tell me how difficult it was to share a PBIX file and the corresponding data between team members. The depar...

Mar 6, 2017
March is an exciting month, and with this release of Power BI we have been given some long asked for features. One such feature is the ability to impo...
Mar 5, 2017
This month it is a major game changer. PowerBI has introduced the ability to change the color theme of your Power BI reports. What does this mean fo...

Feb 28, 2017
For a while now I have been longing to spend more time learning all the ins and out of Power BI embedded. From the line of work that I do, I can see...

Feb 21, 2017
For those of you who are following my tutorials, you are most likely to understand that each tutorial comes with it’s own data source. This has been...
Feb 16, 2017
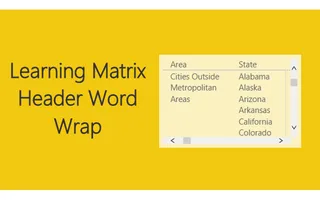
Power BI has been an continually evolving tool over the last year. The Matrix visual is powerful and mimics much of the functionality of a Pivot Tabl...
Feb 7, 2017
The long awaited PowerBI Desktop release is here. I’d like to point out a couple of key features that will help you improve your reports. First, the...

Dec 23, 2016
This past week I was talking with the big guy up north, jolly old fella, and the discussion came up about his toy production levels. Santa was compla...