Report Visualization Tips
Scale a Visual
For each visual in Power BI Desktop there is a button called Focus Mode. This feature highlights a single visual. While this can be helpful, it does remove the ability to change or adjust the […]
For each visual in Power BI Desktop there is a button called Focus Mode. This feature highlights a single visual. While this can be helpful, it does remove the ability to change or adjust the […]
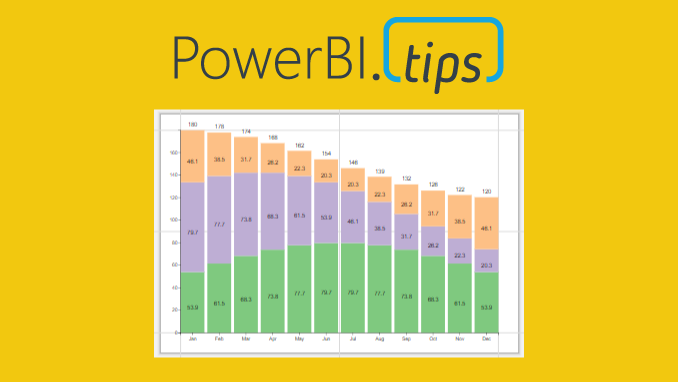
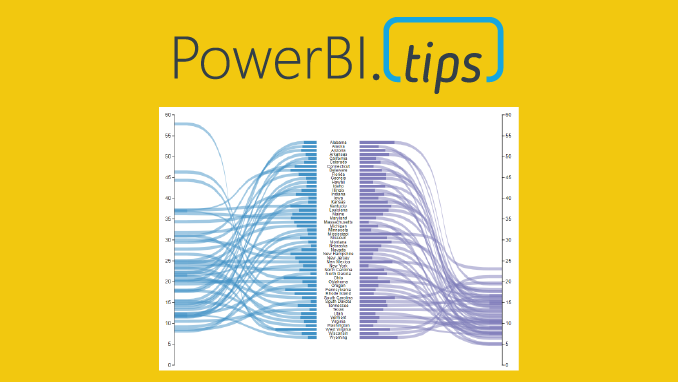
For this week we are building a stacked bar chart on https://Charts.PowerBI.Tips. While you can build this type of chart within Power BI Desktop this video is more of an example showing how you can […]
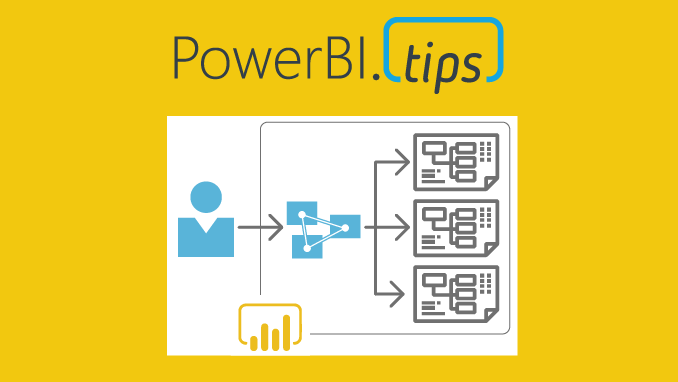
This month at our Power BI User group in Milwaukee Seth and myself walk through some of the basics of Power BI. We digest how can we leverage Power BI to Act like the business, […]
In October of 2019 Power BI released a new file type, PBIDS. The Power BI Desktop Source (PBIDS) file is a JSON object file that aids users connecting to data sources. In true PowerBI.Tips fashion […]
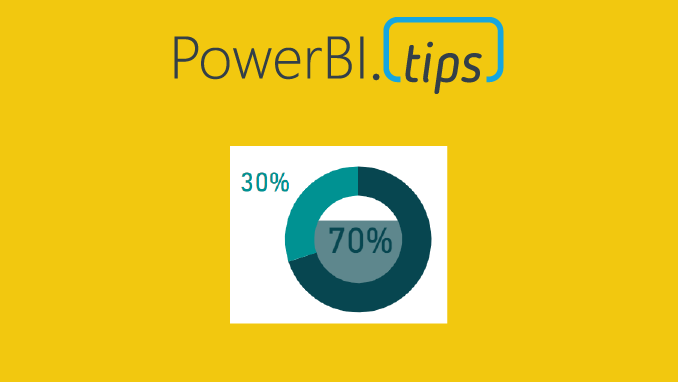
We are starting today off with a fun chart. We will be making a filled donut chart. Typically, I don’t use donut charts but in this case I think we have a good reason, and […]
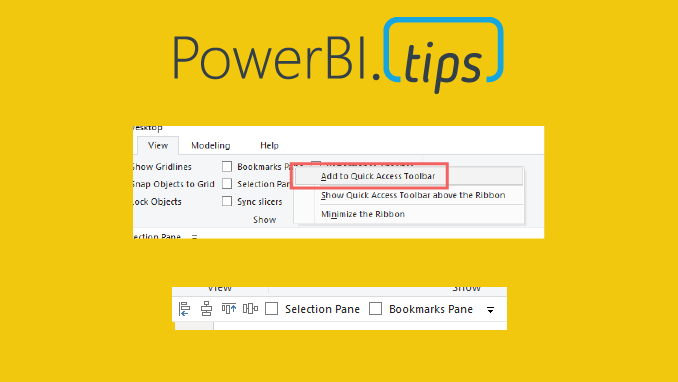
Grouping with Style The release of grouping visuals was an extremely welcomed feature. As one who builds lots of reports grouping elements together is essential to stay organized and to increase report building speed. Since […]
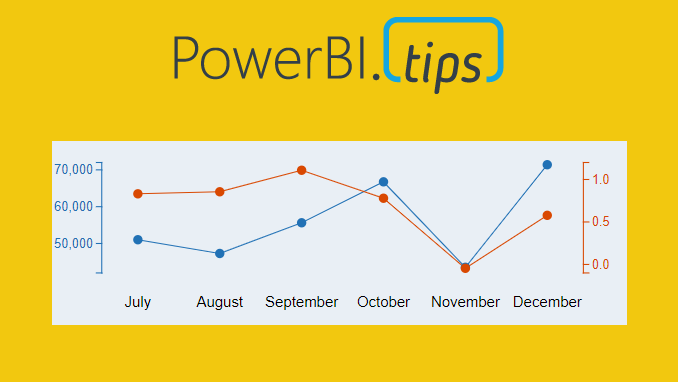
Ever need two different scales on the Y-Axis of a line chart? If so, then this tutorial is for you. While creating a dual y-axis line chart is pretty common in excel, it is not […]
I am just bursting with excitement!! This month the amazing Power BI team has yet again come out with a great new feature, Icon sets. In addition to this you can enhance these icon sets […]
I’m a lazy engineer. Let me qualify my statement. In lazy I mean I like to find the path of least resistance, the shortest distance between two points. Everyday I challenge myself to be lazy, […]
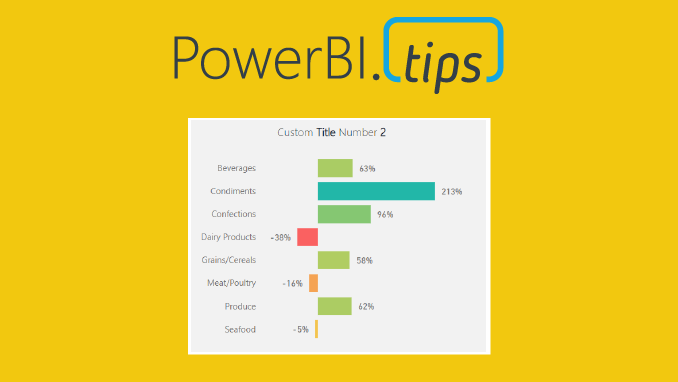
Welcome to another installment of building custom visuals with the Charts tool from PowerBI.Tips. In this edition we make the following custom visual. This chart comes to us from the sharp mind of Nick Snapp, […]
Copyright © 2024 | MH Magazine WordPress Theme by MH Themes