I am just bursting with excitement!! This month the amazing Power BI team has yet again come out with a great new feature, Icon sets. In addition to this you can enhance these icon sets by adding your own custom icons to your Power BI reports. Woo Hoo….
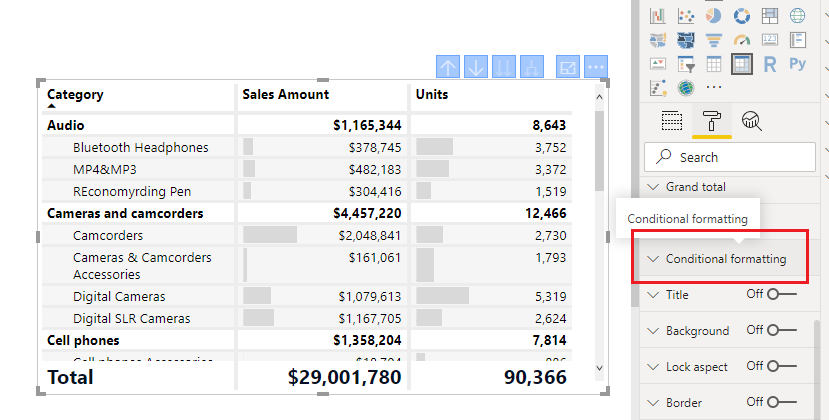
So what does this mean? Well, now you have a new Conditional Formatting box found in the settings of the Table and the Matrix properties. To use a built in Icon from Power BI. Create either a table or a Matrix visual with some data.
Select the visual and adjust it’s properties by clicking on the Paint Roller and opening the Conditional Formatting window.
Scroll down until you see the toggle button for Icons. Turn the Icons On.
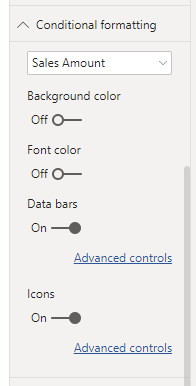
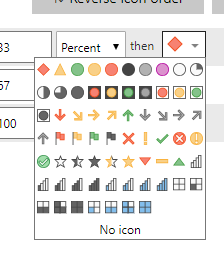
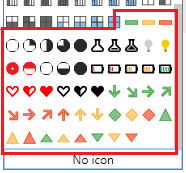
Click on the Advanced Controls to set the properties of the icons based on the data properties. This type of dialog box should look familiar as it is similar to the previous boxes for conditional formatting. Opening this window shows Icons for each Rule in the list. To adjust an icon Click on the Drop DownArrow next to the icon you wish to change. There are multiple icons to choose from.
There are limited selections by default, but you can enhance this by adding your own icons with the custom Json theme files. At PowerBI.tips we love our theme files. They make using standard settings so much easier.
Loading the Custom Icons
For starters we have already done the hard work of creating an additional 50 icons for you to use in your reports. Download the Icon Theme File Here
Update: Special thanks to Reid Havens from Havens Consulting for contributing extra icons to this Icon Set.
Unzip the downloaded file to find the PowerBITips Icons v1.json file
Navigate to the Home ribbon in Power BI Desktop
Click on the Switch Theme button
Select the list item Import Theme from the drop down menu
The open file dialog box will open. Select the PowerBITips Icons v1.json file that you downloaded earlier.
Boom, and just like that you have loaded your new icons. Now you can return to the icons for your table or matrix and adjust until your heart is content.
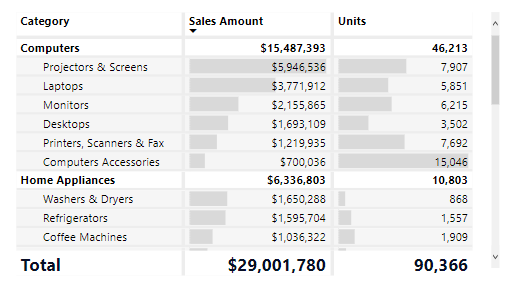
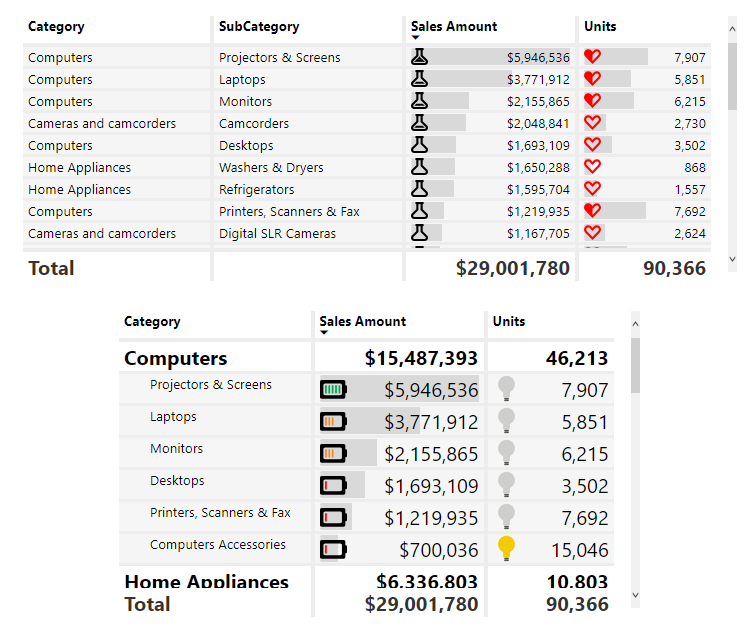
Here is a sample of a table and a matrix with some custom icons applied:
Update 2019/08/06: When publishing the Power BI file to the PowerBI.com service, the fill colors for the shapes need to have a %23 instead of a # (HASH) infront of the HEX codes. Thus, the format should look like fill=’%23FF0000′ instead of fill=’#FF0000′
If you like the content from PowerBI.Tips please follow us on all the social outlets. Stay up to date on all the latest features and free tutorials. Subscribe to our YouTube Channel. Or follow us on the social channels, Twitter and LinkedIn where we will post all the announcements for new tutorials and content.
Introducing our PowerBI.tips SWAG store. Check out all the fun PowerBI.tips clothing and products:
Time and time again when I begin talking with Excel users and ask to see what current reports they are using, they usually show me a table with a mixed bag of columns split by different time ranges. A comparison of month over month, or year over year, mixed in with a few daily totals or cumulative totals all rolled up from values on other tabs to produce their preferred view (or dashboard). Typically, the first approach I take is to describe how we can break up this single table view of things and start looking at the aggregations of these values in easily digestible pieces and slice and dice them in different times ranges. I’ve explained that the goal should be to produce easy to consume visuals for comparison using measures and plotting these out in different ways to glean insights quicker. Most of the time, this works, but other times… it is second best to what the analyst or uber Excel user wants to see… they want to see their numbers, and they want to see them the same way they have them in Excel.
The Challenge:
Recently, I encountered this all
too familiar scenario (Time Ranges in a table/matrix) except this time, I
wanted to see if I could reproduce the output exactly as the end user wanted it
rather than move them in a different direction.
The first group of columns showed
the days in the current week, the second group showed the weeks in the current
month, followed by the Months to date, a year to date column and static columns
of a Goal and Forecast.
I’ll spare you the details of
researching a better way than producing these as individual measures, and suffice to say that I was able to come up
with a solution based on a few calculated columns, a disassociated table, and a
single measure to produce the output I was searching for.
The Solution:
The above screenshot is of the
dynamic matrix that you can download from the link at the end of this blog. As
I developed this solution it came to my attention that there are actually a
couple ways we could build this solution. The first of those would be to have a
time slicer drive all the different time ranges, this would be useful for analyzing
older datasets in the different ranges, but my goal was to create a solution
that follows the “Set it and forget it” train of thought. This solution will
restrict the view of data to never exceed the current day, the neat thing is,
the current day is when you read this blog, not a static point in time. I’ve
pre-loaded data out to the end of 2020, so the sample should continue to work
and change each time the file is opened.
Before we dig into things, I want to convey that the DAX dove a bit deeper into the weeds than I initially expected, and I’ll do my best to describe what I did and why.
The Data
Sample Data
I’ve modified my original solution
to use a sample of Adventure works data that I created, this simple dataset
consists of a column to group things by (ModelName), a date (StartDate) and the
value to aggregate (ListPrice). This solution should cover a wide range of
different use cases so don’t get hung up on the exact columns here. A grouping
column, a date column and a value column are all you need.
Here are the steps I took after creating the dataset and loading it into Excel:
Load Data table from Excel into Power Query, Close & Apply
Create a calculated date table (DAX):
Date =
VAR MinYear = 2018
VAR MaxYear = 2020
RETURN
ADDCOLUMNS (
    FILTER (
        CALENDARAUTO( ),
        AND ( YEAR ( [Date] ) >= MinYear, YEAR ( [Date] ) <= MaxYear )
    ),
    "Calendar Year", YEAR ( [Date] ),
    "Month Name", FORMAT ( [Date], "mmmm" ),
    "Month Number", MONTH ( [Date] ),
    "Weekday", FORMAT ( [Date], "dddd" ),
    "Week Number", WEEKNUM([Date]),
    "Weekday number", WEEKDAY( [Date] ),
    "Quarter", "Q" & TRUNC ( ( MONTH ( [Date] ) - 1 ) / 3 ) + 1
)
Your MinYear / MaxYear will obviously be different, but the core columns for what we need are in this output.
Add Calculated Columns
Now we need to add some filter columns to the date table we just created in order to get the current time frames we care about.
This is our grouping
table, this is the first key element in which we create a series of different
DAX calculated tables to create the different time range groups we want to roll
up our aggregate amount by. In each case, we are pulling all current and
previous years, the current months in this year to date, the current weeks in
the current month and the current days in the week. Then we union those values
together where the “Group” is the top level time range, and the value is the
specific time range values. Then we add an index column so that we can order
the values in the way that we want.
The final output
should look something like this:
This
is the DAX code to create the calculated table. Each “Summarize” creates the time
groups and values rolled up for the particular time range we are interested in.
This is wrapped in the “AddColumns” function to add in a workable index that
allows us to order all the values in the correct order dynamically. Initially,
the static Index column works to sort the Group column, but the dates won’t
sort as Calendar dates so I added the second way to dynamically generate an
index to sort the values by. I retain the original Index value and ensure the
counts returned from the date table align in sequential order. Essentially
retaining the Group/Value index to sort by. Then we wrap all that in “SelectColumns”
so that we can specify the column names. If we didn’t do this, the first column
name would be “Calendar Year”.
Create a relationship between the Date table and the Data Table
This would be on
‘Date’[Date] and ‘Data’[StartDate]
Create our Measures
Now we need to take
the grouping table and merge it with the aggregated value via our measures. In
the Data table we want to create the following measures.
First Measure:
List Price = SUM(Data[ListPrice])

Second Measure:
TimeValue =
    VAR Val =
    SWITCH(SELECTEDVALUE('TimeRange'[Group]),
        "By Year", CALCULATE(TOTALYTD([List Price], 'Date'[Date], FILTER('Date', 'Date'[Date]<= TODAY())), FILTER('Date', 'Date'[Calendar Year] = VALUE(MAX('TimeRange'[Value])))),
        "By Month", CALCULATE(TOTALMTD([List Price], 'Date'[Date], FILTER('Date', 'Date'[Date]<= TODAY())), FILTER('Date', 'Date'[Month Number] = VALUE(MAX('TimeRange'[Value])) && 'Date'[Calendar Year] = YEAR(NOW()))),
        "By Week", CALCULATE(SUM(Data[ListPrice]), FILTER('Date', 'Date'[Week Number] = VALUE(MAX('TimeRange'[Value])) && 'Date'[Calendar Year] = YEAR(NOW()) && 'Date'[Date]<= TODAY())),
        "By Day", CALCULATE(SUM(Data[ListPrice]), FILTER('Date', 'Date'[Date] = DATEVALUE(MAX('TimeRange'[Value])))),
        --Remove SWITCH below if you only want time range
        SWITCH(SELECTEDVALUE(TimeRange[Value]),
           "Goal", [List Price] * 1.2,
           "Forecast", [List Price] * RAND()
            )
    )
    RETURN
        FORMAT(Val, "CURRENCY")
Create the Matrix
Create a Matrix visual
and drop the columns into the following rows and columns:
You will have
something that looks like this:
Dynamic Time Matrix First Level
Are you ready for the magic? Head over to the far right of the visual and click down on the “Expand all down one level in the Hierarchy” button -> and BOOM!
Dynamic Time Matrix Complete
We have our fully functional time range matrix that will adjust dynamically based on the current day. No need to update, change or alter anything! I hope you enjoyed this tip, I certainly was excited to put this solution together. There are so many different ways you could alter this solution, using different dates (swap in fiscal calendar dates), add different final total or percentage columns at the end, my mind keeps coming up with new solutions, and I hope you can use this as well!
You can find the full solution in this PBIX download which includes the sample data set.
If you like the content from PowerBI.Tips, please follow us on all the social outlets to stay up to date on all the latest features and free tutorials. Subscribe to our YouTube Channel, and follow us on Twitter where we will post all the announcements for new tutorials and content. Alternatively, you can catch us on LinkedIn (Seth) LinkedIn (Mike) where we will post all the announcements for new tutorials and content.
As always, you’ll find the coolest PowerBI.tips SWAG in our store. Check out all the fun PowerBI.tips clothing and products:
After many requests, we are now selling out layouts unbranded so that you can use them in all your business applications. Be sure to check out our first offerings and stay tuned for more to come in the future.Learn more about Layouts.
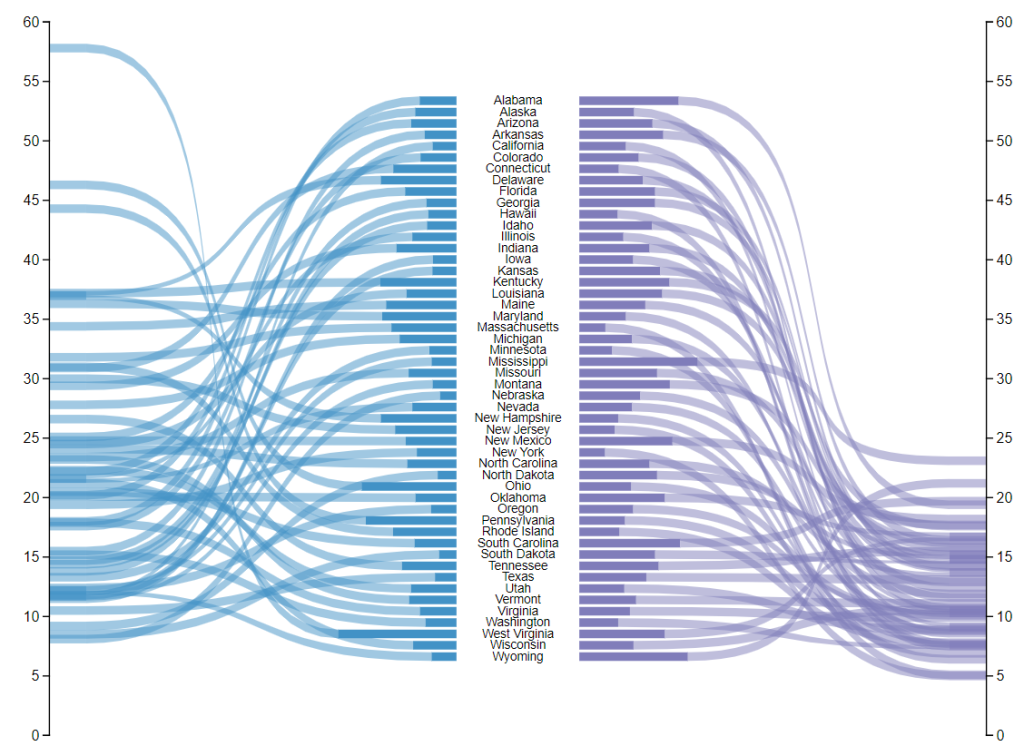
Welcome to another installment of building custom visuals with the Charts tool from PowerBI.Tips. In this edition we make the following custom visual.
Custom Ribbon Chart
This chart comes to us from the sharp mind of Nick Snapp, Check out is work on Charts.PowerBI.Tips within our custom visual gallery. This chart combines the ability to see both the relative size of values between states as well as distributions of data with adjacent number lines. Pretty cool don’t you think?
Below is the walk through video on how to build this custom chart.
If you like the content from PowerBI.Tips please follow us on all the social outlets. Stay up to date on all the latest features and free tutorials. Subscribe to our YouTube Channel. Or follow us on the social channels, Twitter and LinkedIn where we will post all the announcements for new tutorials and content.
Introducing our PowerBI.tips SWAG store. Check out all the fun PowerBI.tips clothing and products:
With the release of the custom visuals building tool Charts.PowerBI.Tips we received a number of comments requesting tutorials on how to build visuals. Ask and you shall receive! Below is a basic tutorial on how to create a Bar chart. Within this tutorial we review a couple of the features of the chart tool and how to use them.
Video Tutorial on Building a Basic Bar Chart Custom Visual
Comment below on other topics you would like to see.
Be sure to follow:
If you like the content from PowerBI.Tips please follow us on all the social outlets to stay up to date on all the latest features and free tutorials. Subscribe on YouTube. Or follow us on the social channels, Twitter and LinkedIn where we will post all the announcements for new tutorials and content.
If you are like me and you like making your reports look extra good with different visual elements you’ve probably come across the issue before where you use shapes or images layered behind a visual. What you have quickly discovered is that an end user can mistakenly click on that background layer and the entire object pops from the background to the foreground. In this quick tutorial, we’ll show you how to STOP this from happening! We learned the technique through a webinar given by Miguel Myers and wanted to make sure we spread the word because it will have a huge impact on how we can build reports!
Be sure to follow:
If you like content from PowerBI.Tips please follow me on all the social outlets to stay up to date on all the latest features and free tutorials. Subscribe to us on YouTube. Or follow me on the social channels, Twitter and catch up with me on LinkedIn where I will post all the announcements for new tutorials and content.
When you design a report, there are a number of things to consider. For example, the types of visuals, the colors used within the visuals, and the location of the visuals. The orientation and alignment of the visuals is a subtle but important aspect of your report build. Doing a good job aligning the items removes distractions from the report page and allows users to engaged with your data story.
To that end, using grids in Power BI desktop has been extremely helpful to me to aid in aligning elements on the page. In this tutorial, I walk through how to use the default Grid settings of Power BI. Additionally, I developed a couple of grids as images that can be used to aid in aligning visuals. Check out the video below to see how you can use Grids, and download the new Grids Layout for your reports.
If you like the content generated from PowerBI.Tips please follow me on all the social outlets to stay up to date on all the latest features and free tutorials. Subscribe to me on YouTube. Or follow me on the social channels, Twitter and LinkedIn where I will post all the announcements for new tutorials and content.
Sometimes when your working on a line chart you want the x-axis to stay centered on a chart. This tutorial will walk you through how to create an X-Axis that will always center it’s self on the graph.
Video Support Material:
The measures discussed within this tutorial are:
Variance All = SUM(Sales[Variance])
The column name Variance is found in the data table called sales. This is just a numerical column.
After summing up all the variances we can calculate the min and max lines.
Const Max Line = [Variance All] * 1.2

Const Min Line = -1 * [Const Max Line]
Finally to calculate the variance to date you can use this filtered measure, which will only produce historical values.
Variance To Date = CALCULATE([Variance All], FILTER('Sales','Sales'[Date] <= EOMONTH(TODAY(),0)))
Thanks for watching our short tutorial. If you like this video please be sure to follow me (Seth Bauer) on Twitter, LinkedIn and be sure to subscribe to the PowerBI.Tips YouTube channel.
This weeks tutorial focuses on the need to control groups of visuals independently. This recently came up in a project where I needed to adjust all the items on the left side of the screen independently from the right side. By using the Edit Interactions button found on the Format ribbon you are able to adjust how different visuals interact with each other. Finally, adding multiple Slicers to the page for controls finishes out the report. I hope you enjoy this weeks tutorial.
Followup:
On the demo page of the report you’ll notice that when various items are selected, some of the non-selected items dis-appear. This is handled by using some formatting within the measures for the visuals. All the measures used in this tutorial are listed below:
Taking an Average of a Numerical Column:
Average of Values =
VAR calc = AVERAGE( Data[Value] )
RETURN if( calc = BLANK(), "", calc )
Making Dynamic Titles off of a list of items in a table:
Title =
VAR title = CONCATENATEX( VALUES( Data[Customer] ), Data[Customer], " & " )
RETURN if( title = BLANK(), "", title )
Producing a sum of values:
Total of Values =
VAR calc = SUM( Data[Value] )
RETURN if( calc = BLANK(), "", calc )
Want the file:
Need a little more help? Like the content from PowerBI.Tips. Please consider purchasing the demo PBIX file to support more great content.
[product id=”17894″ ]
Be sure to follow:
If you like the content generated from PowerBI.Tips please follow me on all the social outlets to stay up to date on all the latest features and free tutorials. Subscribe to me on YouTube. Or follow me on the social channels, Twitter and LinkedIn where I will post all the announcements for new tutorials and content.
Often when working with a Power BI report you will add a slicer that has a “Blank” item in the selection criteria. From a usability standpoint you might not want this item shown. Or maybe you have multiple items in the slicer that you would like to hide from the report consumers. The video, linked below, walks you through why the “Blank” item is shown and how to remove it.
Video on Adding Filters to a Slicer
Additional Slicer Materials
If you want to read more about syncing slicers check the official documentation release from the Microsoft Power BI Blog. This feature was originally released in February of 2018 and was announced here in the Power BI Blog.
Thanks for watching. If you like this content be sure to subscribe and follow along for more content.
Subscribe to me on YouTube. Or follow me on the social channels, Twitter and LinkedIn where I will post all the announcements for new tutorials and content.
This is part 2 in the 3 part series on developing super cool tables using some fancy measures. In part 1 we walked through how to build a table that uses an un-pivoted data source in the Query Editor. This technique allows you to change the types of categorical values in a table. If you missed part 1 and want to get caught up follow this link. Now, continuing with the series, Part 2, we will build the supporting materials (Selector Table, What If Slicers, and measures) for the report.
Once we are done the final product will look like the following:
Part 2… Go.
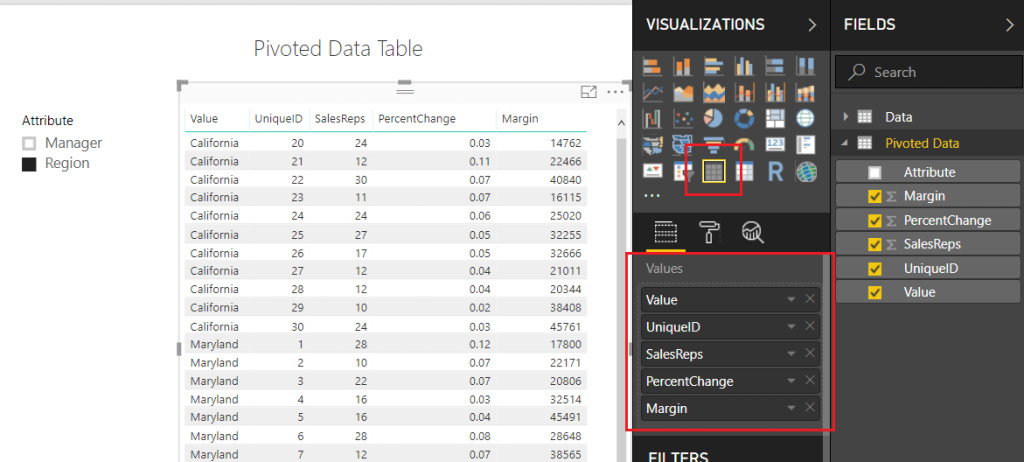
To make sure we are starting off on the correct step. We left off part 1 when we had completed a Pivoted Data Table and included an Attribute Slicer that would allow us to toggle between the Manager and Region Categories. Your table should look like the following diagram: (If you don’t have this you might want to start with Part 1 found here)
Pivoted Data Table
Note: I have also included a Slicer which is used with the Attribute field.
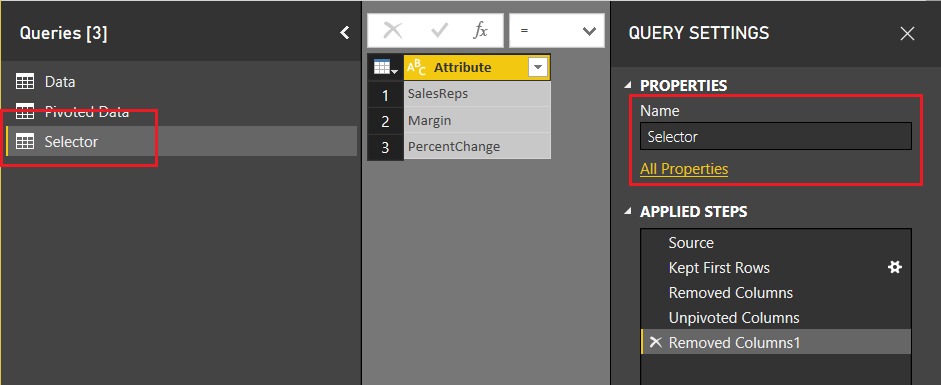
Next, we will need to add a table that will allow us to use the SalesReps, PercentChange, and Margin column headers in our report. On the Home ribbon click Edit Queries, then select New Source on the Home ribbon. In the Get Data window select Blank Query, click Connect to proceed. Open the advanced editor by clicking the Advanced Editor button found on the Home ribbon. Enter the following M code into the Advanced Editor:
let
   Source = #"Pivoted Data",
   #"Kept First Rows" = Table.FirstN(Source,1),
   #"Removed Columns" = Table.RemoveColumns(#"Kept First Rows",{"Attribute", "Value", "UniqueID"}),
   #"Unpivoted Columns" = Table.UnpivotOtherColumns(#"Removed Columns", {}, "Attribute", "Value"),
   #"Removed Columns1" = Table.RemoveColumns(#"Unpivoted Columns",{"Value"})
in
   #"Removed Columns1"
Click Done to close the Advanced Editor. Rename the table to Selector. When you are finished your table should look like the following:
Create Selector Table
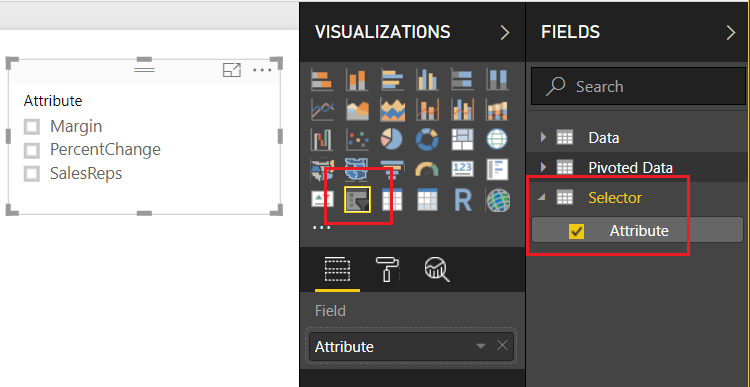
Click Close & Apply on the Home ribbon to close the Query Editor. Add a slicer with the following selections:
Add Selector Attribute Slicer
Now, we want to detect which of the Attributes have been selected from this table. We can accomplish this by creating a measure using the DAX function SELECTEDVALUE. Right Click on the table named Selector and from the drop down select New Measure. Enter the following DAX equation:
rankBy = SELECTEDVALUE(Selector[Attribute])
In addition to the knowledge of which column was selected from the selector table, we will also want to detect to make sure at least one categorical value has been selected. The categorical values we are talking about were generated earlier. The values could be either the Manager or Region values of the Attribute column in the Pivoted Data table. Using the ISFILTERED DAX function enables this section. Add the following measure to the Pivoted Data table:
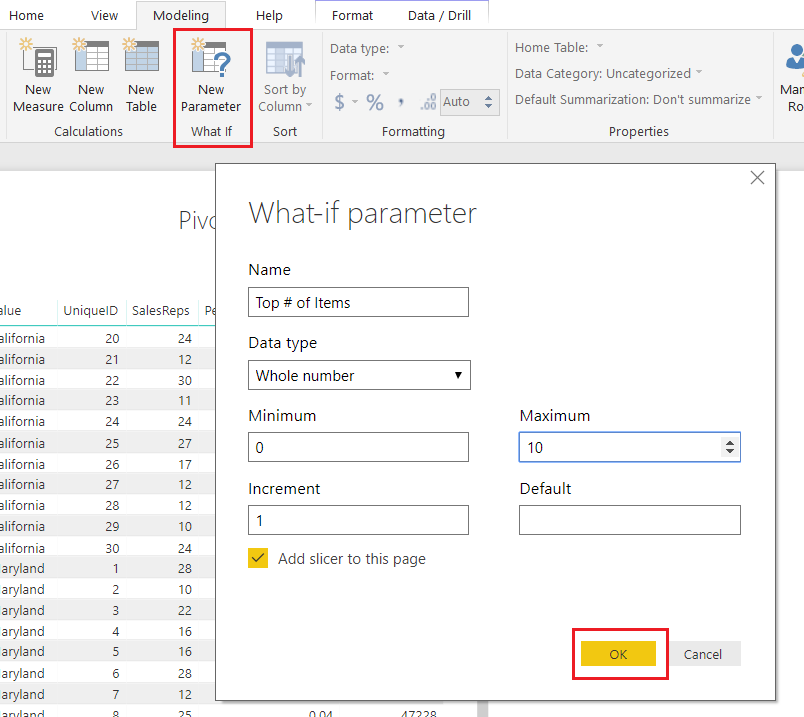
Next, we need to gather some user input in the form of a number from 1 to 10. To input this information we need to produce a What If Parameter. On the Modeling ribbon click New Parameter in the What If section of the ribbon. Enter the following information into the What-if parameter dialog box:
What If Parameter
Note: Don’t forget to change the Name of the parameter.
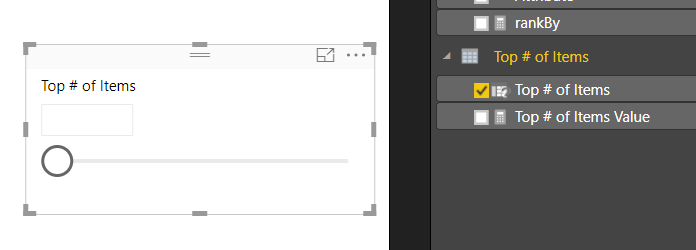
Click OK to proceed. Power BI will automatically produce a measure table, a measure and a slicer on the report page.
Slicer Produced by What-if
Note: By default there is nothing selected in the box. However, you can adjust the slicer and a number will appear within the value box. You can also type in a number between 1 and 10 to the box to adjust the value.
This is where we go crazy with DAX. This portion of DAX is where all the magic happens.
We start off by building our totals measures. Place all these measures in the Pivoted Data table.
Total % Change = MAX( 'Pivoted Data'[PercentChange] )
Total Margin = SUM( 'Pivoted Data'[Margin] )
Total SalesReps = SUM( 'Pivoted Data'[SalesReps] )
These will be used repeatedly in our next group of DAX formulas.
The following measures will produce a calculated ranking for each numerical column. OK, Pause, This part really excites me here because the next few measures are where the magic happens. Pay close attention to what is happening here. Un-Pause, by using the DAX Switch function we can dynamically tell Power BI to adjust which column we want to see ranked by the top items. For example, if we select SalesReps in our attribute slicer. The following measures will automatically rank all the items in the table by the column named SalesReps. Thus, the items with the highest counts of SalesReps will be listed first. When you select Margin, the table will automatically adjust and re-rank the items by the Margin column. This is being done in the switch statement. For each column we are calculating custom rankings and then hiding or replacing values with the Blank() DAX function to not show items we don’t want.
Enter the following three measures into the Pivoted Data Table:
Whew, that was a ton of measures. All the key components are complete now. In part 3 we will clean up our report page and make it shine. I hope you enjoyed this tutorial. Also, follow me on Twitter and Linkedin where I will post all the announcements for new tutorials and content.
Manage Consent
To provide the best experiences, we use technologies like cookies to store and/or access device information. Consenting to these technologies will allow us to process data such as browsing behavior or unique IDs on this site. Not consenting or withdrawing consent, may adversely affect certain features and functions.
Functional
Always active
The technical storage or access is strictly necessary for the legitimate purpose of enabling the use of a specific service explicitly requested by the subscriber or user, or for the sole purpose of carrying out the transmission of a communication over an electronic communications network.
Preferences
The technical storage or access is necessary for the legitimate purpose of storing preferences that are not requested by the subscriber or user.
Statistics
The technical storage or access that is used exclusively for statistical purposes.The technical storage or access that is used exclusively for anonymous statistical purposes. Without a subpoena, voluntary compliance on the part of your Internet Service Provider, or additional records from a third party, information stored or retrieved for this purpose alone cannot usually be used to identify you.
Marketing
The technical storage or access is required to create user profiles to send advertising, or to track the user on a website or across several websites for similar marketing purposes.