
Feb 12, 2026
Central BI & Workspace Strategies - Ep. 501
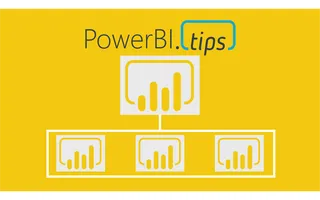
Episode 501 covers the new OneLake Catalog updates, AI's impact on workplace productivity, and strategies for organizing workspaces in Power BI.
Feb 12, 2026
Episode 501 covers the new OneLake Catalog updates, AI's impact on workplace productivity, and strategies for organizing workspaces in Power BI.

Feb 6, 2026
Celebrating 500 episodes and 5 years of the Explicit Measures podcast. Reflecting on the journey, predictions, and what's next for Power BI and AI.

Feb 4, 2026
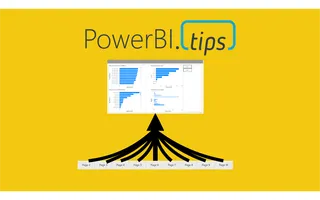
Give the AI instructions, get data, put it here. Build the pattern in different tools and test them all in minutes.

Feb 4, 2026
Mike Carlo and Eugene Meidinger discuss how AI is reshaping the data analyst's toolkit with practical frameworks for adopting AI in your daily workflow.

Feb 4, 2026
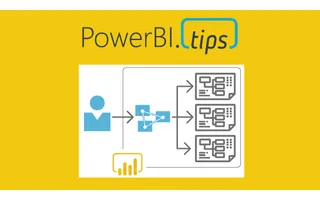
AI is transforming data engineering in two major ways: democratizing who can build data pipelines and creating new skills around trusting and debugging AI systems.

Jan 31, 2026
Armando and I dive deep into AI agents, why natural language might be the last programming language, and how to treat your AI like a new employee.

Jan 28, 2026
Learn how to connect your local VS Code to Microsoft Fabric's remote Jupyter notebooks and Spark engine for a better development experience.

Jul 21, 2025
Tommy and Mike discuss the state of Data Science as it relates to Fabric. Learn from MVPs where you should invest your time with Fabric and Data Science.

Jul 21, 2025
The explicit measures podcast unpacks what DevOps means. It's not software, it's a way of thinking. Matthias is the creator of the beloved TMDL format.

Jul 21, 2025
Alex Powers joins the Explicit Measures podcast to deep dive into optimizing Power Query for maximum performance, covering dataflows Gen 1 vs Gen 2, query folding, staging patterns, and the evolving role of Power Query in Microsoft Fabric.

Jul 30, 2024
Starting a center of excellence (COE) can feel daunting. We face political challenges. This article explores the challenges of a COE and recommendations to handle them.

Jul 26, 2024
Learn how Semantic Link in Microsoft Fabric enables direct access to Power BI semantic models using Python notebooks. Automate tasks, extract data, and streamline your BI workflow.

Apr 29, 2024
Welcome to today’s tutorial where we’ll explore an exciting feature implemented to streamline your background creation process in Power BI. If you’ve...
Feb 27, 2024
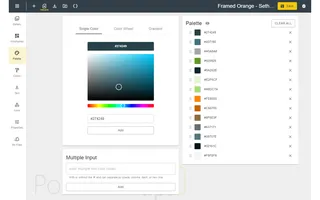
Introduction Welcome to today’s tutorial where we dive into the powerful capabilities of the Power BI Tips+ Theme Generator. In this post, we won’...

Jan 29, 2024
Welcome to today’s tutorial where we’ll explore the Power BI Tips+ Theme Generator and its incredible features designed to streamline your Power BI re...

Jan 18, 2024
In podcast #286 we take the time to review an older video of John Cleese giving a talk about the Creative Process in Management. We thought this would...
Dec 9, 2023
Introducing cutting-edge AI capabilities to simplify the Theme Building experience. We recognize the value of time in the fast-paced realm of analytics.
Oct 15, 2023
The Power BI Tips Theme Generator: Your Ultimate Theming Tool The Power BI Tips Theme Generator is the go-to resource for users aiming to crea...
Oct 4, 2023
The Power BI Tips Theme Generator tool already allows you to easily interact with, and adjust, all the visual properties, wireframes, etc… How could w...
Aug 14, 2023
Introducing the New PowerBI.Tips WireFrames Feature In the dynamic landscape of data visualization, staying ahead of the curve is crucial. Th...

Jun 7, 2023
At Power BI Tips, we’re committed to providing you with the best tools and resources to enhance your report building experience. That’s why we’re thri...
May 18, 2023
In this episode of the Explicit Measures Podcast, we discuss the values of adding Python k...
Feb 28, 2023
Power BI is a powerful business intelligence tool that helps organizations to gain insights into their data. With its ability to create stunning visua...
Nov 3, 2022
PowerBI.Tips LOVES community. And we are out to prove it. We are so proud to announce Community Jam by PowerBI.Tips, t...

Oct 12, 2022
When the moon hits your eye… If Dean Martin were still alive and loved Power BI as much as we do… Do you think he might change up the lyrics of his so...
Sep 20, 2022
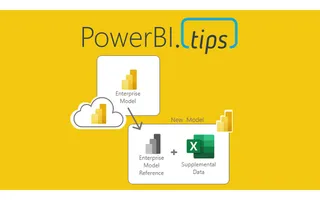
When you have really large data models loaded in powerbi.com there are challenges around quickly loading gigs of data into a data model. This is parti...
May 6, 2022
The Problem Most of you have probably run into a situation where someone in your organization has authored a report in the Power BI web service, a...
Apr 30, 2022
When organisations deploy Power BI, it is important to offer support to users. Often this can be in the form of formal help desk and tickets. In addit...

Feb 10, 2022
If you want to start learning Power BI, or are looking to improve your skills, there are lots of areas you can start. However, learning itself is a sk...

Feb 10, 2022
Power BI continues to grow and strengthen its position in the enterprise space. A feature that you may not be aware of, but can be extremely valuable,...
Feb 3, 2022
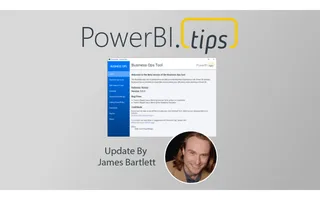
Howdy folks, and Happy New Year! We’ve just released Business Ops 3.0.2, which contains long-awaited updates for the following External Tools: [...

Jan 9, 2022
In the day to day operations of businesses speed of delivery, cost effectiveness, and satisfaction of outcome is a trifecta of challenges we run again...
Dec 22, 2021
Themes are the bedrock of consistency. As report authors it is important to create a consistent experience in a single, series or multitude of reports...

Dec 15, 2021
First of all, go read this amazing blog put out by Alberto Ferrari over at SQLBI that he posted awhile ago. It is the context for the conversation we...

Dec 12, 2021
This month we partnered with the relaunch of the Des Moines user group to host Matthew Roche. This month’s topic is all about data culture. If you don...

Dec 9, 2021
This topic was gleaned from the absolute wealth of knowledge put down in the MSFT [Power BI Adoption Roadmap](https://docs.microsoft.com/en-us/power-b...
Dec 7, 2021
To say this another way. Not all columns have datatypes in DAX, specifically speaking to using dynamic ranking with an “Other” category. Let me explai...

Dec 2, 2021
Trolling… we should clear up the definition of this right off the bat. We aren’t talking about the type of trolling where we spend a bunch of time fin...
Nov 27, 2021
We’ve been having an amazing amount of fun having conversations on our podcast “[Explicit Measures](https://powerbi.tips/explicit-measures-power-bi-po...
Oct 19, 2021
Howdy, folks! This past weekend, I was a man on a mission. There were two pressing reasons for a new release of Business Ops: 1. The authors of man...

Oct 6, 2021
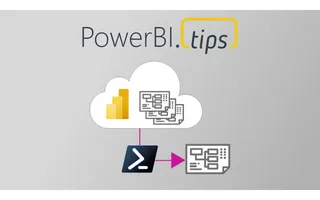
Learn how to use the Power BI Scanner API to manage your tenant's entire metadata. Thanks to Ferry Bouwman and Rui Romano for their contributions.
Oct 3, 2021
UPDATE: All downloads for business ops has moved to github releases page dedicated to this project here: [https://github.com/MikeCarlo/BusinessOps...
Sep 23, 2021
Where does the Power BI Mobile app fit within your report building plan? This topic is widely un-discussed within the Power BI community. Many blogs a...

Sep 23, 2021
Howdy folks! I just published three new time-saving scripts for Tabular Editor to the PowerBI.tips TabularEditor-Scripts repository.
Sep 12, 2021
Howdy, folks! A few months ago, I was writing and running various PowerShell scripts to manipulate the connected data models in my Power BI Desktop f...
Jun 22, 2021
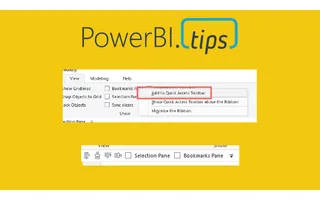
This article describes Power BI Bookmarks tips, tricks, and best practices. Bookmarks are a powerful feature that can greatly improve the reader's experience.
May 19, 2021
This article follows from Episode 5 of the new Explicit Measures Podcast, a whole new way to talk about Power BI. If this article strikes you as rele...

May 11, 2021
This is part 3 of 3 in a series designed to help Power BI users and enthusiasts. This post focuses on representing your skills when the time comes.

May 4, 2021
Welcome to a new podcast from PowerBI.tips — the Explicit Measures Podcast featuring Mike Carlo, Tommy Puglia, and Seth Bauer.
Apr 25, 2021
One of the biggest improvements you can make to your life and career is embracing a learning mentality. If you are here, I assume one of your inte...

Mar 9, 2021
Using Power Apps Power BI and Power Automate together can unleash huge benefits and enhance your solutions. Creating an end-user-centric dashboard and...

Feb 19, 2021
Well, it’s Friday, time to take a little break and play the Dice Game! The Power BI community is creative and is always developing amazing ideas. This...
Feb 16, 2021
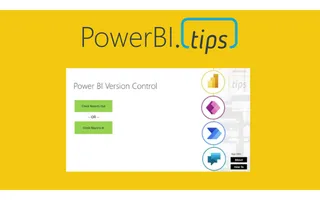
Power BI Version Control is a free, fully-packaged solution that lets users apply version control, local editing, and manage PBIX or PBIT files. The s...
Feb 11, 2021
Power BI took the BI world by storm 5 years ago, there has been a release of the Power BI Desktop almost every single month. The infant that was Power...
Jan 5, 2021
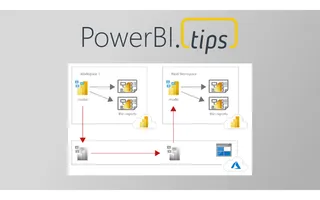
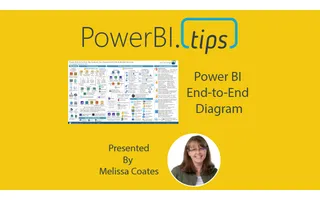
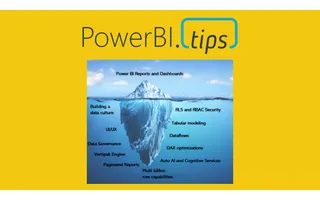
Melissa Coates of Coates Data Strategies has produced a new version of the Power BI End-to-End architecture document. If you haven’t seen this documen...
Jan 1, 2021
Please navigate to the following page to see Power BI Version Control: https://powerbi.tips/2021/02/power-bi-version-control/...
Dec 22, 2020
I was having a candid conversation with Phil Seamark from DAX.tips about Aggregation Tables. During that conversation, I was aski...
Dec 16, 2020
Well Microsoft has done it again. They have added a great feature in the Power BI desktop release for December 2020. Direct Query to Power BI data sou...
Dec 13, 2020
This article will focus on Power BI architecture within a data solution. In this context, Power BI architecture describes how Power BI can slot in a...
Nov 18, 2020
The Power BI Field Finder created by Stephanie Bruno was just updated. In this recent update the HTML viewer has been updated since the old custom vis...
Nov 18, 2020
We just completed an amazing webinar from Parker Stevens over at BI Elite. In this webinar, Parker walks us through how to connect to the Power BI Admin APIs.

Oct 30, 2020
I was recently contacted by Power BI Community member Gomathy Viswanathan and Ashwini Nayak. Thus, it is my pleasure share with you their incredible r...

Oct 29, 2020
The Milwaukee Crew is back at it again with the October 2020 Power BI User Group (PUG). This month we have the amazing Gil Raviv talk to us about Powe...

Oct 26, 2020
Daniel Marsh-Patrick is a custom visual developer who recently released the HTML Content, a custom visual. This month we go over this visual in detail...
Oct 23, 2020
Horary! The Power BI desktop for October finally arrived and it is packed with tons of updates. I’m super excited about this month’s release. We ralli...
Oct 23, 2020
Power BI is a powerful reporting tool that has been dominating the market and rapidly evolving. Yet, in many organizations people seem unaware of its...
Oct 22, 2020
In the October 2020 release of Power BI desktop you have the ability to load a dataset from the splash page. For this tutorial we dig in on how Micros...

Oct 15, 2020
This month I had the privilege of participating in the Power BI Quiz. If you don’t know about the Power BI Quiz show, this is an event that is put on...

Sep 30, 2020
We were excited to welcome a good friend of PowerBI.Tips Alex Powers to speak with us at this months PUG meet...

Sep 29, 2020
This month we got the Power BI desktop update a little bit later because it was released during the 2020 Ignite conference. Here's our MVPs React recap.
Sep 29, 2020
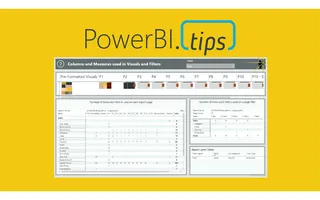
What does it take to design and create a great looking report in Power BI? Do you have a clear understanding of what tools and techniques you should u...
Sep 8, 2020
This tip outlines an easy deployment method for data tables that have been manually added to a model via “Enter data” in Power BI Desktop. This is a v...
Aug 31, 2020
Back again with another Power BI User group for Milwaukee. This month Mike and Seth walk through the beta release of external tools. If you didn’t see...
Aug 13, 2020
Latest Version Download: ### Download the latest version of Hot Swap Connections using Business Ops...
Aug 13, 2020
We are excited to announce a new tool from PowerBI.tips — The Business Ops tool. One tool to install them all!

Aug 7, 2020
The Monkey Tools add-in for excel is really amazing. As a developer for Power BI for many years I’ve learn a ton of tips and tricks while working with...

Jul 31, 2020
Welcome to July! This month we have Tommy Puglia from the Chicago Power BI User Group joining us to discuss and talk about driving organizational succ...
Jul 22, 2020
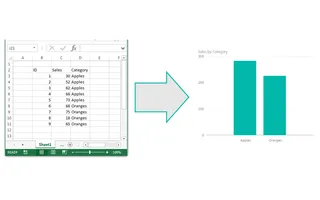
A common ask from users is the ability to view data related to visuals in excel. While there is an option to export data, the format is often unfriend...
Jul 21, 2020
This month we are trying something brand new. We are introducing a new series called MVPs react. As you may already know Power BI has monthly desktop...
Jul 15, 2020
If you haven’t heard about DAX Studio, well now you have. DAX studio is an essential tool for Power BI developers. It enables you to explore and tune...
Jul 1, 2020
This month’s Milwaukee Power BI User group we have Reza Rad from Radacad.com. Reza has a long history within the Power BI MVP...

Jun 16, 2020
I am working on a project that uses Power BI embedded to display reports to external users via an application. I’ve used the progression of A sku’s (e...
Jun 8, 2020
Shared datasets are a great way to share data models across the organization. This enables users to maintain one source of the truth and increase effi...
Jun 3, 2020
Understand more about your model then you thought possible! This is part two in our series on DAX Studio. If you missed part one be sure to check out...
May 29, 2020
Let’s say you have a Power BI file connected to an Analysis Services machine. Then you want to change the data source to PowerBI.com using a Live Conn...

May 25, 2020
If you’ve played around with MapBox in Power BI – you’ll know that it has loads of great features to create really rich and beautiful maps, including...

May 19, 2020
If you’ve played around with MapBox in Power BI – you’ll know that it has loads of great features to create really rich and beautiful maps! One featur...

May 14, 2020
Darren Gosbell & Marco Russo join PowerBI.Tips in a 4 part series on how and why to use DAX Studio! They show us why DAX Studio is the ultimate tool...

May 12, 2020
If you’ve played around with MapBox in Power BI – you’ll know that it has loads of great features to create really rich and beautiful maps! And one of...

May 8, 2020
The Milwaukee Brew City PUG for April kicks off with some quick updates and highlights of upcoming events. We spend a quick minute on why we’re so exc...

May 6, 2020
The April 2020 Power BI desktop release is an amazing release. This month the Power BI team has released a new lasso feature to enable users to select...

Apr 16, 2020
The ALM Toolkit is an excellent tool for aiding users with Tabular Model management. Christian Wade has been generous enough to provide us with a deta...

Apr 7, 2020
Maps are a fantastic way to communicate spatial data – and lucky for us Power BI has loads of awesome mapping visuals to choose from. However, the Map...

Apr 2, 2020
Tabular Editor is an incredible Tool that enables users to manipulate a Tabular model at lighting speeds. Daniel Otykier is the creator of the Tabula...
Mar 23, 2020
The Milwaukee Brew City PUG for February had tons of rich demo content. Steve Campbell delivered quite a session for an hour and a half. We were able...

Mar 4, 2020
I was recently working on some new ideas for a Scrim when I stumbled upon something interesting. A scrim is pretty specific in its layout, and this on...
Feb 17, 2020
As a report author it is important that you build the necessary context for your end users. The main areas most often needing context either relate to...
Feb 12, 2020
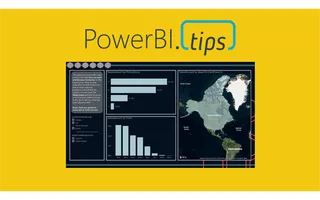
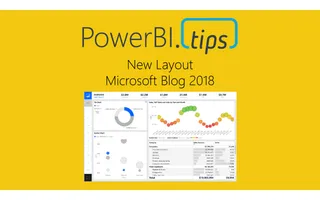
This report is just over the top amazing cool! Check out the work done by the Microsoft team to make this incredible report. It is called the Microsof...

Feb 10, 2020
This article is the second part in a series on API calls. It will look at some best practices and considerations when using API calls in Power Query....

Feb 4, 2020
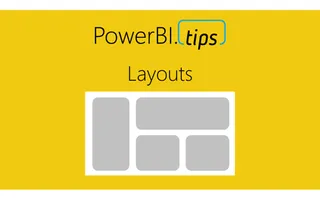
Recently I had the privilege of working with Microsoft doing a Webinar on layouts. One thing we are passionate about at PowerBI.Tips is good looking r...
Feb 4, 2020
Here we are, jumping in to 2020. This Month PowerBI.Tips is kicking off and sponsoring the next year of Power BI user groups (PUGs) for Milwaukee. If...
Jan 29, 2020
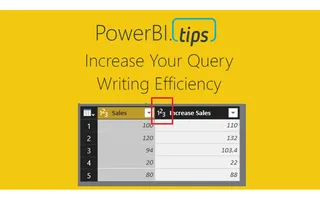
If you’re like me, building a data model in Power BI is an iterative process. Sometimes, you try out different ways of writing measures before you hi...
Jan 22, 2020
This month we did a webinar with the Microsoft team on how to build different custom visuals in Charts.PowerBI.Tips a...
Jan 16, 2020
This article examines using the advanced editor in Power Query to better handle when things go wrong. It will also allow custom actions to be triggere...
Jan 14, 2020
KPIs are a key visualization type used to convey high level metrics to the end users. They provide an at-a-glance metric that allows business users to...
Dec 23, 2019
PowerBI.tips is excited to announce our new tool to help you build the best looking reports, Scrims. We’ve...
Dec 21, 2019
Thanks for your interest in our product Scrims. For more details on what is a scrim click this link to Learn More. Download a scrim from the prod...
Dec 6, 2019
In some recent conversations the notion of minimizing the number of required visuals came up as a topic. While I know from talking with the Microsoft...
Nov 27, 2019
Over the course of time Power BI has come to encompass a wide variety of technologies and tools. One such product that has been integrated into the su...

Nov 20, 2019
For each visual in Power BI Desktop there is a button called Focus Mode. This feature highlights a single visual. While this can be helpful, it does r...
Nov 12, 2019
We do a ton of Layouts here at powerbi.tips and with the introduction of the new visual grouping feature I wa...

Nov 9, 2019
This post will walk through how to pull an estimated household income from a US address. It will be completed all in the Power Query Editor. We will c...
Nov 5, 2019
For this week we are building a stacked bar chart on https://Charts.PowerBI.Tips. While you can build this type of char...
Oct 30, 2019
This month at our Power BI User group in Milwaukee Seth and myself walk through some of the basics of Power BI. We digest how can we leverage Power BI...
Oct 29, 2019
Power BI requires a gateway for refreshing on premises data sources. There are a myriad of different data sources that you can create and two differen...
Oct 23, 2019
In October of 2019 Power BI released a new file type, PBIDS. The Power BI Desktop Source (PBIDS) file is a JSON object file that aids users connecting...

Oct 22, 2019
This post will walk through how to pull daily stock price from Yahoo! Finance, then transform the data using a technique called a query branch. It wil...
Oct 15, 2019
As a user that builds Power BI reports, did you know the different technologies that come into play when you interact with the tool? This is one of th...
Oct 8, 2019
We are starting today off with a fun chart. We will be making a filled donut chart. Typically, I don’t use donut charts but in this case I think we ha...
Oct 2, 2019
As report authors we sometimes get caught up in how easy it is to create a report and provide value to the business. Each report is an opportunity to...
Sep 30, 2019
This post will answer how to sort a measure that returns text values to a custom order, without affecting other columns. It will utilize the DAX funct...
Sep 26, 2019
Grouping with Style The release of grouping visuals was an extremely welcomed feature. As one who builds lots of reports grouping elements together...
Sep 17, 2019
I recently encountered a really frustrating experience related to a set of reports seeming to not update after some data source changes. I’d done this...
Sep 11, 2019
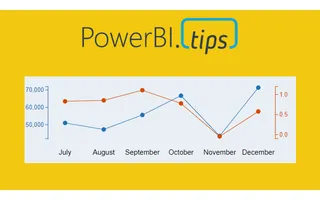
Ever need two different scales on the Y-Axis of a line chart? If so, then this tutorial is for you. Learn how to create a dual y-axis line chart.
Sep 3, 2019
There are different ways you can connect to a multitude of different data sources. I’ve written about the different connection types before and you ca...
Aug 30, 2019
This layout continues to deliver fantastic visual guides to make your reports look top notch. This layout utilizes buttons for navigation without lock...
Aug 8, 2019
Sometimes, we want the users to see different metrics, but do not want to take up too much space on our page. The scenario we are going to walk throug...

Jul 18, 2019
I am just bursting with excitement!! This month the amazing Power BI team has yet again come out with a great new feature, Icon sets. In addition to t...
Jul 11, 2019
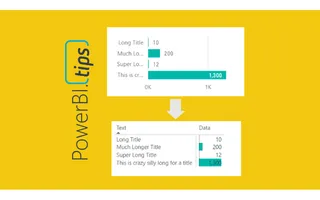
Time and time again when I begin talking with Excel users and ask to see what current reports they are using, they usually show me a table with a mixe...
Jul 3, 2019
I’m a lazy engineer. Let me qualify my statement. In lazy I mean I like to find the path of least resistance, the shortest distance between two poin...

Jun 20, 2019
This year the Microsoft Business Application Summit (MBAS) was held in Atlanta Georgia. Despite some travel snafu’s (3 rebooking’s and 9 delays), we m...
Jun 20, 2019
Welcome to another installment of building custom visuals with the Charts tool from PowerBI.Tips.
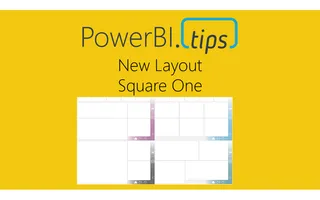
May 1, 2019
“Square One” utilizes the color theme as a background component that adds a pop of accent color only. This gives you the end user the maximum flexibil...
Mar 21, 2019
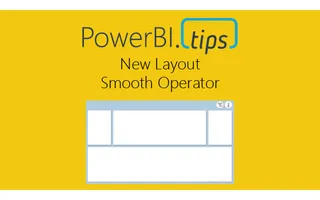
Hey everyone! We're excited to release our latest layout 'Smooth Operator'. Download it now and give your reports a fresh look.

Feb 12, 2019
With the release of the custom visuals building tool Charts.PowerBI.Tips we received a number of comments requesting tu...

Jan 21, 2019
To celebrate joining the Power BI Cat team next week, I thought I would update a DAX game I built last November (2018) which was a DAX-based maze game...
Dec 4, 2018
If you are like me and you like making your reports look extra good with different visual elements you’ve probably come across the issue before where...

Nov 26, 2018
If you haven’t had your mind melted over the past few games that Phil Seamark has developed here is one more, aMAZEing DAX. This month’s game is a Ga...
Nov 13, 2018
I have been holding on to a copy of Satya Nadella’s book “Hit Refresh” for quite some time. With all the Power BI goodness, the job, etc.… I just hadn...
Oct 2, 2018
In the September 2018 blog post the Microsoft team released a new layout. This layout has a number of really nice design elements. However, upon rev...
Sep 10, 2018
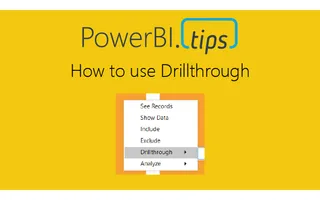
In Power BI reports various features are used to enhance the reporting experience. Drillthrough allows users to navigate to different report pages wi...
Sep 10, 2018
In Power BI reports various features are used to enhance the reporting experience. A hierarchy is a ordered set of values that are linked to the leve...
Sep 10, 2018
In Power BI reports various features are used to enhance the reporting experience. The Ellipsis allows users to open an option menu specific to a vis...
Sep 10, 2018
In Power BI reports various features are used to enhance the reporting experience. Focus mode allows for a single visual to expand for dedicated inte...
Sep 10, 2018
In Power BI reports various features are used to enhance the reporting experience. Tooltips appear when the cursor is hovering over a visual. Not al...

Sep 4, 2018
When you design a report, there are a number of things to consider. For example, the types of visuals, the colors used within the visuals, and the lo...

Aug 21, 2018
PowerBI.Tips and Phil Seamark are proud to release our third game written in Power BI, DAX Mission Impossible. This game is similar to the game play...
Jul 30, 2018
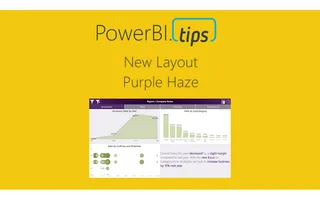
In honor of the 2018 Business Applications Summit, PowerBI.Tips has published a new layout, Purple Haze. Purple Haze is the brain child of Seth Bauer...
Jul 28, 2018
Want to give a special thanks to the Microsoft PowerBI team for allowing PowerBI.Tips to participate in the 2018 Microsoft Business Application Summit...

Jul 17, 2018
I am proud to announce another joint development game between Philip Seamark and myself (Mike Carlo) of a Tic Tac Toe game. To read about how this ga...
Jul 9, 2018
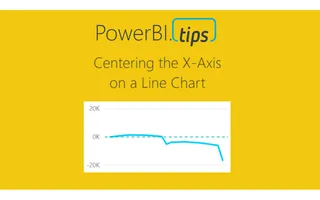
Sometimes when your working on a line chart you want the x-axis to stay centered on a chart. This tutorial will walk you through how to create an X-Ax...

Jun 22, 2018
This week Philip Seamark, an avid Power BI developer has released a joint project with PowerBI.Tips, a full Sudoku game in Power BI. To be totally ho...

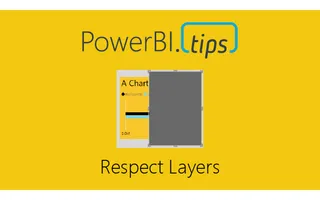
Jun 20, 2018
This weeks tutorial focuses on the need to control groups of visuals independently. This recently came up in a project where I needed to adjust all t...
Jun 6, 2018
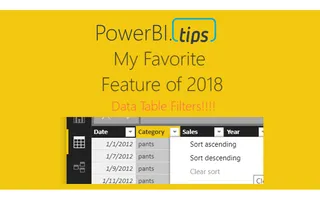
Hands down best feature this year to date, Data Table Filtering! In the June 2018 Power BI Desktop Microsoft released the ability for you to navigate...
May 17, 2018
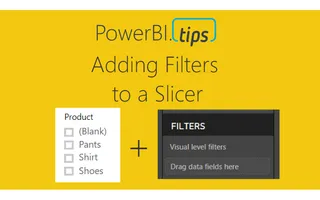
Often when working with a Power BI report you will add a slicer that has a “Blank” item in the selection criteria. From a usability standpoint you mi...
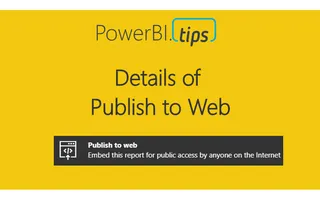
Apr 23, 2018
There are often questions surrounding Publish to Web. What is it? How can I use it to share my reports? This video walks through the proper usage f...

Apr 18, 2018
Update: This tool has been deprecated as of 2024-11-27. You can now find this as a downloadable HTML file on GitHub.
Feb 26, 2018
Of all the connection types, I’ve always gravitated towards this one. I imagine it is because I come from the database developer side of things. I’m a...
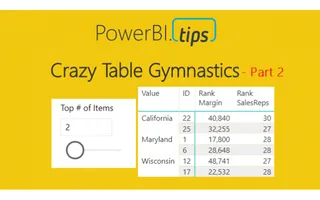
Feb 21, 2018
This is part 2 in the 3 part series on developing super cool tables using some fancy measures. In part 1 we walked through how to build a table that...
Feb 14, 2018
When I teach Power BI to new users, there are typically questions about how to get Power BI to act more like Pivot Tables in Excel. Through my discus...
Jan 31, 2018
If you have spent any time working in Power BI, your very first step is to, wait for it… Get Data. Using Get Data will start loading your data into t...

Jan 19, 2018
First off, let me say WOW! The announcement of Layouts was well received by the Power BI Community. Thank you so much for the positive feedback. So...
Jan 16, 2018
PowerBI.tips is extremely happy to be part of, and contribute to, the Power BI Community. We’re constantly trying to think of new and interesting ways...
Jan 15, 2018
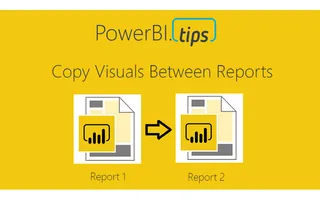
There are cases when working with Power BI files, that you would want to transfer a visual from one report to another report. While this feature is n...
Dec 29, 2017
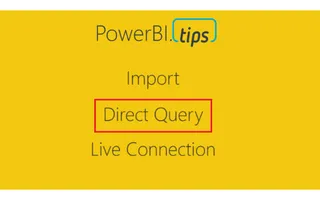
Now that we've covered the basics of connection types, let's dive into Direct Query and when to use it for your Power BI reports.
Dec 20, 2017
While on a recent project I needed to build a variation of the DAX date table with start-of-month dates. Here's how to create one.
Nov 24, 2017
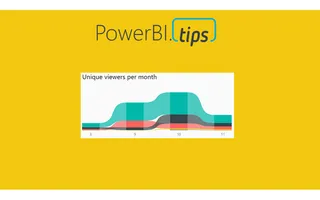
One of the really cool features contained within the PowerBI.com service is the ability to monitor how often your dashboard or report is being viewed....
Nov 16, 2017
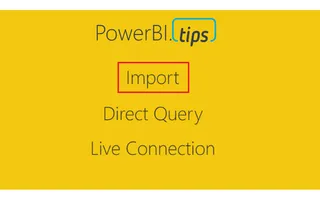
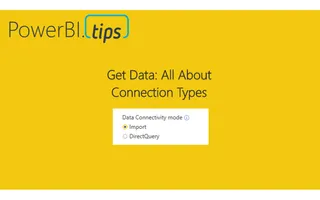
Power BI’s default connection type is Import. In fact, if you have never dealt with a data source that handles multiple loading methods, you may never...
Nov 14, 2017
The more you work with Power BI Desktop it is more than likely you will find some tool limitations that impact your overall design pursuits. As I hav...
Nov 1, 2017
There are many cases when you will need to create a date table within Power BI desktop. This could be as simple as creating a master date table or mo...
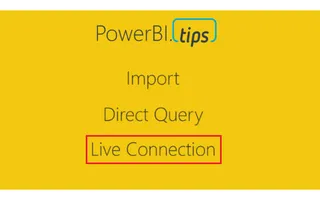
Oct 16, 2017
Get Data – Power BI Connection Types: An Introduction to understanding Import, Direct Query, and Live connections.

Oct 12, 2017
DAX (Database Access Expressions) can be quite complex. It is essential to being able to appropriately manipulate the Power BI data model for the vis...
Oct 11, 2017
To everyone who was able to attend the Power BI World Tour 2017, Thank you! It has been a pleasure presenting my favorite tips and trips. This post...
Sep 8, 2017
September is here and there is a new update for Power BI desktop! I’m so excited for this month’s update as there are many solid features. One of th...

Aug 14, 2017
I’ve been using Power BI since it was released back in 2015, and I’ve found that when talking with other PowerBI users there is always a little confus...
Aug 11, 2017
I love these updates, it’s like Christmas comes every month!! This month we get a ton of really great features, I for one am super pumped to get into...
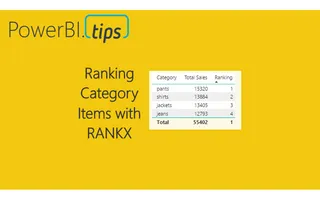
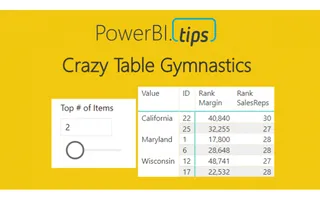
Jul 25, 2017
In many reports we produce we often need a method to score or rank data. For example, we may need to list the sales totals for the sales team and ran...
Jul 5, 2017
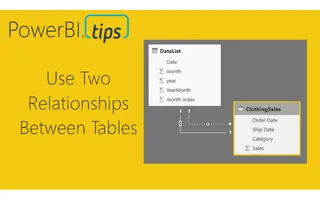
For those of you who work in supply chain management this tutorial will be right up your alley. In my previous job position I had a lot of interactio...
Jul 3, 2017
Here is another great tutorial from Curbal. This tutorial teaches you how to use the DAX function UserRelationship. This is important when your deal...

Jun 13, 2017
This year I had the wonderful privilege to attend the Microsoft Data Insights summit for 2017 as a speaker. My topic was the Top Ten Tutorials from P...
Jun 10, 2017
This month we have a big release for Power BI Desktop and for the Power BI service. There are a number of great new features. For the everyday user...
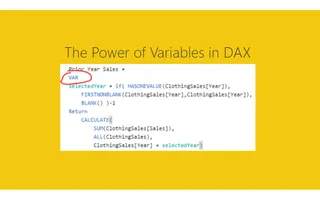
May 5, 2017
Every so often you find a hidden gem, something so valuable, just hiding there in plain sight. Recently, I found out that I LOVE the using Variables...
May 3, 2017
It’s that exciting time of month again. Time for another power BI desktop release. This month here are a couple of good highlights you should check...
Apr 6, 2017
Learn how to use SUM() and SUMX() with this great video from Curbal. As you become more familiar with PowerBI you will increase your understanding of...

Apr 5, 2017
This video talks about how to create custom links that apply report level filters. This is super cool and provides a ton of wide flexibility when bui...
Apr 4, 2017
With another month comes another exciting release of PowerBI desktop. This month we have a number of really interesting features releases. One of th...

Mar 28, 2017
Here is a super helpful video from Guy in a Cube about how to have multiple logins using Google Chrome. Often I find my self juggling between a work...
Mar 21, 2017
This week I had a number of team members tell me how difficult it was to share a PBIX file and the corresponding data between team members. The depar...

Mar 6, 2017
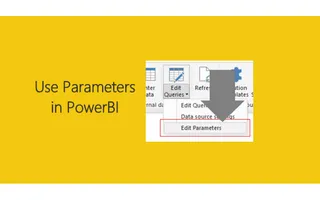
March is an exciting month, and with this release of Power BI we have been given some long asked for features. One such feature is the ability to impo...
Mar 5, 2017
This month it is a major game changer. PowerBI has introduced the ability to change the color theme of your Power BI reports. What does this mean fo...
Feb 28, 2017
For a while now I have been longing to spend more time learning all the ins and out of Power BI embedded. From the line of work that I do, I can see...

Feb 21, 2017
For those of you who are following my tutorials, you are most likely to understand that each tutorial comes with it’s own data source. This has been...
Feb 16, 2017
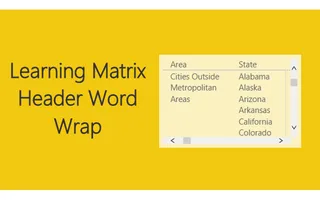
Power BI has been an continually evolving tool over the last year. The Matrix visual is powerful and mimics much of the functionality of a Pivot Tabl...
Feb 7, 2017
The long awaited PowerBI Desktop release is here. I’d like to point out a couple of key features that will help you improve your reports. First, the...

Dec 23, 2016
This past week I was talking with the big guy up north, jolly old fella, and the discussion came up about his toy production levels. Santa was compla...
Dec 5, 2016
This tutorial is a variation on the month to month percent change tutorial. Th...
Nov 16, 2016
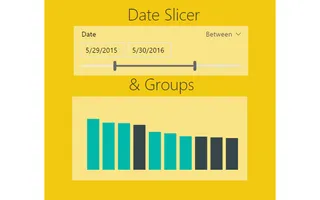
In the October update of PowerBI Desktop we were given a number of really useful features, ranging from a new Date Slicer, Grid lines, Grouping, Binni...
Oct 17, 2016
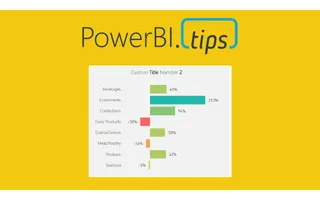
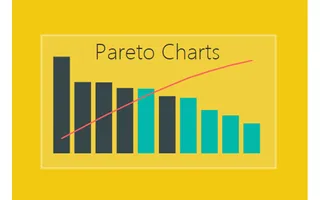
Build a Pareto chart in Power BI using DAX measures for cumulative totals and percentages. Identify which products comprise the majority of your sales.
Oct 10, 2016
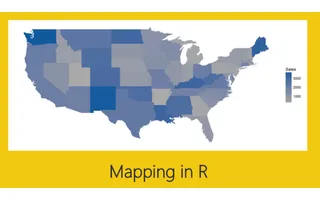
Create a US map in Power BI with state labels and year-over-year change indicators using R and ggplot2. Color-coded labels show positive and negative trends.
Oct 4, 2016
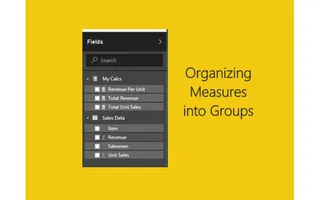
Organize your Power BI data model by creating a dedicated measures table. Group all your DAX measures in one place for cleaner, more maintainable reports.

Oct 3, 2016
Discover Guy In a Cube, one of the best Power BI video content creators. Adam Saxton from Microsoft delivers short, packed tutorials that are incredibly helpful.
Sep 30, 2016
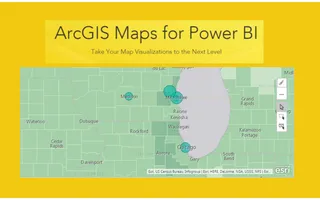
Explore the ArcGIS Maps visual in Power BI with heat maps, reference layers, and advanced selection tools. Add demographic overlays like household income.

Sep 27, 2016
Create beautiful hexagonal bin plots in Power BI using R and ggplot2. Visualize data density with heat map style honeycomb patterns.
Sep 21, 2016
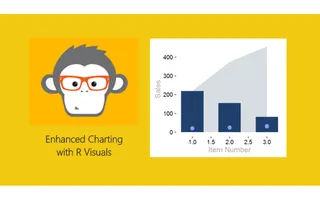
Create advanced R visuals in Power BI combining area plots, bar charts, and scatter points using ggplot2. Learn how R scripts respond to slicer selections.

Sep 15, 2016
Get started with R visuals in Power BI Desktop. Install Microsoft R Open, configure Power BI, and create your first correlation plot using the corrplot package.
Sep 1, 2016
Learn how to connect Power BI Desktop to SharePoint document libraries and load Excel files. Enable scheduled data refreshes with SharePoint O365.
Aug 31, 2016
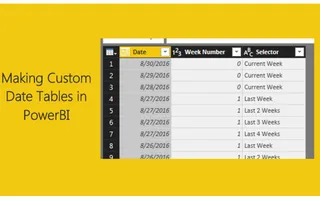
Create a custom dynamic date table in Power BI Query Editor using M language. Build week-based selectors that automatically update when refreshed.
Aug 30, 2016
Learn how to create custom calendars in Power BI using DAX with Calendar() and CalendarAuto() functions. Video tutorial from Ruth Pozuelo at Curbal.
Aug 10, 2016
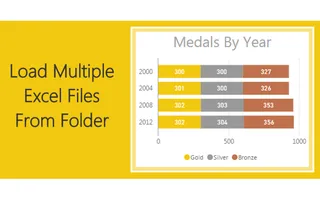
Learn how to load multiple Excel files from a folder into Power BI using a custom function. Combine workbooks with multiple sheets into a single query.
Aug 4, 2016
Learn how to create a variable query in Power BI to manage file locations. When you move files, update one query instead of changing every source path.
Jul 28, 2016
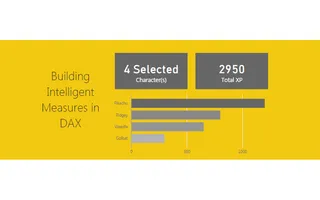
Create a smart card visual in Power BI that displays the selected item name when one item is chosen, or shows the count when multiple items are selected.
Jul 14, 2016
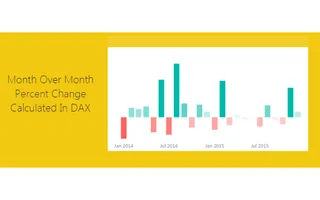
Learn how to calculate month-to-month percent change in Power BI using DAX. Use PREVIOUSMONTH to compare current month sales against prior month values.

Jun 16, 2016
Learn how to automatically load only the most recent file from a folder in Power BI. Perfect for automated reports that receive daily data files.
Jun 10, 2016
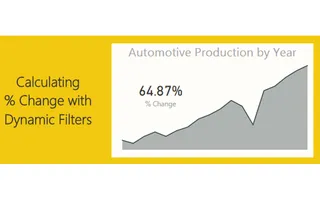
Build a DAX measure that dynamically calculates percent change as you select different items in Power BI visuals. Learn to use DIVIDE and FILTER functions.
May 27, 2016
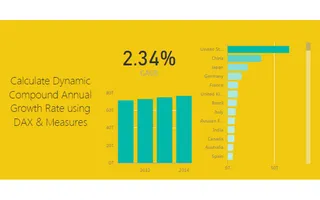
Learn how to calculate a dynamic Compound Annual Growth Rate (CAGR) in Power BI using DAX. The calculation updates automatically as you select different data points.
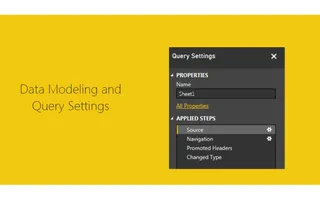
May 19, 2016
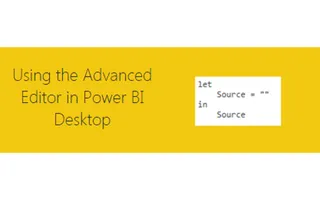
Learn how to copy and paste queries to and from the Query Editor using the Advanced Editor. Master the M language to share and model your Power BI data.
May 7, 2016
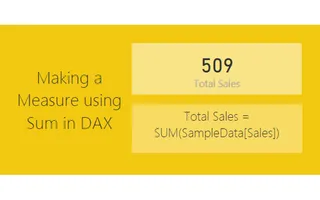
Learn how to create measures in Power BI to calculate totals using the SUM function in DAX. Watch how totals dynamically change as you select different data points.
May 2, 2016
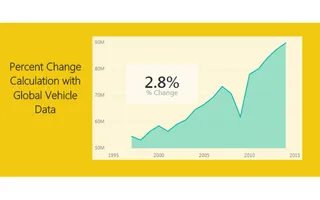
Learn how to create percent change calculations in Power BI using DAX measures with practical examples using real-world automotive production data.

Apr 27, 2016
Learn how to create histograms with custom bins in Power BI using DAX measures to categorize and visualize your data distributions.

Apr 20, 2016
Learn how to pull data directly from Wikipedia into Power BI and create a beautiful filled map showing US population growth by state.

Apr 14, 2016
Learn how to create impressive map visualizations in Power BI Desktop using latitude and longitude data with this step-by-step mapping tutorial.
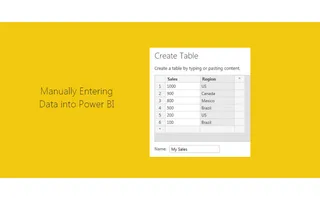
Apr 13, 2016
Learn how to manually enter data directly into Power BI Desktop to create small tables for your visualizations without needing external files.
Apr 11, 2016
Learn how to troubleshoot and fix broken file connections in Power BI Desktop when your data source has moved or can't be found.
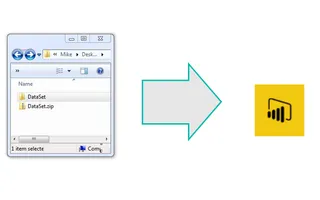
Apr 7, 2016
Learn how to load multiple files from a folder into Power BI Desktop using the powerful automated data loading feature that will change how you work with data.
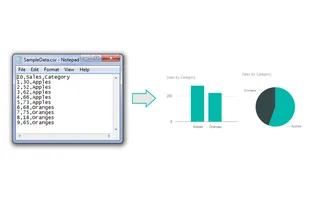
Apr 1, 2016
Learn how to import CSV files into Power BI Desktop, create tables and charts, and copy visuals to build compelling data visualizations.
Mar 29, 2016
Learn how to load data from Excel into Power BI Desktop with this simple step-by-step tutorial covering the Get Data function and basic visualizations.
Mar 26, 2016
Welcome to PowerBI.tips, a blog dedicated to learning and developing visualizations for Power BI Desktop, PowerBI.com, and data modeling in Excel.